Cos Cob: Fire Incidents, Connecticut (CT)
Where are fire incidents reported in Cos Cob, CT
Something went wrong! Please refresh the page.
|
| |||||||||||||||||||||||||||||||||||||||||||||||||||||||||||||||||||||||||||||||||||||||||||||||||||||||||||||
2007 - 2018 National Fire Incident Reporting System (NFIRS) incidents
- Incident types reported to NFIRS in Cos Cob, CT
- 64134.2%False Alarm
- 62633.4%Hazardous Condition
- 20210.8%Fire
- 1568.3%Service Call
- 1256.7%Rescue & EMS
- 1005.3%Good Intent Call
- 160.9%Severe Weather
- 60.3%Overpressure Rupture
- 20.1%Special Incident
- Fire incident types reported to NFIRS in Cos Cob, CT
- 8944.1%Structure Fires
- 8240.6%Outside Fires
- 188.9%Mobile Property/Vehicle Fires
- 136.4%Other
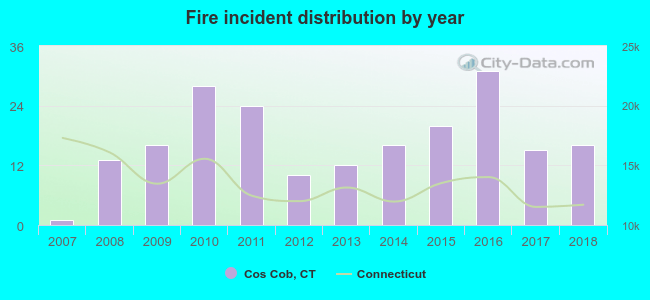 Based on the data from the years 2007 - 2018 the average number of fires per year is 17. The highest number of fires - 31 took place in 2016, and the least - 1 in 2007. The data has an increasing trend.
The average number of yearly fire incidents per 10k residents in Cos Cob, CT compared to nearest cities:
(Note: Based on data for the last 3 years, including only cities with population 5,000 and above)
| Cos Cob: | 30.5 |
| Greenwich: | 14.0 |
| Old Greenwich: | 4.0 |
| Stamford: | 24.3 |
| Darien: | 23.6 |
| New Canaan: | 22.5 |
| Norwalk: | 29.7 |
| Wilton: | 24.5 |
| Westport: | 32.1 |

 27.2% incidents where reported in the morning and 72.8% in the evening. The most fires (15.8%) took place on Wednesday, and the least (11.9%) on Tuesday.
 According to the 202 fire incidents from years 2007 - 2018 most fires (12.4%) took place during July, and the least (5.4%) in August.
 Out of all 1,874 cases reported during the years 2007 - 2018, the most belonged to the categories: False Alarm (34.2%), Hazardous Condition (33.4%), and Fire (10.8%).
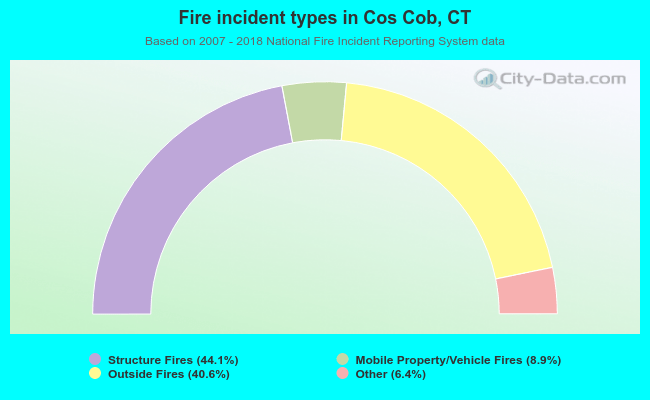 When looking into fire subcategories, the most incidents belonged to: Structure Fires (44.1%), and Outside Fires (40.6%).