Clemmons: Fire Incidents, North Carolina (NC)
Where are fire incidents reported in Clemmons, NC
Something went wrong! Please refresh the page.
| Fire incidents reported | |
|---|---|
| Sreet name | Count |
| LEWISVILLE-CLEMMONS RD | 200 |
| CLEMMONS RD | 162 |
| LASATER RD | 86 |
| INTERSTATE 40 | 84 |
| HAMPTON RD | 78 |
| LEWISVILLECLEMMONS RD | 64 |
| FRYE BRIDGE RD | 60 |
| RIVER RIDGE DR | 58 |
| FAIR OAKS DR | 56 |
| MEADOWBROOK MALL CT | 52 |
| RAMADA DR | 48 |
| HARPER RD | 46 |
| HOLDER RD | 40 |
| LEWISVILLE CLEMMONS RD | 40 |
| STYERS FERRY RD | 40 |
| HAYWARD INDUSTRIAL DR | 36 |
| LEWISVILLE-CLEM 1400-1729 RD | 36 |
| MIDDLEBROOK DR | 32 |
| PEACE HAVEN RD | 32 |
| AMP DR | 30 |
| WILLOW TRACE CIR | 30 |
| SESSIONS CT | 26 |
| CENTER GROVE CHURCH RD | 24 |
| MUDDY CREEK RD | 24 |
| SOUTHWEST SCHOOL RD | 22 |
| TRINITY GARDEN CIR | 22 |
| WESTWOOD VILLAGE DR | 22 |
| CENTRAL RD | 20 |
| DOCK DAVIS RD | 20 |
| KENBRIDGE DR | 20 |
| Other | 363 |
2002 - 2018 National Fire Incident Reporting System (NFIRS) incidents
- Incident types reported to NFIRS in Clemmons, NC
- 6,49949.3%Rescue & EMS
- 1,87314.2%Fire
- 1,75613.3%Good Intent Call
- 1,2789.7%Hazardous Condition
- 1,2629.6%False Alarm
- 4863.7%Service Call
- Fire incident types reported to NFIRS in Clemmons, NC
- 67736.1%Structure Fires
- 60332.2%Other
- 40721.7%Outside Fires
- 1869.9%Mobile Property/Vehicle Fires
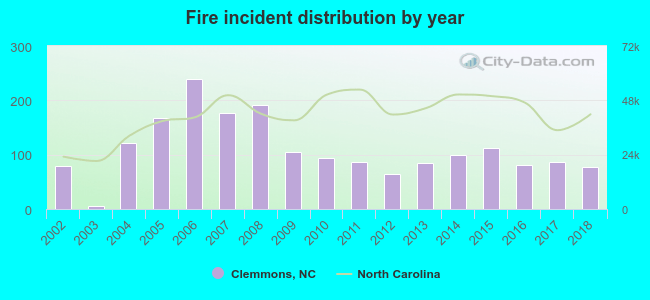 According to the data from the years 2002 - 2018 the average number of fires per year is 110. The highest number of fires - 240 took place in 2006, and the least - 6 in 2003. The data has a decreasing trend.
The average number of yearly fire incidents per 10k residents in Clemmons, NC compared to nearest cities:
(Note: Based on data for the last 3 years, including only cities with population 5,000 and above)
| Clemmons: | 41.7 |
| Lewisville: | 43.7 |
| Mocksville: | 327.2 |
| Lexington: | 172.1 |
| King: | 177.6 |
| Kernersville: | 86.2 |
| Thomasville: | 78.8 |
| High Point: | 21.2 |
| Trinity: | 78.1 |
 The median response time based on all reported fire incidents is 7 minutes. This is about the same as the North Carolina median value.
The median response time in Clemmons, NC compared to nearest cities:
(Note: Based on data for all years, including only cities with at least 500 fire incidents)
| Clemmons: | 7 minutes |
| Lewisville: | 7 minutes |
| Advance: | 7 minutes |
| Winston-Salem: | 4 minutes |
| Mocksville: | 7 minutes |
| East Bend: | 7 minutes |
| Rural Hall: | 8 minutes |
| Walkertown: | 7 minutes |
| Lexington: | 7 minutes |
 According to the data from the years 2002 - 2018 the average number of fire-related yearly casualties is 2. The highest number of reported injuries - 7 took place in 2017, and the lowest - 0 in 2002. The data has a rising trend.
The average number of injuries per 1,000 fires is 20. This indicator was the highest - 81 in 2017, and the lowest 0 in 2002. The trend for injuries per 1,000 incidents is increasing. Compared to the state value the number of casualties per 1,000 fire incidents is much higher.
According to the data from the years 2002 - 2018 the average number of fire-related yearly casualties is 2. The highest number of reported injuries - 7 took place in 2017, and the lowest - 0 in 2002. The data has a rising trend.
The average number of injuries per 1,000 fires is 20. This indicator was the highest - 81 in 2017, and the lowest 0 in 2002. The trend for injuries per 1,000 incidents is increasing. Compared to the state value the number of casualties per 1,000 fire incidents is much higher.Casualties per 1,000 incidents in Clemmons, NC compared to nearest cities:
(Note: Based on data for all years, including only cities with at least 500 fire incidents)
| Clemmons: | 19.2 |
| Lewisville: | 5.6 |
| Advance: | 8.9 |
| Winston-Salem: | 14.9 |
| Mocksville: | 5.7 |
| East Bend: | 2.5 |
| Rural Hall: | 7.0 |
| Walkertown: | 5.9 |
| Lexington: | 2.5 |
 33.2% incidents where reported in the morning and 66.8% in the evening. The most fires (15.9%) took place on Saturday, and the least (12.7%) on Sunday.
 Based on the 1,873 fire incident reports from years 2002 - 2018 most fires (10.3%) took place during March, and the least (6.2%) in October.
 Out of all 13,184 cases reported during the years 2002 - 2018, the most belonged to the categories: Rescue & EMS (49.3%), Fire (14.2%), and Good Intent Call (13.3%).
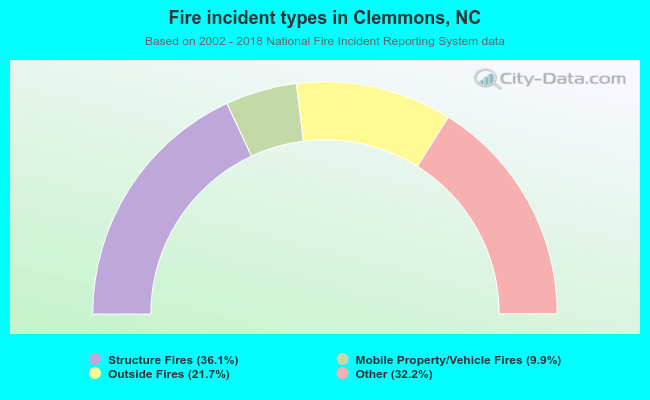 When looking into fire subcategories, the most reports belonged to: Structure Fires (36.1%), and Other (32.2%).