Clarksdale: Fire Incidents, Mississippi (MS)
Where are fire incidents reported in Clarksdale, MS
Something went wrong! Please refresh the page.
| Fire incidents reported | |
|---|---|
| Sreet name | Count |
| CHERRY ST | 166 |
| STATE ST | 94 |
| SPRUCE ST | 84 |
| SCHOOL ST | 80 |
| GARFIELD ST | 76 |
| PAGE ST | 62 |
| MAPLE ST | 56 |
| ANDERSON BLVD | 54 |
| GRANT ST | 54 |
| LYNN ST | 52 |
| MCKINLEY ST | 52 |
| DESOTO AVE | 50 |
| ESPY DR | 50 |
| SASSE ST | 50 |
| CATALPA ST | 46 |
| NEW AFRICA RD | 44 |
| PECAN ST | 42 |
| LEFLORE ST | 38 |
| LINCOLN ST | 38 |
| MISSISSIPPI ST | 38 |
| RITCHIE ST | 36 |
| LEE DR | 32 |
| MONROE ST | 32 |
| BOLIVAR ST | 30 |
| FRIARS POINT RD | 28 |
| SEVENTH ST | 28 |
| JEFFERSON ST | 26 |
| OAKHURST ST | 26 |
| SECOND ST | 26 |
| STATE HWY | 26 |
| Other | 1,041 |
2003 - 2018 National Fire Incident Reporting System (NFIRS) incidents
- Incident types reported to NFIRS in Clarksdale, MS
- 2,55769.9%Fire
- 39110.7%Hazardous Condition
- 38510.5%False Alarm
- 1684.6%Service Call
- 1052.9%Good Intent Call
- 431.2%Rescue & EMS
- 50.1%Severe Weather
- Fire incident types reported to NFIRS in Clarksdale, MS
- 1,09042.6%Structure Fires
- 59423.2%Outside Fires
- 55621.7%Mobile Property/Vehicle Fires
- 31712.4%Other
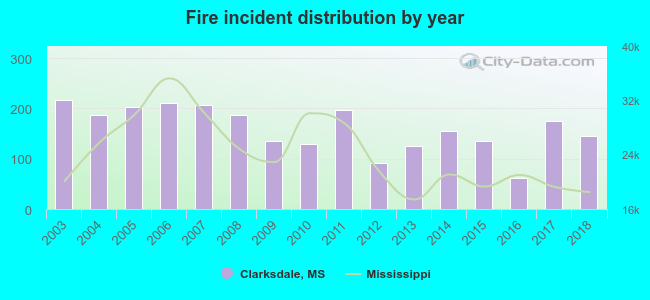 According to the data from the years 2003 - 2018 the average number of fires per year is 160. The highest number of reported fires - 216 took place in 2003, and the least - 61 in 2016. The data has a dropping trend.
The average number of yearly fire incidents per 10k residents in Clarksdale, MS compared to nearest cities:
(Note: Based on data for the last 3 years, including only cities with population 5,000 and above)
| Clarksdale: | 74.5 |
| Cleveland: | 91.8 |
| Batesville: | 247.3 |
| Senatobia: | 158.1 |
| Greenwood: | 73.3 |
| Indianola: | 80.7 |
| Grenada: | 133.0 |
 The median response time based on all reported fire incidents is 4 minutes. This is lower compared to the Mississippi median value.
The median response time in Clarksdale, MS compared to nearest cities:
(Note: Based on data for all years, including only cities with at least 500 fire incidents)
| Clarksdale: | 4 minutes |
| Lambert: | 9 minutes |
| Marks: | 9 minutes |
| Shelby: | 7 minutes |
| Helena: | 3 minutes |
| Helena-West Helena: | 3 minutes |
| West Helena: | 3 minutes |
| Charleston: | 9 minutes |
| Cleveland: | 3 minutes |
 Based on the data from the years 2003 - 2018 the average number of fire-related yearly deaths is 1. The highest number of deaths - 2 took place in 2004, and the lowest - 0 in 2005. The data has a decreasing trend.
The average number of fatalities per 1,000 fires is 3. This indicator was the highest - 16 in 2010, and the lowest 0 in 2005. The trend for fatalities per 1,000 fire incidents is declining. Compared to the state value the number of deaths per 1,000 fires is higher.
Based on the data from the years 2003 - 2018 the average number of fire-related yearly deaths is 1. The highest number of deaths - 2 took place in 2004, and the lowest - 0 in 2005. The data has a decreasing trend.
The average number of fatalities per 1,000 fires is 3. This indicator was the highest - 16 in 2010, and the lowest 0 in 2005. The trend for fatalities per 1,000 fire incidents is declining. Compared to the state value the number of deaths per 1,000 fires is higher.Deaths per 1,000 incidents in Clarksdale, MS compared to nearest cities:
(Note: Based on data for all years, including only cities with at least 2,500 fire incidents)
| Clarksdale: | 3.1 |
| Batesville: | 2.7 |
| Grenada: | 6.5 |
 According to the data from the years 2003 - 2018 the average number of fire-related casualties per year is 1. The highest number of injuries - 3 took place in 2003, and the lowest - 0 in 2004. The data has a decreasing trend.
The average number of injuries per 1,000 fires is 2. This indicator was the highest - 14 in 2003, and the lowest 0 in 2004. The trend for injuries per 1,000 fires is declining. Compared to the Mississippi value the number of injuries per 1,000 incidents is about the same.
According to the data from the years 2003 - 2018 the average number of fire-related casualties per year is 1. The highest number of injuries - 3 took place in 2003, and the lowest - 0 in 2004. The data has a decreasing trend.
The average number of injuries per 1,000 fires is 2. This indicator was the highest - 14 in 2003, and the lowest 0 in 2004. The trend for injuries per 1,000 fires is declining. Compared to the Mississippi value the number of injuries per 1,000 incidents is about the same.Casualties per 1,000 incidents in Clarksdale, MS compared to nearest cities:
(Note: Based on data for all years, including only cities with at least 500 fire incidents)
| Clarksdale: | 3.1 |
| Lambert: | 3.9 |
| Marks: | 1.4 |
| Shelby: | 1.7 |
| Helena: | 3.4 |
| Helena-West Helena: | 12.4 |
| West Helena: | 7.3 |
| Charleston: | 2.0 |
| Cleveland: | 7.2 |
 44.3% incidents where reported in the morning and 55.7% in the evening. The most fires (15.3%) took place on Saturday, and the least (13.5%) on Monday.
 Based on the 2,557 fire incidents from years 2003 - 2018 most fires (10.6%) took place during July, and the least (6.3%) in December.
 Out of all 3,659 cases reported during the years 2003 - 2018, the most belonged to the categories: Fire (69.9%), Hazardous Condition (10.7%), and False Alarm (10.5%).
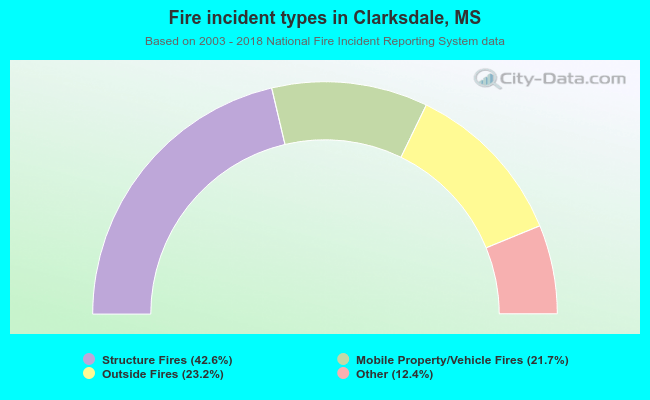 When looking into fire subcategories, the most incidents belonged to: Structure Fires (42.6%), and Outside Fires (23.2%).