Bellaire: Fire Incidents, Texas (TX)
Where are fire incidents reported in Bellaire, TX
Something went wrong! Please refresh the page.
|
| |||||||||||||||||||||||||||||||||||||||||||||||||||||||||||||||||||||||||||||||||||||||||||||||||||||||||||||
2002 - 2018 National Fire Incident Reporting System (NFIRS) incidents
- Incident types reported to NFIRS in Bellaire, TX
- 2,11036.5%Rescue & EMS
- 1,10919.2%Hazardous Condition
- 78213.5%False Alarm
- 69011.9%Good Intent Call
- 66911.6%Fire
- 4097.1%Service Call
- 120.2%Overpressure Rupture
- Fire incident types reported to NFIRS in Bellaire, TX
- 25838.6%Structure Fires
- 19128.6%Mobile Property/Vehicle Fires
- 16324.4%Outside Fires
- 578.5%Other
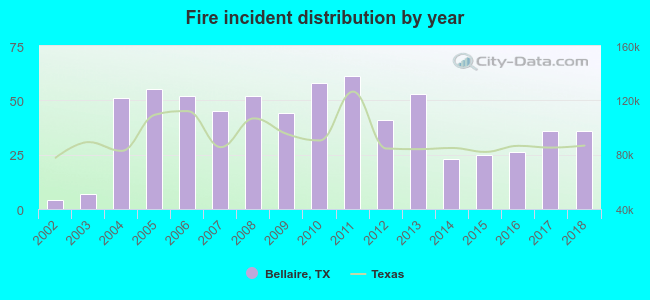 According to the data from the years 2002 - 2018 the average number of fire incidents per year is 39. The highest number of reported fire incidents - 61 took place in 2011, and the least - 4 in 2002. The data has a growing trend.
The average number of yearly fire incidents per 10k residents in Bellaire, TX compared to nearest cities:
(Note: Based on data for the last 3 years, including only cities with population 5,000 and above)
| Bellaire: | 17.9 |
| Houston: | 33.1 |
| Stafford: | 75.0 |
| Meadows Place: | 2.9 |
| Missouri City: | 28.7 |
| Sugar Land: | 18.3 |
| Fresno: | 16.6 |
| Galena Park: | 17.9 |
| Jacinto City: | 2.5 |
 The median response time based on all reported fire incidents is 4 minutes. This is lower than the state median value.
The median response time in Bellaire, TX compared to nearest cities:
(Note: Based on data for all years, including only cities with at least 500 fire incidents)
| Bellaire: | 4 minutes |
| Houston: | 6 minutes |
| Stafford: | 7 minutes |
| Missouri City: | 7 minutes |
| Sugar Land: | 6 minutes |
| Fresno: | 11 minutes |
| Pearland: | 7 minutes |
| Manvel: | 7 minutes |
| Pasadena: | 7 minutes |
 30.5% incidents where reported in the morning and 69.5% in the evening. The most fires (16.9%) took place on Tuesday, and the least (11.8%) on Sunday.
 Based on the 669 reports from years 2002 - 2018 most fires (12.3%) took place during April, and the least (6.0%) in July.
 Out of all 5,784 cases reported during the years 2002 - 2018, the most belonged to the categories: Rescue & EMS (36.5%), Hazardous Condition (19.2%), and False Alarm (13.5%).
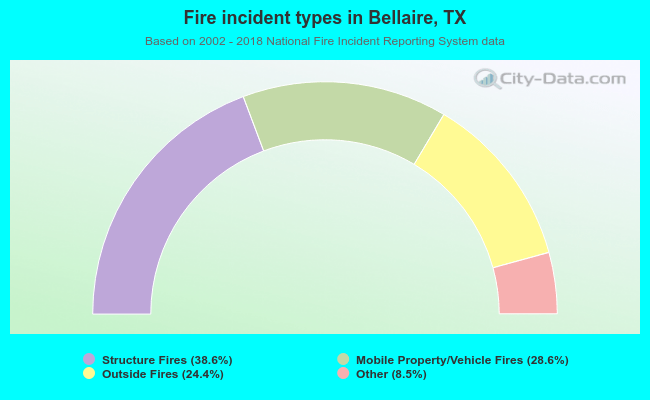 When looking into fire subcategories, the most incidents belonged to: Structure Fires (38.6%), and Mobile Property/Vehicle Fires (28.6%).