Bainbridge: Fire Incidents, Georgia (GA)
Where are fire incidents reported in Bainbridge, GA
Something went wrong! Please refresh the page.
| Fire incidents reported | |
|---|---|
| Sreet name | Count |
| BETHEL RD | 74 |
| SHOTWELL ST | 72 |
| BROUGHTON ST | 64 |
| COLLEGE ST | 58 |
| COLQUITT HWY | 48 |
| FACEVILLE HWY | 48 |
| LAKE DR | 48 |
| WATER ST | 48 |
| DOTHAN RD | 44 |
| SPRING CREEK RD | 44 |
| TALLAHASSEE HWY | 42 |
| VADA RD | 40 |
| MARTIN LUTHER KING DR | 36 |
| RIVER RD | 28 |
| ZORN RD | 28 |
| SLOUGH LOOP RD | 26 |
| 27 HWY | 24 |
| MILLER AVE | 24 |
| WEST ST | 24 |
| AIRPORT RD | 22 |
| BUTLER FERRY RD | 22 |
| FOWLSTOWN RD | 22 |
| JOHN SAM RD | 22 |
| LAKE DOUGLAS RD | 22 |
| CHURCH ST | 20 |
| HALL ST | 20 |
| LAMAR ST | 20 |
| OLD WHIGHAM RD | 20 |
| WASHINGTON ST | 20 |
| 84 BYPASS HWY | 18 |
| Other | 990 |
2002 - 2018 National Fire Incident Reporting System (NFIRS) incidents
- Incident types reported to NFIRS in Bainbridge, GA
- 2,03844.0%Fire
- 90419.5%Rescue & EMS
- 73915.9%Hazardous Condition
- 4349.4%Good Intent Call
- 2525.4%False Alarm
- 2084.5%Service Call
- 400.9%Special Incident
- 140.3%Overpressure Rupture
- 60.1%Severe Weather
- Fire incident types reported to NFIRS in Bainbridge, GA
- 83741.1%Structure Fires
- 82540.5%Outside Fires
- 33616.5%Mobile Property/Vehicle Fires
- 402.0%Other
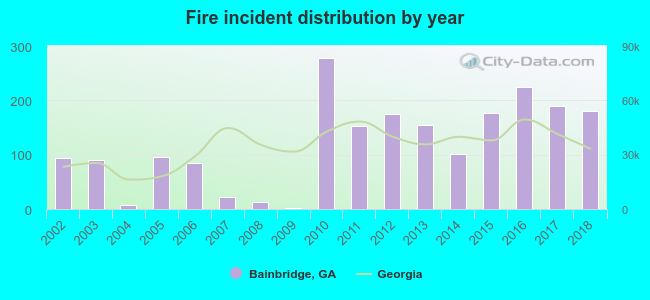 According to the data from the years 2002 - 2018 the average number of fire incidents per year is 120. The highest number of reported fire incidents - 277 took place in 2010, and the least - 1 in 2009. The data has a growing trend.
The average number of yearly fire incidents per 10k residents in Bainbridge, GA compared to nearest cities:
(Note: Based on data for the last 3 years, including only cities with population 5,000 and above)
| Bainbridge: | 158.7 |
| Cairo: | 213.1 |
| Camilla: | 135.1 |
| Thomasville: | 88.1 |
 The median response time based on all reported fire incidents is 4 minutes. This is lower than the Georgia median value.
The median response time in Bainbridge, GA compared to nearest cities:
(Note: Based on data for all years, including only cities with at least 500 fire incidents)
| Bainbridge: | 4 minutes |
| Donalsonville: | 6 minutes |
| Colquitt: | 8 minutes |
| Havana: | 5 minutes |
| Cairo: | 6 minutes |
| Quincy: | 6 minutes |
| Midway: | 11 minutes |
| Pelham: | 9 minutes |
| Camilla: | 6 minutes |
 Based on the reports from the years 2002 - 2018 the average number of fire-related fatalities per year is 0. The highest number of reported deaths - 3 took place in 2012, and the lowest - 0 in 2002. The data has a rising trend.
 Based on the data from the years 2002 - 2018 the average number of fire-related casualties per year is 1. The highest number of injuries - 5 took place in 2017, and the lowest - 0 in 2002. The data has a growing trend.
The average number of injuries per 1,000 fire incidents is 6. This indicator was the highest - 26 in 2017, and the lowest 0 in 2002. The trend for injuries per 1,000 incidents is increasing. Compared to the Georgia value the number of injuries per 1,000 fires is similar.
Based on the data from the years 2002 - 2018 the average number of fire-related casualties per year is 1. The highest number of injuries - 5 took place in 2017, and the lowest - 0 in 2002. The data has a growing trend.
The average number of injuries per 1,000 fire incidents is 6. This indicator was the highest - 26 in 2017, and the lowest 0 in 2002. The trend for injuries per 1,000 incidents is increasing. Compared to the Georgia value the number of injuries per 1,000 fires is similar.
 26.5% incidents where reported in the morning and 73.5% in the evening. The most fires (17.6%) took place on Saturday, and the least (12.9%) on Thursday.
 According to the 2,038 incident reports from years 2002 - 2018 most fires (12.4%) took place during March, and the least (5.6%) in August.
 Out of all 4,635 cases reported during the years 2002 - 2018, the most belonged to the categories: Fire (44.0%), Rescue & EMS (19.5%), and Hazardous Condition (15.9%).
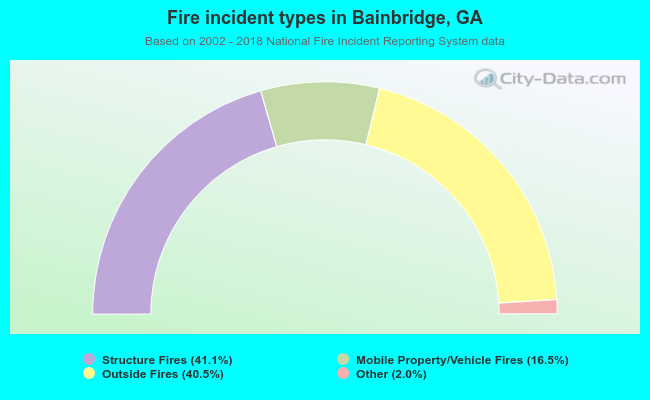 When looking into fire subcategories, the most incidents belonged to: Structure Fires (41.1%), and Outside Fires (40.5%).