Alexandria: Fire Incidents, Louisiana (LA)
Where are fire incidents reported in Alexandria, LA
Something went wrong! Please refresh the page.
| Fire incidents reported | |
|---|---|
| Sreet name | Count |
| MACARTHUR DR | 512 |
| JACKSON ST | 220 |
| BOLTON AVE | 196 |
| MASONIC DR | 190 |
| 3RD ST | 180 |
| TWIN BRIDGES RD | 134 |
| COLISEUM BLVD | 128 |
| LEE ST | 118 |
| I49 | 112 |
| ENGLAND DR | 110 |
| MONROE ST | 108 |
| I-49 | 96 |
| HORSESHOE DR | 92 |
| BAYOU RAPIDES RD | 90 |
| SYCAMORE ST | 90 |
| BROADWAY AVE | 82 |
| HIGHWAY 457 | 76 |
| LEVIN ST | 74 |
| HOUSTON ST | 66 |
| LAKESIDE DR | 66 |
| TEXAS AVE | 62 |
| CULPEPPER RD | 60 |
| ENTERPRISE RD | 60 |
| WISE ST | 58 |
| ELLIOTT ST | 56 |
| HIGHWAY 1 SOUTH | 56 |
| LISA ST | 56 |
| NORTH BLVD | 56 |
| OLD BOYCE RD | 56 |
| HWY 28 | 54 |
| Other | 2,371 |
2003 - 2018 National Fire Incident Reporting System (NFIRS) incidents
- Incident types reported to NFIRS in Alexandria, LA
- 26,24762.5%Rescue & EMS
- 5,68513.5%Fire
- 2,9397.0%Service Call
- 2,7936.6%Good Intent Call
- 2,2175.3%Hazardous Condition
- 2,0514.9%False Alarm
- Fire incident types reported to NFIRS in Alexandria, LA
- 2,27139.9%Structure Fires
- 1,99435.1%Outside Fires
- 1,17920.7%Mobile Property/Vehicle Fires
- 2414.2%Other
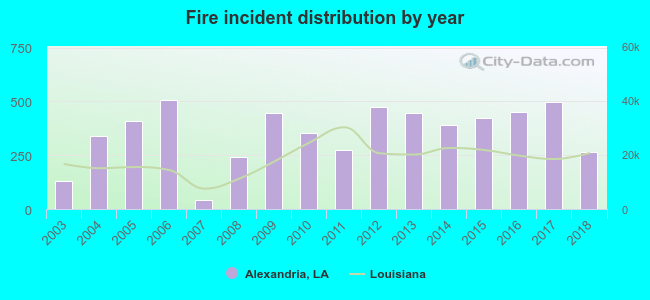 According to the data from the years 2003 - 2018 the average number of fire incidents per year is 355. The highest number of fires - 505 took place in 2006, and the least - 43 in 2007. The data has a rising trend.
The average number of yearly fire incidents per 10k residents in Alexandria, LA compared to nearest cities:
(Note: Based on data for the last 3 years, including only cities with population 5,000 and above)
| Alexandria: | 83.9 |
| Pineville: | 155.1 |
| Marksville: | 79.2 |
| Oakdale: | 115.7 |
| Ville Platte: | 100.2 |
| Leesville: | 200.7 |
| Natchitoches: | 76.7 |
| Eunice: | 91.6 |
 The median response time based on all reported fire incidents is 5 minutes. This is lower compared to the Louisiana median value.
The median response time in Alexandria, LA compared to nearest cities:
(Note: Based on data for all years, including only cities with at least 500 fire incidents)
| Alexandria: | 5 minutes |
| Pineville: | 6 minutes |
| Boyce: | 10 minutes |
| Pollock: | 12 minutes |
| Deville: | 10 minutes |
| Glenmora: | 9 minutes |
| Jena: | 5 minutes |
| Oakdale: | 5 minutes |
| Ville Platte: | 5 minutes |
 According to the data from the years 2003 - 2018 the average number of fire-related fatalities per year is 0. The highest number of reported deaths - 2 took place in 2004, and the lowest - 0 in 2003. The data has a constant trend.
The average number of deaths per 1,000 fire incidents is 1. This indicator was the highest - 6 in 2004, and the lowest 0 in 2003. The trend for deaths per 1,000 incidents is constant. Compared to the Louisiana value the number of deaths per 1,000 incidents is much lower.
According to the data from the years 2003 - 2018 the average number of fire-related fatalities per year is 0. The highest number of reported deaths - 2 took place in 2004, and the lowest - 0 in 2003. The data has a constant trend.
The average number of deaths per 1,000 fire incidents is 1. This indicator was the highest - 6 in 2004, and the lowest 0 in 2003. The trend for deaths per 1,000 incidents is constant. Compared to the Louisiana value the number of deaths per 1,000 incidents is much lower.Deaths per 1,000 incidents in Alexandria, LA compared to nearest cities:
(Note: Based on data for all years, including only cities with at least 2,500 fire incidents)
| Alexandria: | 1.1 |
| Pineville: | 1.2 |
 Based on the reports from the years 2003 - 2018 the average number of fire-related yearly casualties is 1. The highest number of casualties - 4 took place in 2003, and the lowest - 0 in 2007. The data has a declining trend.
The average number of casualties per 1,000 fire incidents is 4. This indicator was the highest - 31 in 2003, and the lowest 0 in 2007. The trend for injuries per 1,000 fires is declining. Compared to the state value the number of injuries per 1,000 fires is lower.
Based on the reports from the years 2003 - 2018 the average number of fire-related yearly casualties is 1. The highest number of casualties - 4 took place in 2003, and the lowest - 0 in 2007. The data has a declining trend.
The average number of casualties per 1,000 fire incidents is 4. This indicator was the highest - 31 in 2003, and the lowest 0 in 2007. The trend for injuries per 1,000 fires is declining. Compared to the state value the number of injuries per 1,000 fires is lower.
 31.2% incidents where reported in the morning and 68.8% in the evening. The most fires (14.8%) took place on Friday, and the least (13.9%) on Sunday.
 According to the 5,685 reports from years 2003 - 2018 most fires (10.2%) took place during March, and the least (6.4%) in August.
 Out of all 42,011 cases reported during the years 2003 - 2018, the most belonged to the categories: Rescue & EMS (62.5%), Fire (13.5%), and Service Call (7.0%).
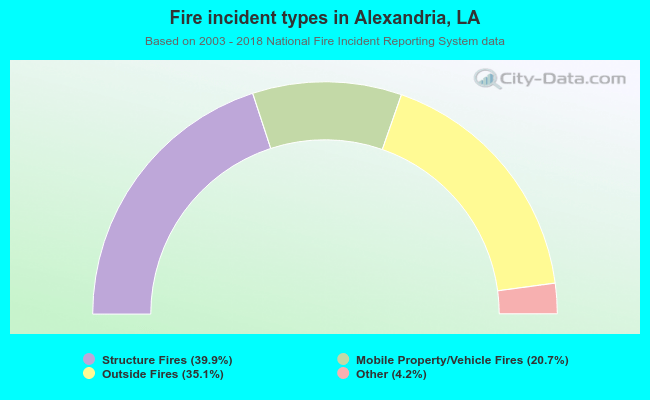 When looking into fire subcategories, the most reports belonged to: Structure Fires (39.9%), and Outside Fires (35.1%).