Alexandria: Fire Incidents, Kentucky (KY)
Where are fire incidents reported in Alexandria, KY
Something went wrong! Please refresh the page.
|
| |||||||||||||||||||||||||||||||||||||||||||||||||||||||||||||||||||||||||||||||||||||||||||||||||||||||||||||
2002 - 2018 National Fire Incident Reporting System (NFIRS) incidents
- Incident types reported to NFIRS in Alexandria, KY
- 2,12648.1%Rescue & EMS
- 70916.0%Fire
- 67915.3%Hazardous Condition
- 4209.5%Good Intent Call
- 2465.6%False Alarm
- 1904.3%Service Call
- 481.1%Severe Weather
- Fire incident types reported to NFIRS in Alexandria, KY
- 28940.8%Outside Fires
- 24734.8%Structure Fires
- 14320.2%Mobile Property/Vehicle Fires
- 304.2%Other
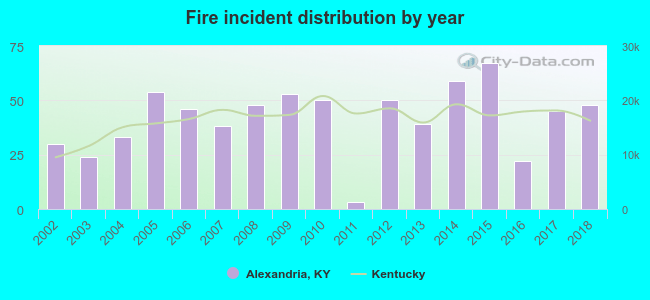 Based on the data from the years 2002 - 2018 the average number of fires per year is 42. The highest number of reported fires - 67 took place in 2015, and the least - 3 in 2011. The data has a rising trend.
The average number of yearly fire incidents per 10k residents in Alexandria, KY compared to nearest cities:
(Note: Based on data for the last 3 years, including only cities with population 5,000 and above)
| Alexandria: | 43.6 |
| Cold Spring: | 24.3 |
| Highland Heights: | 13.4 |
| Taylor Mill: | 24.8 |
| Independence: | 26.2 |
| Fort Thomas: | 0.6 |
| Covington: | 49.4 |
| Edgewood: | 17.9 |
| Fort Wright: | 20.3 |
 The median response time based on all reported fire incidents is 7 minutes. This is about the same as the Kentucky median value.
The median response time in Alexandria, KY compared to nearest cities:
(Note: Based on data for all years, including only cities with at least 500 fire incidents)
| Alexandria: | 7 minutes |
| Independence: | 5 minutes |
| Covington: | 4 minutes |
| Fort Wright: | 6 minutes |
| Newport: | 4 minutes |
| Erlanger: | 5 minutes |
| Florence: | 6 minutes |
 Based on the data from the years 2002 - 2018 the average number of fire-related casualties per year is 1. The highest number of casualties - 3 took place in 2006, and the lowest - 0 in 2002. The data has a constant trend.
The average number of injuries per 1,000 fire incidents is 12. This indicator was the highest - 65 in 2006, and the lowest 0 in 2002. The trend for casualties per 1,000 fire incidents is constant. Compared to the state value the number of injuries per 1,000 incidents is much higher.
Based on the data from the years 2002 - 2018 the average number of fire-related casualties per year is 1. The highest number of casualties - 3 took place in 2006, and the lowest - 0 in 2002. The data has a constant trend.
The average number of injuries per 1,000 fire incidents is 12. This indicator was the highest - 65 in 2006, and the lowest 0 in 2002. The trend for casualties per 1,000 fire incidents is constant. Compared to the state value the number of injuries per 1,000 incidents is much higher.Casualties per 1,000 incidents in Alexandria, KY compared to nearest cities:
(Note: Based on data for all years, including only cities with at least 500 fire incidents)
| Alexandria: | 14.1 |
| Independence: | 8.4 |
| Covington: | 14.0 |
| Fort Wright: | 3.9 |
| Newport: | 20.2 |
| Erlanger: | 5.0 |
| Florence: | 14.5 |
 29.5% incidents where reported in the morning and 70.5% in the evening. The most fires (16.8%) took place on Tuesday, and the least (12.1%) on Sunday.
 According to the 709 fire incident reports from years 2002 - 2018 most fires (13.7%) took place during April, and the least (4.9%) in December.
 Out of all 4,424 cases reported during the years 2002 - 2018, the most belonged to the categories: Rescue & EMS (48.1%), Fire (16.0%), and Hazardous Condition (15.3%).
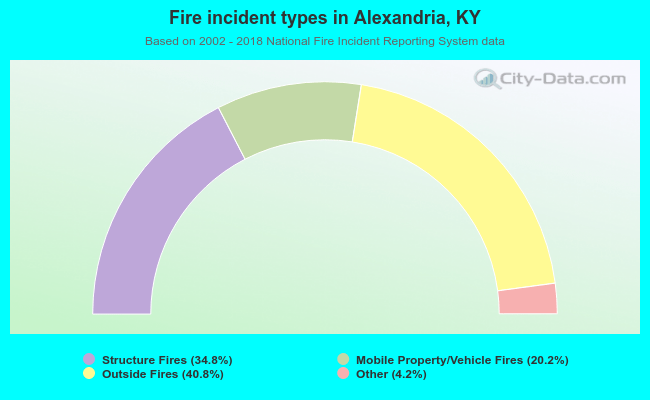 When looking into fire subcategories, the most incidents belonged to: Outside Fires (40.8%), and Structure Fires (34.8%).