Acton: Fire Incidents, Massachusetts (MA)
Where are fire incidents reported in Acton, MA
Something went wrong! Please refresh the page.
| Fire incidents reported | |
|---|---|
| Sreet name | Count |
| GREAT RD | 150 |
| MAIN ST | 92 |
| CENTRAL ST | 62 |
| STRAWBERRY HILL RD | 48 |
| DAVIS RD | 46 |
| MASSACHUSETTS AV | 44 |
| CHARTER RD | 32 |
| KNOX TR | 32 |
| HOSMER ST | 30 |
| ROUTE 2 | 28 |
| PARKER ST | 26 |
| ARLINGTON ST | 24 |
| SCHOOL ST | 22 |
| SPRUCE ST | 22 |
| DRUMMER RD | 20 |
| HAYWARD RD | 20 |
| NEWTOWN RD | 20 |
| HIGH ST | 18 |
| CONCORD RD | 16 |
| IRIS CT | 16 |
| NAGOG PARK DR | 16 |
| CENTRAL ST | 14 |
| TOWN OF ACTON | 14 |
| BROOK ST | 12 |
| FOREST RD | 12 |
| REVOLUTIONARY RD | 12 |
| SQUIRREL HILL RD | 12 |
| TAYLOR RD | 12 |
| WAMPUS AV | 12 |
| WILLOW ST | 12 |
2003 - 2018 National Fire Incident Reporting System (NFIRS) incidents
- Incident types reported to NFIRS in Acton, MA
- 8,10636.8%Special Incident
- 6,74430.6%Rescue & EMS
- 2,39010.8%Hazardous Condition
- 2,20810.0%Service Call
- 1,3696.2%False Alarm
- 7523.4%Fire
- 4692.1%Good Intent Call
- Fire incident types reported to NFIRS in Acton, MA
- 41555.2%Structure Fires
- 25533.9%Outside Fires
- 456.0%Mobile Property/Vehicle Fires
- 374.9%Other
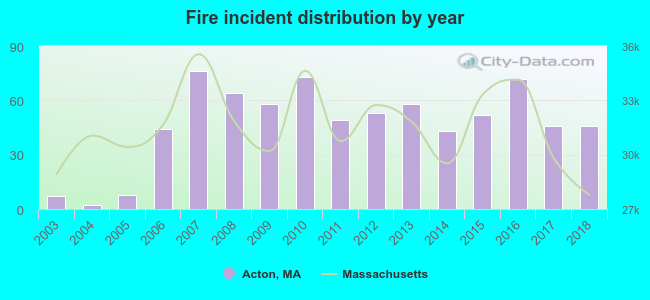 According to the data from the years 2003 - 2018 the average number of fires per year is 47. The highest number of reported fires - 76 took place in 2007, and the least - 2 in 2004. The data has a rising trend.
The average number of yearly fire incidents per 10k residents in Acton, MA compared to nearest cities:
(Note: Based on data for the last 3 years, including only cities with population 5,000 and above)
| Acton: | 24.9 |
| Maynard: | 25.7 |
| Concord: | 30.8 |
| Littleton: | 35.5 |
| Stow: | 22.8 |
| Sudbury: | 15.3 |
| Lincoln: | 111.1 |
| Westford: | 26.0 |
| Harvard: | 36.3 |
 The median response time based on all reported fire incidents is 4 minutes. This is about the same as the state median value.
The median response time in Acton, MA compared to nearest cities:
(Note: Based on data for all years, including only cities with at least 500 fire incidents)
| Acton: | 4 minutes |
| Concord: | 6 minutes |
| Littleton: | 6 minutes |
| Sudbury: | 4 minutes |
| Lincoln: | 5 minutes |
| Westford: | 6 minutes |
| Harvard: | 9 minutes |
| Hudson: | 3 minutes |
| Bedford: | 4 minutes |
 26.1% incidents where reported in the morning and 73.9% in the evening. The most fires (17.7%) took place on Saturday, and the least (12.1%) on Sunday.
 Based on the 752 fires from years 2003 - 2018 most fires (11.0%) took place during May, and the least (6.8%) in September.
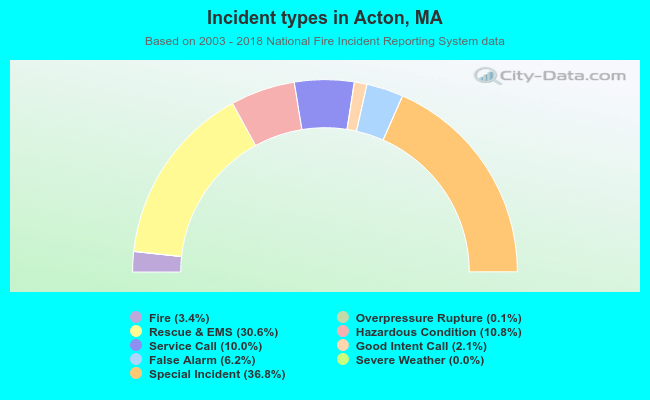 Out of all 22,053 cases reported during the years 2003 - 2018, the most belonged to the categories: Special Incident (36.8%), Rescue & EMS (30.6%), and Hazardous Condition (10.8%).
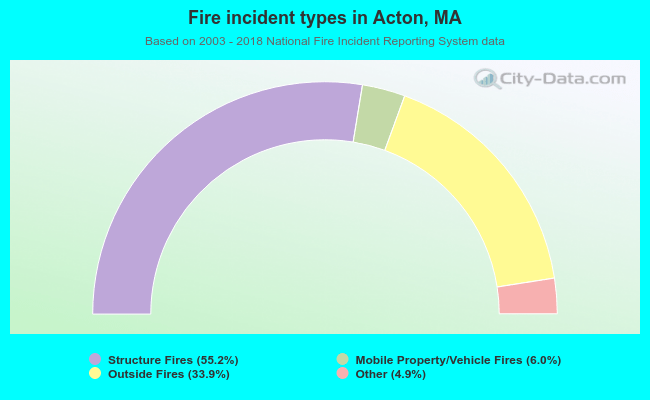 When looking into fire subcategories, the most incidents belonged to: Structure Fires (55.2%), and Outside Fires (33.9%).