Crime rate in Irvine, California (CA): murders, rapes, robberies, assaults, burglaries, thefts, auto thefts, arson, law enforcement employees, police officers, crime map
Crime rate in Irvine, CA
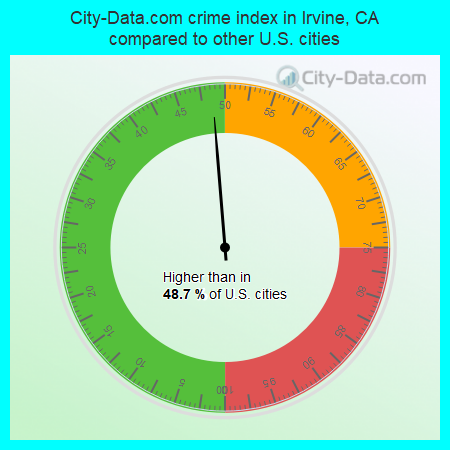
The 2022 crime rate in Irvine, CA is 96 (City-Data.com crime index), which is 2.6 times smaller than the U.S. average. It was higher than in 48.7% U.S. cities. The 2022 Irvine crime rate rose by 12670% compared to 2021. In the last 5 years Irvine has seen rise of violent crime and rise of property crime.See how dangerous Irvine, CA is compared to the nearest cities:
(Note: Higher means more crime)
(Note: Higher means more crime)
| Irvine: | 96.3 |
| Tustin: | 208.4 |
| Laguna Woods: | 43.1 |
| Santa Ana: | 115.0 |
| Lake Forest: | 88.5 |
| Costa Mesa: | 339.2 |
| Newport Beach: | 161.2 |
| Laguna Hills: | 121.6 |
| Aliso Viejo: | 55.9 |
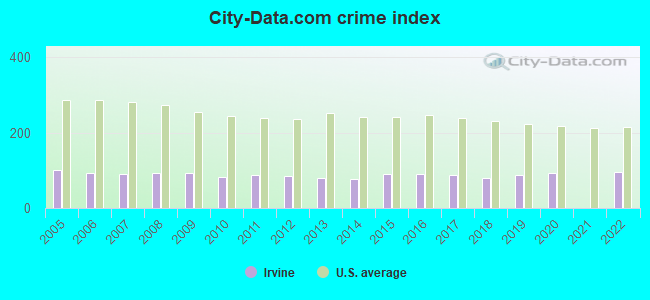
The City-Data.com crime index weighs serious crimes and violent crimes more heavily. Higher means more crime, U.S. average is 246.1. It adjusts for the number of visitors and daily workers commuting into cities.
- means the value is smaller than the state average.- means the value is about the same as the state average.
According to our research of California and other state lists, there were 49 registered sex offenders living in Irvine, California as of June 01, 2024.
The ratio of all residents to sex offenders in Irvine is 5,431 to 1.
The ratio of registered sex offenders to all residents in this city is much lower than the state average.
Violent crime rate in 2022
| Irvine: | 45.1 |
| U.S. Average: | 219.8 |
Violent crime rate in 2021
| Irvine: | 0.7 |
| U.S. Average: | 224.8 |
Violent crime rate in 2020
| Irvine: | 32.1 |
| U.S. Average: | 228.2 |
Violent crime rate in 2019
| Irvine: | 41.5 |
| U.S. Average: | 219.9 |
Violent crime rate in 2018
| Irvine: | 34.7 |
| U.S. Average: | 221.2 |
Violent crime rate in 2017
| Irvine: | 40.0 |
| U.S. Average: | 226.2 |
Violent crime rate in 2016
| Irvine: | 37.9 |
| U.S. Average: | 227.3 |
Violent crime rate in 2015
| Irvine: | 34.3 |
| U.S. Average: | 219.3 |
Violent crime rate in 2014
| Irvine: | 30.5 |
| U.S. Average: | 211.1 |
Violent crime rate in 2013
| Irvine: | 27.8 |
| U.S. Average: | 214.2 |
Violent crime rate in 2012
| Irvine: | 28.5 |
| U.S. Average: | 187.4 |
Violent crime rate in 2011
| Irvine: | 31.9 |
| U.S. Average: | 187.1 |
Violent crime rate in 2010
| Irvine: | 33.9 |
| U.S. Average: | 195.7 |
Violent crime rate in 2009
| Irvine: | 44.0 |
| U.S. Average: | 208.9 |
Violent crime rate in 2008
| Irvine: | 35.8 |
| U.S. Average: | 222.5 |
Violent crime rate in 2007
| Irvine: | 37.6 |
| U.S. Average: | 229.1 |
Violent crime rate in 2006
| Irvine: | 35.9 |
| U.S. Average: | 232.6 |
Violent crime rate in 2005
| Irvine: | 42.3 |
| U.S. Average: | 227.0 |
Property crime rate in 2022
| Irvine: | 123.4 |
| U.S. Average: | 166.5 |
Property crime rate in 2021
| Irvine: | 0.5 |
| U.S. Average: | 157.8 |
Property crime rate in 2020
| Irvine: | 126.4 |
| U.S. Average: | 169.6 |
Property crime rate in 2019
| Irvine: | 100.3 |
| U.S. Average: | 179.7 |
Property crime rate in 2018
| Irvine: | 102.7 |
| U.S. Average: | 190.2 |
Property crime rate in 2017
| Irvine: | 106.9 |
| U.S. Average: | 206.4 |
Property crime rate in 2016
| Irvine: | 112.8 |
| U.S. Average: | 216.6 |
Property crime rate in 2015
| Irvine: | 113.1 |
| U.S. Average: | 221.5 |
Property crime rate in 2014
| Irvine: | 103.3 |
| U.S. Average: | 230.8 |
Property crime rate in 2013
| Irvine: | 113.0 |
| U.S. Average: | 250.4 |
Property crime rate in 2012
| Irvine: | 121.5 |
| U.S. Average: | 267.3 |
Property crime rate in 2011
| Irvine: | 117.6 |
| U.S. Average: | 273.5 |
Property crime rate in 2010
| Irvine: | 105.5 |
| U.S. Average: | 276.4 |
Property crime rate in 2009
| Irvine: | 109.9 |
| U.S. Average: | 285.6 |
Property crime rate in 2008
| Irvine: | 118.8 |
| U.S. Average: | 302.2 |
Property crime rate in 2007
| Irvine: | 121.0 |
| U.S. Average: | 309.2 |
Property crime rate in 2006
| Irvine: | 125.9 |
| U.S. Average: | 317.3 |
Property crime rate in 2005
| Irvine: | 144.9 |
| U.S. Average: | 322.3 |


Full-time law enforcement employees in 2021, including police officers: 309 (210 officers - 177 male; 33 female).
| Officers per 1,000 residents here: | 0.72 |
| California average: | 2.30 |
Full-time law enforcement employees in 2020, including police officers: 319 (218 officers - 179 male; 39 female).
| Officers per 1,000 residents here: | 0.73 |
| California average: | 2.36 |
Full-time law enforcement employees in 2019, including police officers: 325 (224 officers - 183 male; 41 female).
| Officers per 1,000 residents here: | 0.77 |
| California average: | 2.35 |
Full-time law enforcement employees in 2018, including police officers: 310 (216 officers - 179 male; 37 female).
| Officers per 1,000 residents here: | 0.75 |
| California average: | 2.34 |
Full-time law enforcement employees in 2017, including police officers: 302 (211 officers - 176 male; 35 female).
| Officers per 1,000 residents here: | 0.76 |
| California average: | 2.32 |
Full-time law enforcement employees in 2016, including police officers: 301 (213 officers - 175 male; 38 female).
| Officers per 1,000 residents here: | 0.80 |
| California average: | 2.32 |
Full-time law enforcement employees in 2015, including police officers: 298 (203 officers - 165 male; 38 female).
| Officers per 1,000 residents here: | 0.79 |
| California average: | 1.98 |
Full-time law enforcement employees in 2014, including police officers: 289 (200 officers - 162 male; 38 female).
| Officers per 1,000 residents here: | 0.82 |
| California average: | 2.00 |
Full-time law enforcement employees in 2013, including police officers: 281 (194 officers - 155 male; 39 female).
| Officers per 1,000 residents here: | 0.82 |
| California average: | 2.34 |
Full-time law enforcement employees in 2012, including police officers: 280 (200 officers - 160 male; 40 female).
| Officers per 1,000 residents here: | 0.92 |
| California average: | 2.36 |
Full-time law enforcement employees in 2011, including police officers: 278 (198 officers - 156 male; 42 female).
| Officers per 1,000 residents here: | 0.92 |
| California average: | 2.09 |
Full-time law enforcement employees in 2010, including police officers: 289 (200 officers - 158 male; 42 female).
| Officers per 1,000 residents here: | 0.94 |
| California average: | 2.46 |
Full-time law enforcement employees in 2009, including police officers: 282 (195 officers - 156 male; 39 female).
| Officers per 1,000 residents here: | 0.90 |
| California average: | 2.52 |
Full-time law enforcement employees in 2008, including police officers: 271 (182 officers - 146 male; 36 female).
| Officers per 1,000 residents here: | 0.87 |
| California average: | 2.55 |
Full-time law enforcement employees in 2007, including police officers: 265 (173 officers - 143 male; 30 female).
| Officers per 1,000 residents here: | 0.86 |
| California average: | 2.48 |
Full-time law enforcement employees in 2006, including police officers: 252 (163 officers - 135 male; 28 female).
| Officers per 1,000 residents here: | 0.86 |
| California average: | 2.38 |
Full-time law enforcement employees in 2005, including police officers: 224 (157 officers - 131 male; 26 female).
| Officers per 1,000 residents here: | 0.87 |
| California average: | 2.34 |
Full-time law enforcement employees in 2004, including police officers: 231 (158 officers - 133 male; 25 female).
| Officers per 1,000 residents here: | 0.92 |
| California average: | 2.36 |
Full-time law enforcement employees in 2003, including police officers: 218 (152 officers - 127 male; 25 female).
| Officers per 1,000 residents here: | 0.93 |
| California average: | 2.42 |


Zip codes: 92602, 92603, 92604, 92606, 92610, 92612, 92617, 92618, 92620, 92630, 92676, 92780, 92782.