Owen County, Indiana (IN)
County owner-occupied free and clear houses and condos in 2010: 2,285
County owner-occupied houses and condos in 2000: 6,756
Renter-occupied apartments: 1,705 (it was 1,526 in 2000)
| % of renters here: | 18% |
| State: | 30% |
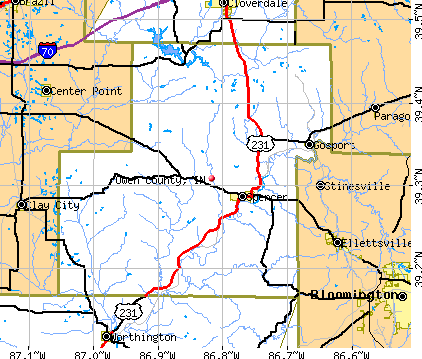
Land area: 385 sq. mi.
Water area: 2.7 sq. mi.
Population density: 56 people per square mile (average).
Industries providing employment: Manufacturing (22.4%), Educational, health and social services (17.8%), Construction (12.7%).
Type of workers:
- Private wage or salary: 80%
- Government: 12%
- Self-employed, not incorporated: 8%
- Unpaid family work: 0%
- OSM Map
- General Map
- Google Map
- MSN Map

- 20,23994.9%White Non-Hispanic Alone
- 5312.5%Two or more races
- 3001.4%Hispanic or Latino
- 1130.5%Asian alone
- 1040.5%Black Non-Hispanic Alone
- 260.1%Some other race alone
- 100.05%American Indian and Alaska Native alone

| Median resident age: | 45.1 years |
| Indiana median age: | 38.2 years |
| Males: 10,981 | |
| Females: 10,533 |

 | Bloomington Indiana (30 replies) |
| Bloomington, Indiana - retirement/public transit/condo or house? (10 replies) |
| Best state parks in IN (17 replies) |
| jackson county vs. washington county (15 replies) |
| Where in Indiana to relocate to? (7 replies) |
| Where does Southern Indiana REALLY begin? (73 replies) |
| Owen County: | 2.0 people |
| Indiana: | 3 people |
Estimated median household income in 2022: $57,612 ($36,529 in 1999)
| This county: | $57,612 |
| Indiana: | $66,785 |
Median contract rent in 2022 for apartments: $588 (lower quartile is $457, upper quartile is $730)
| This county: | $588 |
| State: | $780 |
Estimated median house or condo value in 2022: $172,098 (it was $82,300 in 2000)
| Owen: | $172,098 |
| Indiana: | $208,700 |
Mean price in 2022:
Median monthly housing costs for homes and condos with a mortgage: $1,140Detached houses: $183,124
Here: $183,124 State: $257,916 Townhouses or other attached units: $136,054
Here: $136,054 State: $224,114 Mobile homes: $49,972
Here: $49,972 State: $67,116
Median monthly housing costs for units without a mortgage: $446
Institutionalized population: 181
Crime in 2006 (reported by the sheriff's office or county police, not the county total):
- Murders: 0
- Rapes: 1
- Robberies: 3
- Assaults: 56
- Burglaries: 248
- Thefts: 396
- Auto thefts: 15
Single-family new house construction building permits:
- 2022: 96 buildings, average cost: $306,700
- 2021: 29 buildings, average cost: $267,600
- 2020: 31 buildings, average cost: $265,400
- 2019: 30 buildings, average cost: $267,500
- 2018: 48 buildings, average cost: $258,600
- 2017: 47 buildings, average cost: $223,900
- 2016: 36 buildings, average cost: $173,000
- 2015: 23 buildings, average cost: $127,000
- 2014: 18 buildings, average cost: $169,500
- 2013: 0 buildings
- 2012: 0 buildings
- 2011: 0 buildings
- 2010: 2 buildings, average cost: $146,700
- 2009: 41 buildings, average cost: $156,000
- 2008: 50 buildings, average cost: $159,500
- 2007: 133 buildings, average cost: $101,800
- 2006: 105 buildings, average cost: $161,500
- 2005: 160 buildings, average cost: $191,000
- 2004: 3 buildings, average cost: $73,300
- 2003: 3 buildings, average cost: $73,300
- 2002: 1 building, cost: $114,000
- 2001: 2 buildings, average cost: $45,000
- 2000: 1 building, cost: $108,200
- 1999: 8 buildings, average cost: $71,300
- 1998: 13 buildings, average cost: $96,000
- 1997: 0 buildings


Median real estate property taxes paid for housing units with mortgages in 2022: $1,137 (0.6%)
Median real estate property taxes paid for housing units with no mortgage in 2022: $993 (0.7%)


| Owen County: | 12.6% |
| Indiana: | 12.6% |
Median age of residents in 2022: 45.1 years old
(Males: 43.1 years old, Females: 47.1 years old)
(Median age for: White residents: 45.7 years old, Black residents: 31.4 years old, Asian residents: 15.3 years old, Hispanic or Latino residents: 38.5 years old, Other race residents: 32.4 years old)
Fair market rent in 2006 for a 1-bedroom apartment in Owen County is $433 a month.
Fair market rent for a 2-bedroom apartment is $519 a month.
Fair market rent for a 3-bedroom apartment is $657 a month.
Neighboring counties: Cecil County, Maryland  , Decatur County , Greene County
  , Randolph County, West Virginia , Taylor County, West Virginia , Sutter County, California
  , Washington County, Ohio .
| Here: | 3.2% |
| Indiana: | 2.8% |


Current college students: 495
People 25 years of age or older with a high school degree or higher: 86.4%
People 25 years of age or older with a bachelor's degree or higher: 15.3%
Number of foreign born residents: 131 (61.7% naturalized citizens)
| Owen County: | 0.6% |
| Whole state: | 6.1% |

- Year of entry for the foreign-born population
- 742010 or later
- 412000 to 2009
- 101990 to 1999
- 31980 to 1989
- 101970 to 1979
- 58Before 1970
Mean travel time to work (commute): # minutes
Percentage of county residents living and working in this county: 98.7%
Housing units in structures:
- One, detached: 7,595
- One, attached: 169
- Two: 127
- 3 or 4: 85
- 5 to 9: 112
- 10 to 19: 37
- 20 or more: 61
- Mobile homes: 1,684
- Boats, RVs, vans, etc.: 36
Housing units in Owen County with a mortgage: 3,890 (223 second mortgage, 0 home equity loan, 180 both second mortgage and home equity loan)
Houses without a mortgage: 79
| Here: | 3.7% with mortgage |
| State: | 96.6% with mortgage |
Religion statistics for Owen County
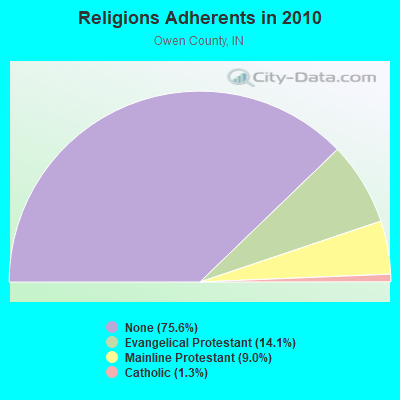
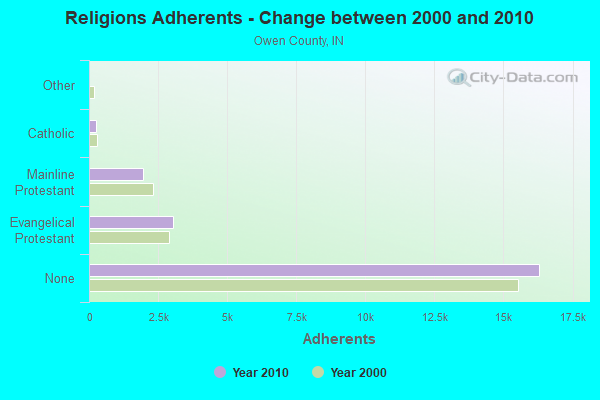
| Religion | Adherents | Congregations |
|---|---|---|
| Evangelical Protestant | 3,051 | 32 |
| Mainline Protestant | 1,950 | 16 |
| Catholic | 270 | 1 |
| Other | 2 | 1 |
| None | 16,302 | - |
Source: Clifford Grammich, Kirk Hadaway, Richard Houseal, Dale E.Jones, Alexei Krindatch, Richie Stanley and Richard H.Taylor. 2012. 2010 U.S.Religion Census: Religious Congregations & Membership Study. Association of Statisticians of American Religious Bodies. Jones, Dale E., et al. 2002. Congregations and Membership in the United States 2000. Nashville, TN: Glenmary Research Center.
Food Environment Statistics:
| Owen County: | 0.89 / 10,000 pop. |
| State: | 1.73 / 10,000 pop. |
| This county: | 1.34 / 10,000 pop. |
| Indiana: | 0.50 / 10,000 pop. |
| Owen County: | 2.24 / 10,000 pop. |
| Indiana: | 3.57 / 10,000 pop. |
| This county: | 4.03 / 10,000 pop. |
| State: | 6.78 / 10,000 pop. |
| Owen County: | 9.4% |
| Indiana: | 9.2% |
| Owen County: | 29.6% |
| State: | 29.0% |
| Here: | 13.6% |
| State: | 14.3% |
Agriculture in Owen County:
Average size of farms: 168 acresAverage value of agricultural products sold per farm: $22,132
Average value of crops sold per acre for harvested cropland: $190.36
The value of nursery, greenhouse, floriculture, and sod as a percentage of the total market value of agricultural products sold: 1.46%
The value of livestock, poultry, and their products as a percentage of the total market value of agricultural products sold: 27.34%
Average total farm production expenses per farm: $27,189
Harvested cropland as a percentage of land in farms: 50.34%
Average market value of all machinery and equipment per farm: $42,408
The percentage of farms operated by a family or individual: 94.56%
Average age of principal farm operators: 56 years
Average number of cattle and calves per 100 acres of all land in farms: 7.71
Milk cows as a percentage of all cattle and calves: 3.37%
Corn for grain: 13625 harvested acres
All wheat for grain: 1680 harvested acres
Soybeans for beans: 22859 harvested acres
Vegetables: 32 harvested acres
Land in orchards: 100 acres
Earthquake activity:
Owen County-area historical earthquake activity is significantly above Indiana state average. It is 120% greater than the overall U.S. average.On 4/18/2008 at 09:36:59, a magnitude 5.4 (5.1 MB, 4.8 MS, 5.4 MW, 5.2 MW, Class: Moderate, Intensity: VI - VII) earthquake occurred 82.5 miles away from Owen County center
On 4/18/2008 at 09:36:59, a magnitude 5.2 (5.2 MW, Depth: 8.9 mi) earthquake occurred 82.6 miles away from the county center
On 6/10/1987 at 23:48:54, a magnitude 5.1 (4.9 MB, 4.4 MS, 4.6 MS, 5.1 LG) earthquake occurred 66.5 miles away from the county center
On 6/18/2002 at 17:37:15, a magnitude 5.0 (4.3 MB, 4.6 MW, 5.0 LG) earthquake occurred 105.1 miles away from the county center
On 4/18/2008 at 15:14:16, a magnitude 4.8 (4.5 MB, 4.8 MW, 4.6 MW, Class: Light, Intensity: IV - V) earthquake occurred 79.9 miles away from Owen County center
On 7/27/1980 at 18:52:21, a magnitude 5.2 (5.1 MB, 4.7 MS, 5.0 UK, 5.2 UK) earthquake occurred 172.8 miles away from the county center
Magnitude types: regional Lg-wave magnitude (LG), body-wave magnitude (MB), surface-wave magnitude (MS), moment magnitude (MW)
Most recent natural disasters:
- Indiana Covid-19 Pandemic, Incident Period: January 31, 2020, FEMA Id: 4515, Natural disaster type: Other
- Indiana Severe Winter Storm and Snowstorm, Incident Period: January 05, 2014 to January 09, 2014, Major Disaster (Presidential) Declared DR-4173: April 22, 2014, FEMA Id: 4173, Natural disaster type: Snowstorm, Winter Storm
- Indiana Severe Storms and Flooding, Incident Period: May 30, 2008 to June 27, 2008, Major Disaster (Presidential) Declared DR-1766: June 08, 2008, FEMA Id: 1766, Natural disaster type: Storm, Flood
- Indiana Hurricane Katrina Evacuation, Incident Period: August 29, 2005 to October 01, 2005, Emergency Declared EM-3238: September 10, 2005, FEMA Id: 3238, Natural disaster type: Hurricane
- Indiana Severe Winter Storms and Flooding, Incident Period: January 01, 2005 to February 11, 2005, Major Disaster (Presidential) Declared DR-1573: January 21, 2005, FEMA Id: 1573, Natural disaster type: Winter Storm, Flood
- Indiana Snow, Incident Period: December 21, 2004 to December 23, 2004, Emergency Declared EM-3197: January 11, 2005, FEMA Id: 3197, Natural disaster type: Snow
- Indiana Tornadoes, and Flooding, Incident Period: July 03, 2004 to July 18, 2004, Major Disaster (Presidential) Declared DR-1542: September 01, 2004, FEMA Id: 1542, Natural disaster type: Tornado, Flood
- Indiana Severe Storms, Tornadoes, and Flooding, Incident Period: May 25, 2004 to June 25, 2004, Major Disaster (Presidential) Declared DR-1520: June 03, 2004, FEMA Id: 1520, Natural disaster type: Storm, Tornado, Flood
- Indiana Severe Storms, Tornadoes, and Flooding, Incident Period: August 26, 2003 to September 15, 2003, Major Disaster (Presidential) Declared DR-1487: September 05, 2003, FEMA Id: 1487, Natural disaster type: Storm, Tornado, Flood
- Indiana Severe Storms, Tornadoes, and Flooding, Incident Period: July 04, 2003 to August 06, 2003, Major Disaster (Presidential) Declared DR-1476: July 11, 2003, FEMA Id: 1476, Natural disaster type: Storm, Tornado, Flood
- 5 other natural disasters have been reported since 1953.
The number of natural disasters in Owen County (15) is near the US average (15).
Major Disasters (Presidential) Declared: 12
Emergencies Declared: 2
Causes of natural disasters: Floods: 9, Storms: 8, Tornadoes: 7, Winter Storms: 2, Blizzard: 1, Hurricane: 1, Snow: 1, Snowstorm: 1, Other: 1 (Note: some incidents may be assigned to more than one category).

Means of transportation to work:
- Drove a car alone: 4,799 (74.9%)
- Carpooled: 660 (10.3%)
- Bus: 29 (0.5%)
- Taxicab, motorcycle, or other means: 50 (0.8%)
- Walked: 117 (1.8%)
- Worked at home: 771 (12.0%)


- Manufacturing (20%)
- Health care and social assistance (17%)
- Educational services (8%)
- Retail trade (6%)
- Accommodation and food services (6%)
- Other services, except public administration (4%)
- Finance and insurance (3%)

- Manufacturing (24%)
- Health care and social assistance (20%)
- Educational services (9%)
- Retail trade (7%)
- Accommodation and food services (7%)
- Other services, except public administration (5%)
- Finance and insurance (4%)

- Construction and extraction occupations (15%)
- Production occupations (14%)
- Installation, maintenance, and repair occupations (12%)
- Transportation occupations (10%)
- Management occupations (8%)
- Material moving occupations (7%)
- Sales and related occupations (6%)

- Office and administrative support occupations (15%)
- Production occupations (13%)
- Management occupations (10%)
- Educational instruction, and library occupations (8%)
- Food preparation and serving related occupations (7%)
- Healthcare support occupations (6%)
- Sales and related occupations (6%)

- China, excluding Hong Kong and Taiwan (37%)
- Mexico (10%)
- United Kingdom, excluding England and Scotland (7%)
- Korea (6%)
- Thailand (6%)
- Philippines (6%)
- Israel (5%)

- American (24%)
- English (19%)
- German (17%)
- European (9%)
- Irish (8%)
- Scottish (2%)
- Polish (1%)


People in group quarters in Owen County, Indiana in 2010:
- 119 people in nursing facilities/skilled-nursing facilities
- 62 people in local jails and other municipal confinement facilities
- 16 people in group homes intended for adults
People in group quarters in Owen County, Indiana in 2000:
- 191 people in nursing homes
- 52 people in local jails and other confinement facilities (including police lockups)
- 16 people in homes or halfway houses for drug/alcohol abuse
- 11 people in other noninstitutional group quarters
- 10 people in homes for the mentally retarded
- 7 people in agriculture workers' dormitories on farms
8.22% of this county's 2021 resident taxpayers lived in other counties in 2020 ($49,440 average adjusted gross income)
| Here: | 8.22% |
| Indiana average: | 6.66% |
10 or fewer of this county's residents moved from foreign countries.
7.23% relocated from other counties in Indiana ($43,843 average AGI)
0.99% relocated from other states ($5,596 average AGI)
Owen County: 0.99% Indiana average: 2.58%

Top counties from which taxpayers relocated into this county between 2020 and 2021:
| from Monroe County, IN | |
| from Marion County, IN | |
| from Morgan County, IN | |
| from Greene County, IN | |
| from Putnam County, IN | |
| from Clay County, IN | |
| from Hendricks County, IN |
7.30% of this county's 2020 resident taxpayers moved to other counties in 2021 ($40,997 average adjusted gross income)
| Here: | 7.30% |
| Indiana average: | 6.55% |
10 or fewer of this county's residents moved to foreign countries.
6.21% relocated to other counties in Indiana ($33,962 average AGI)
1.09% relocated to other states ($7,033 average AGI)
Owen County: 1.09% Indiana average: 2.46%

Top counties to which taxpayers relocated from this county between 2020 and 2021:
| to Monroe County, IN | |
| to Putnam County, IN | |
| to Marion County, IN | |
| to Greene County, IN | |
| to Morgan County, IN | |
| to Clay County, IN | |
| to Vigo County, IN |
Births per 1000 population from 1990 to 1999: 12.5
Births per 1000 population from 2000 to 2006: 10.9

Deaths per 1000 population from 1990 to 1999: 8.7
Deaths per 1000 population from 2000 to 2009: 9.7
Deaths per 1000 population from 2010 to 2020: 11.4

Infant deaths per 1000 live births from 1990 to 1999: 7.8
Infant deaths per 1000 live births from 2000 to 2006: 9.7

Persons under 19 years old without health insurance coverage in 2018: 7.5%


Persons enrolled in hospital insurance and/or supplemental medical insurance (Medicare) in July 1, 2007: 3,665 (2,980 aged, 685 disabled)
Children under 18 without health insurance coverage in 2007: 505 (10%)


Most common underlying causes of death in Owen County, Indiana in 1999 - 2019:
- Bronchus or lung, unspecified - Malignant neoplasms (364)
- Atherosclerotic heart disease (342)
- Acute myocardial infarction, unspecified (295)
- Chronic obstructive pulmonary disease, unspecified (186)
- Stroke, not specified as haemorrhage or infarction (44)
- Congestive heart failure (21)
- Pneumonia, unspecified (11)
- Alzheimer disease, unspecified (10)
- Colon, unspecified - Malignant neoplasms (10)
Population without health insurance coverage in 2000: 13%
Children under 18 without health insurance coverage in 2000: 11%
Medical specialist MDs per 100,000 population in 2005: 973
Dentists per 100,000 population in 1998: 4
Total births per 100,000 population, July 2005 - July 2006 : 15
Total deaths per 100,000 population, July 2005 - July 2006: 44
Limited-service eating places per 100,000 population in 2005 : 4
Suicides per 1,000,000 population from 2000 to 2006: 160.4. This is more than state average.
Household type by relationship:
Households: 21,514- Male householders: 4,392 (1,227 living alone), Female householders: 4,304 (1,344 living alone)
4,416 spouses (4,370 opposite-sex spouses), 658 unmarried partners, (651 opposite-sex unmarried partners), 5,691 children (5,214 natural, 174 adopted, 303 stepchildren), 530 grandchildren, 248 brothers or sisters, 215 parents, 22 foster children, 306 other relatives, 523 non-relatives
- In group quarters: 211
Size of family households: 2,949 2-persons, 1,145 3-persons, 772 4-persons, 518 5-persons, 180 6-persons, 75 7-or-more-persons.
Size of nonfamily households: 2,572 1-person, 376 2-persons, 34 3-persons, 40 4-persons, 37 5-persons, 6 7-or-more-persons.
2,592 married couples with children.
980 single-parent households (408 men, 572 women).
97.4% of residents of Owen speak English at home.
1.0% of residents speak Spanish at home (84% speak English very well, 12% speak English well, 4% speak English not well).
1.0% of residents speak other Indo-European language at home (45% speak English very well, 50% speak English well, 5% speak English not well).
0.2% of residents speak Asian or Pacific Island language at home (92% speak English very well, 8% speak English well).
In fiscal year 2004:
Federal Government expenditure: $86,596,000 ($3,753 per capita)
Department of Defense expenditure: $3,590,000
Federal direct payments to individuals for retirement and disability: $46,311,000
Federal other direct payments to individuals: $16,807,000
Federal direct payments not to individuals: $2,574,000
Federal grants: $15,553,000
Federal procurement contracts: $1,084,000 ($389,000 Department of Defense)
Federal salaries and wages: $4,266,000 ($1,627,000 Department of Defense)
Federal Government direct loans: $353,000
Federal guaranteed/insured loans: $6,341,000
Federal Government insurance: $13,499,000
Population change from April 1, 2000 to July 1, 2005:
Births: 1,271| Here: | 56 per 1000 residents |
| State: | 72 per 1000 residents |
Deaths: 1,158
| Here: | 51 per 1000 residents |
| State: | 47 per 1000 residents |
Net international migration: +9
| Here: | +0 per 1000 residents |
| State: | +9 per 1000 residents |
Net internal migration: +943
| Here: | |
| State: |

Total withdrawal of fresh water for public supply: 1.11 millions of gallons per day (all from ground)
| Here: | 6.1 |
| State: | 6.6 |
| Here: | 4.7 |
| State: | 4.3 |

- Year house built in Owen County, Indiana
- 672020 or later
- 7362010 to 2019
- 1,1782000 to 2009
- 1,6971990 to 1999
- 9041980 to 1989
- 1,3711970 to 1979
- 1,1291960 to 1969
- 7291950 to 1959
- 4411940 to 1949
- 1,5851939 or earlier

- Rooms in owner-occupied houses in Owen County, Indiana
- 351 room
- 112 rooms
- 2153 rooms
- 8744 rooms
- 1,4915 rooms
- 1,5816 rooms
- 1,2087 rooms
- 6948 rooms
- 8879+ rooms

- Rooms in renter-occupied apartments in Owen County, Indiana
- 71 room
- 1022 rooms
- 3113 rooms
- 3604 rooms
- 3525 rooms
- 3476 rooms
- 1567 rooms
- 758 rooms
- 109+ rooms

- Bedrooms in owner-occupied houses in Owen County, Indiana
- 44no bedroom
- 3511 bedroom
- 1,5972 bedrooms
- 4,0063 bedrooms
- 8484 bedrooms
- 1635+ bedrooms

- Bedrooms in renter-occupied apartments in Owen County, Indiana
- 14no bedroom
- 2971 bedroom
- 7112 bedrooms
- 6263 bedrooms
- 664 bedrooms
- 55+ bedrooms

- Cars and other vehicles available in Owen County in owner-occupied houses/condos
- 110no vehicle
- 1,5251 vehicle
- 3,0382 vehicles
- 1,4973 vehicles
- 4954 vehicles
- 3115+ vehicles

- Cars and other vehicles available in Owen County in renter-occupied apartments
- 147no vehicle
- 8161 vehicle
- 5622 vehicles
- 1323 vehicles
- 364 vehicles
- 225+ vehicles
88.1% of Owen County residents lived in the same house 1 years ago.
Out of people who lived in different houses, 30% lived in this county.
Out of people who lived in different counties, 93% lived in Indiana.
| Owen County: | 88.1% |
| State average: | 87.1% |
Place of birth for U.S.-born residents:
- This state: 17,377
- Other state: 3,704
- Northeast: 333
- Midwest: 1,617
- South: 1,255
- West: 500


- 30.6%Electricity
- 29.1%Utility gas
- 25.3%Bottled, tank, or LP gas
- 13.7%Wood
- 0.6%Other fuel
- 0.4%Coal or coke
- 0.3%Fuel oil, kerosene, etc.

- 54.7%Electricity
- 17.9%Utility gas
- 16.2%Bottled, tank, or LP gas
- 8.3%Wood
- 1.6%Other fuel
- 1.2%No fuel used
Private vs. public school enrollment:
| Here: | 14.5% |
| Indiana: | 14.9% |
| Here: | 12.4% |
| Indiana: | 11.4% |
| Here: | 7.1% |
| Indiana: | 22.3% |


Owen County government finances - Expenditure in 2017:
- Bond Funds - Cash and Securities: $343,000
- Charges - Other: $149,000
Solid Waste Management: $16,000
Regular Highways: $15,000
- Construction - Regular Highways: $713,000
- Current Operations - Regular Highways: $2,356,000
Health - Other: $1,310,000
Judicial and Legal Services: $1,263,000
General - Other: $1,054,000
Central Staff Services: $882,000
Financial Administration: $689,000
General Public Buildings: $433,000
Corrections - Other: $410,000
Natural Resources - Other: $133,000
Correctional Institutions: $131,000
Solid Waste Management: $102,000
Police Protection: $57,000
Parks and Recreation: $21,000
- General - Interest on Debt: $84,000
- Intergovernmental to Local - Other - Health - Other: $17,000
- Long Term Debt - Outstanding Unspecified Public Purpose: $2,095,000
Beginning Outstanding - Unspecified Public Purpose: $2,095,000
- Miscellaneous - Donations From Private Sources: $234,000
General Revenue - Other: $145,000
- Other Capital Outlay - General - Other: $97,000
Regular Highways: $55,000
Judicial and Legal Services: $5,000
Corrections - Other: $5,000
Natural Resources - Other: $3,000
Health - Other: $3,000
Financial Administration: $1,000
- Other Funds - Cash and Securities: $10,453,000
- Sinking Funds - Cash and Securities: $19,000
- State Intergovernmental - Highways: $2,038,000
Other: $51,000
General Local Government Support: $32,000
- Tax - Property: $3,350,000
Other License: $14,000
Owen County government finances - Revenue in 2017:
- Bond Funds - Cash and Securities: $343,000
- Charges - Other: $149,000
Solid Waste Management: $16,000
Regular Highways: $15,000
- Construction - Regular Highways: $713,000
- Current Operations - Regular Highways: $2,356,000
Health - Other: $1,310,000
Judicial and Legal Services: $1,263,000
General - Other: $1,054,000
Central Staff Services: $882,000
Financial Administration: $689,000
General Public Buildings: $433,000
Corrections - Other: $410,000
Natural Resources - Other: $133,000
Correctional Institutions: $131,000
Solid Waste Management: $102,000
Police Protection: $57,000
Parks and Recreation: $21,000
- General - Interest on Debt: $84,000
- Intergovernmental to Local - Other - Health - Other: $17,000
- Long Term Debt - Outstanding Unspecified Public Purpose: $2,095,000
Beginning Outstanding - Unspecified Public Purpose: $2,095,000
- Miscellaneous - Donations From Private Sources: $234,000
General Revenue - Other: $145,000
- Other Capital Outlay - General - Other: $97,000
Regular Highways: $55,000
Judicial and Legal Services: $5,000
Corrections - Other: $5,000
Natural Resources - Other: $3,000
Health - Other: $3,000
Financial Administration: $1,000
- Other Funds - Cash and Securities: $10,453,000
- Sinking Funds - Cash and Securities: $19,000
- State Intergovernmental - Highways: $2,038,000
Other: $51,000
General Local Government Support: $32,000
- Tax - Property: $3,350,000
Other License: $14,000
Owen County government finances - Debt in 2017:
- Bond Funds - Cash and Securities: $343,000
- Charges - Other: $149,000
Solid Waste Management: $16,000
Regular Highways: $15,000
- Construction - Regular Highways: $713,000
- Current Operations - Regular Highways: $2,356,000
Health - Other: $1,310,000
Judicial and Legal Services: $1,263,000
General - Other: $1,054,000
Central Staff Services: $882,000
Financial Administration: $689,000
General Public Buildings: $433,000
Corrections - Other: $410,000
Natural Resources - Other: $133,000
Correctional Institutions: $131,000
Solid Waste Management: $102,000
Police Protection: $57,000
Parks and Recreation: $21,000
- General - Interest on Debt: $84,000
- Intergovernmental to Local - Other - Health - Other: $17,000
- Long Term Debt - Outstanding Unspecified Public Purpose: $2,095,000
Beginning Outstanding - Unspecified Public Purpose: $2,095,000
- Miscellaneous - Donations From Private Sources: $234,000
General Revenue - Other: $145,000
- Other Capital Outlay - General - Other: $97,000
Regular Highways: $55,000
Judicial and Legal Services: $5,000
Corrections - Other: $5,000
Natural Resources - Other: $3,000
Health - Other: $3,000
Financial Administration: $1,000
- Other Funds - Cash and Securities: $10,453,000
- Sinking Funds - Cash and Securities: $19,000
- State Intergovernmental - Highways: $2,038,000
Other: $51,000
General Local Government Support: $32,000
- Tax - Property: $3,350,000
Other License: $14,000
Owen County government finances - Cash and Securities in 2017:
- Bond Funds - Cash and Securities: $343,000
- Charges - Other: $149,000
Solid Waste Management: $16,000
Regular Highways: $15,000
- Construction - Regular Highways: $713,000
- Current Operations - Regular Highways: $2,356,000
Health - Other: $1,310,000
Judicial and Legal Services: $1,263,000
General - Other: $1,054,000
Central Staff Services: $882,000
Financial Administration: $689,000
General Public Buildings: $433,000
Corrections - Other: $410,000
Natural Resources - Other: $133,000
Correctional Institutions: $131,000
Solid Waste Management: $102,000
Police Protection: $57,000
Parks and Recreation: $21,000
- General - Interest on Debt: $84,000
- Intergovernmental to Local - Other - Health - Other: $17,000
- Long Term Debt - Outstanding Unspecified Public Purpose: $2,095,000
Beginning Outstanding - Unspecified Public Purpose: $2,095,000
- Miscellaneous - Donations From Private Sources: $234,000
General Revenue - Other: $145,000
- Other Capital Outlay - General - Other: $97,000
Regular Highways: $55,000
Judicial and Legal Services: $5,000
Corrections - Other: $5,000
Natural Resources - Other: $3,000
Health - Other: $3,000
Financial Administration: $1,000
- Other Funds - Cash and Securities: $10,453,000
- Sinking Funds - Cash and Securities: $19,000
- State Intergovernmental - Highways: $2,038,000
Other: $51,000
General Local Government Support: $32,000
- Tax - Property: $3,350,000
Other License: $14,000
Supplemental Security Income (SSI) in 2006:
- Total number of recipients: 313
- Number of aged recipients: 19
- Number of blind and disabled recipients: 294
- Number of recipients under 18: 54
- Number of recipients between 18 and 64: 220
- Number of recipients older than 64: 39
- Number of recipients also receiving OASDI: 107
- Amount of payments (thousands of dollars): 133
| Most common first names in Owen County, IN among deceased individuals | ||
| Name | Count | Lived (average) |
|---|---|---|
| Mary | 111 | 80.5 years |
| Robert | 98 | 69.7 years |
| James | 93 | 71.4 years |
| Charles | 84 | 76.8 years |
| John | 79 | 75.6 years |
| William | 73 | 77.5 years |
| Ruth | 52 | 82.8 years |
| Helen | 44 | 82.6 years |
| Paul | 38 | 74.8 years |
| George | 37 | 75.7 years |
| Most common last names in Owen County, IN among deceased individuals | ||
| Last name | Count | Lived (average) |
|---|---|---|
| Smith | 54 | 75.7 years |
| Johnson | 32 | 75.6 years |
| Miller | 32 | 75.4 years |
| Franklin | 30 | 77.4 years |
| White | 28 | 77.1 years |
| Jones | 25 | 81.0 years |
| Freeman | 24 | 75.0 years |
| Wood | 23 | 73.6 years |
| Brown | 23 | 80.7 years |
| Wampler | 23 | 82.3 years |
| Businesses in Owen County, IN | ||||
| Name | Count | Name | Count | |
|---|---|---|---|---|
| AutoZone | 1 | McDonald's | 1 | |
| Burger King | 1 | Pizza Hut | 1 | |
| CVS | 1 | Subway | 1 | |
| Chevrolet | 1 | Taco Bell | 1 | |
| Dairy Queen | 1 | UPS | 1 | |
| FedEx | 1 | Walmart | 1 | |
| H&R Block | 1 | Wendy's | 1 | |
| KFC | 1 | YMCA | 1 | |
| La-Z-Boy | 1 | |||