Newfield, New Jersey Submit your own pictures of this borough and show them to the world
OSM Map
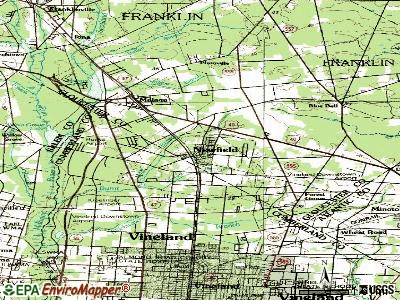
General Map
Google Map
MSN Map
OSM Map
General Map
Google Map
MSN Map
OSM Map
General Map
Google Map
MSN Map
OSM Map
General Map
Google Map
MSN Map
Please wait while loading the map...
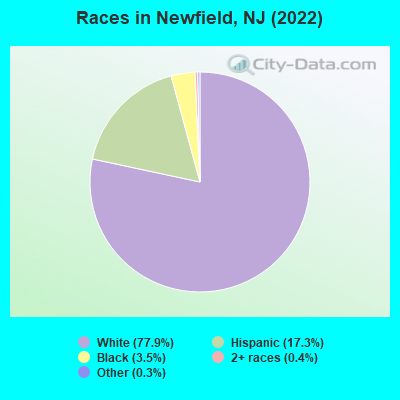
Population in 2022: 1,793 (86% urban, 14% rural). Population change since 2000: +11.0%Males: 901 Females: 892
March 2022 cost of living index in Newfield: 101.1 (near average, U.S. average is 100) Percentage of residents living in poverty in 2022: 5.7%for White Non-Hispanic residents , 29.4% for Black residents , 1.1% for Hispanic or Latino residents , 6.2% for other race residents )
Profiles of local businesses
Business Search - 14 Million verified businesses
Data:
Median household income ($)
Median household income (% change since 2000)
Household income diversity
Ratio of average income to average house value (%)
Ratio of average income to average rent
Median household income ($) - White
Median household income ($) - Black or African American
Median household income ($) - Asian
Median household income ($) - Hispanic or Latino
Median household income ($) - American Indian and Alaska Native
Median household income ($) - Multirace
Median household income ($) - Other Race
Median household income for houses/condos with a mortgage ($)
Median household income for apartments without a mortgage ($)
Races - White alone (%)
Races - White alone (% change since 2000)
Races - Black alone (%)
Races - Black alone (% change since 2000)
Races - American Indian alone (%)
Races - American Indian alone (% change since 2000)
Races - Asian alone (%)
Races - Asian alone (% change since 2000)
Races - Hispanic (%)
Races - Hispanic (% change since 2000)
Races - Native Hawaiian and Other Pacific Islander alone (%)
Races - Native Hawaiian and Other Pacific Islander alone (% change since 2000)
Races - Two or more races (%)
Races - Two or more races (% change since 2000)
Races - Other race alone (%)
Races - Other race alone (% change since 2000)
Racial diversity
Unemployment (%)
Unemployment (% change since 2000)
Unemployment (%) - White
Unemployment (%) - Black or African American
Unemployment (%) - Asian
Unemployment (%) - Hispanic or Latino
Unemployment (%) - American Indian and Alaska Native
Unemployment (%) - Multirace
Unemployment (%) - Other Race
Population density (people per square mile)
Population - Males (%)
Population - Females (%)
Population - Males (%) - White
Population - Males (%) - Black or African American
Population - Males (%) - Asian
Population - Males (%) - Hispanic or Latino
Population - Males (%) - American Indian and Alaska Native
Population - Males (%) - Multirace
Population - Males (%) - Other Race
Population - Females (%) - White
Population - Females (%) - Black or African American
Population - Females (%) - Asian
Population - Females (%) - Hispanic or Latino
Population - Females (%) - American Indian and Alaska Native
Population - Females (%) - Multirace
Population - Females (%) - Other Race
Coronavirus confirmed cases (Jun 08, 2024)
Deaths caused by coronavirus (Jun 08, 2024)
Coronavirus confirmed cases (per 100k population) (Jun 08, 2024)
Deaths caused by coronavirus (per 100k population) (Jun 08, 2024)
Daily increase in number of cases (Jun 08, 2024)
Weekly increase in number of cases (Jun 08, 2024)
Cases doubled (in days) (Jun 08, 2024)
Hospitalized patients (Apr 18, 2022)
Negative test results (Apr 18, 2022)
Total test results (Apr 18, 2022)
COVID Vaccine doses distributed (per 100k population) (Sep 19, 2023)
COVID Vaccine doses administered (per 100k population) (Sep 19, 2023)
COVID Vaccine doses distributed (Sep 19, 2023)
COVID Vaccine doses administered (Sep 19, 2023)
Likely homosexual households (%)
Likely homosexual households (% change since 2000)
Likely homosexual households - Lesbian couples (%)
Likely homosexual households - Lesbian couples (% change since 2000)
Likely homosexual households - Gay men (%)
Likely homosexual households - Gay men (% change since 2000)
Cost of living index
Median gross rent ($)
Median contract rent ($)
Median monthly housing costs ($)
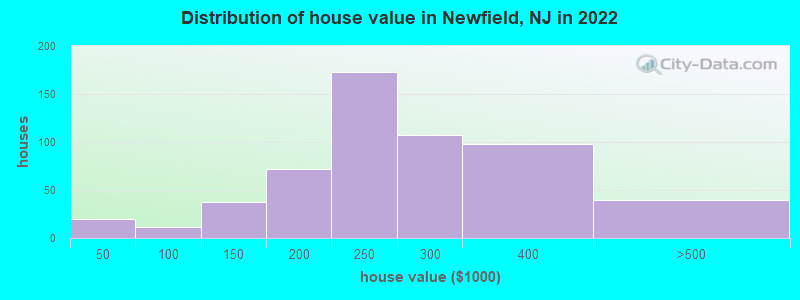
Median house or condo value ($)
Median house or condo value ($ change since 2000)
Mean house or condo value by units in structure - 1, detached ($)
Mean house or condo value by units in structure - 1, attached ($)
Mean house or condo value by units in structure - 2 ($)
Mean house or condo value by units in structure by units in structure - 3 or 4 ($)
Mean house or condo value by units in structure - 5 or more ($)
Mean house or condo value by units in structure - Boat, RV, van, etc. ($)
Mean house or condo value by units in structure - Mobile home ($)
Median house or condo value ($) - White
Median house or condo value ($) - Black or African American
Median house or condo value ($) - Asian
Median house or condo value ($) - Hispanic or Latino
Median house or condo value ($) - American Indian and Alaska Native
Median house or condo value ($) - Multirace
Median house or condo value ($) - Other Race
Median resident age
Resident age diversity
Median resident age - Males
Median resident age - Females
Median resident age - White
Median resident age - Black or African American
Median resident age - Asian
Median resident age - Hispanic or Latino
Median resident age - American Indian and Alaska Native
Median resident age - Multirace
Median resident age - Other Race
Median resident age - Males - White
Median resident age - Males - Black or African American
Median resident age - Males - Asian
Median resident age - Males - Hispanic or Latino
Median resident age - Males - American Indian and Alaska Native
Median resident age - Males - Multirace
Median resident age - Males - Other Race
Median resident age - Females - White
Median resident age - Females - Black or African American
Median resident age - Females - Asian
Median resident age - Females - Hispanic or Latino
Median resident age - Females - American Indian and Alaska Native
Median resident age - Females - Multirace
Median resident age - Females - Other Race
Commute - mean travel time to work (minutes)
Travel time to work - Less than 5 minutes (%)
Travel time to work - Less than 5 minutes (% change since 2000)
Travel time to work - 5 to 9 minutes (%)
Travel time to work - 5 to 9 minutes (% change since 2000)
Travel time to work - 10 to 19 minutes (%)
Travel time to work - 10 to 19 minutes (% change since 2000)
Travel time to work - 20 to 29 minutes (%)
Travel time to work - 20 to 29 minutes (% change since 2000)
Travel time to work - 30 to 39 minutes (%)
Travel time to work - 30 to 39 minutes (% change since 2000)
Travel time to work - 40 to 59 minutes (%)
Travel time to work - 40 to 59 minutes (% change since 2000)
Travel time to work - 60 to 89 minutes (%)
Travel time to work - 60 to 89 minutes (% change since 2000)
Travel time to work - 90 or more minutes (%)
Travel time to work - 90 or more minutes (% change since 2000)
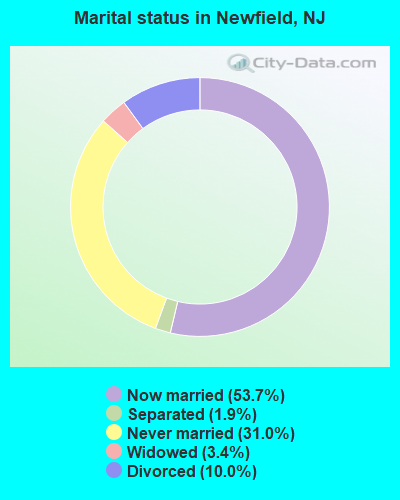
Marital status - Never married (%)
Marital status - Now married (%)
Marital status - Separated (%)
Marital status - Widowed (%)
Marital status - Divorced (%)
Median family income ($)
Median family income (% change since 2000)
Median non-family income ($)
Median non-family income (% change since 2000)
Median per capita income ($)
Median per capita income (% change since 2000)
Median family income ($) - White
Median family income ($) - Black or African American
Median family income ($) - Asian
Median family income ($) - Hispanic or Latino
Median family income ($) - American Indian and Alaska Native
Median family income ($) - Multirace
Median family income ($) - Other Race
Median year house/condo built
Median year apartment built
Year house built - Built 2005 or later (%)
Year house built - Built 2000 to 2004 (%)
Year house built - Built 1990 to 1999 (%)
Year house built - Built 1980 to 1989 (%)
Year house built - Built 1970 to 1979 (%)
Year house built - Built 1960 to 1969 (%)
Year house built - Built 1950 to 1959 (%)
Year house built - Built 1940 to 1949 (%)
Year house built - Built 1939 or earlier (%)
Average household size
Household density (households per square mile)
Average household size - White
Average household size - Black or African American
Average household size - Asian
Average household size - Hispanic or Latino
Average household size - American Indian and Alaska Native
Average household size - Multirace
Average household size - Other Race
Occupied housing units (%)
Vacant housing units (%)
Owner occupied housing units (%)
Renter occupied housing units (%)
Vacancy status - For rent (%)
Vacancy status - For sale only (%)
Vacancy status - Rented or sold, not occupied (%)
Vacancy status - For seasonal, recreational, or occasional use (%)
Vacancy status - For migrant workers (%)
Vacancy status - Other vacant (%)
Residents with income below the poverty level (%)
Residents with income below 50% of the poverty level (%)
Children below poverty level (%)
Poor families by family type - Married-couple family (%)
Poor families by family type - Male, no wife present (%)
Poor families by family type - Female, no husband present (%)
Poverty status for native-born residents (%)
Poverty status for foreign-born residents (%)
Poverty among high school graduates not in families (%)
Poverty among people who did not graduate high school not in families (%)
Residents with income below the poverty level (%) - White
Residents with income below the poverty level (%) - Black or African American
Residents with income below the poverty level (%) - Asian
Residents with income below the poverty level (%) - Hispanic or Latino
Residents with income below the poverty level (%) - American Indian and Alaska Native
Residents with income below the poverty level (%) - Multirace
Residents with income below the poverty level (%) - Other Race
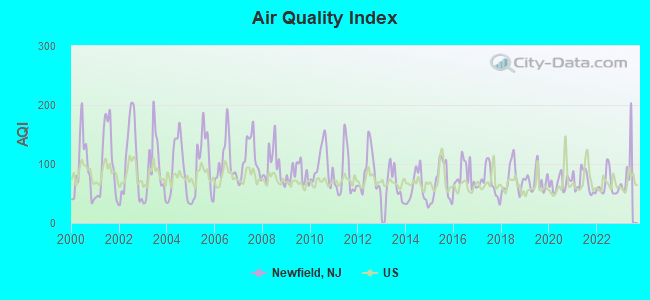
Air pollution - Air Quality Index (AQI)
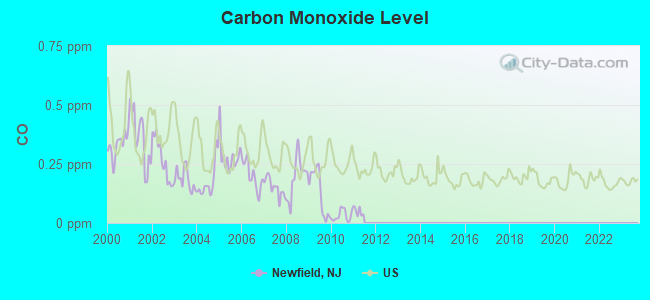
Air pollution - CO
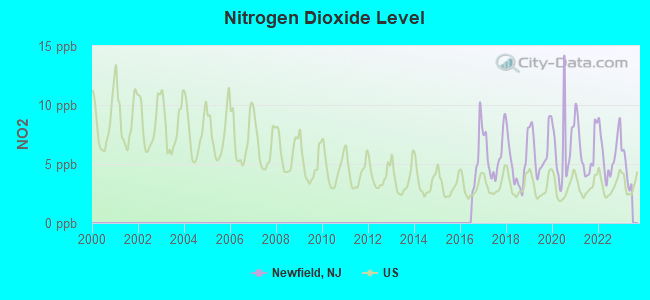
Air pollution - NO2
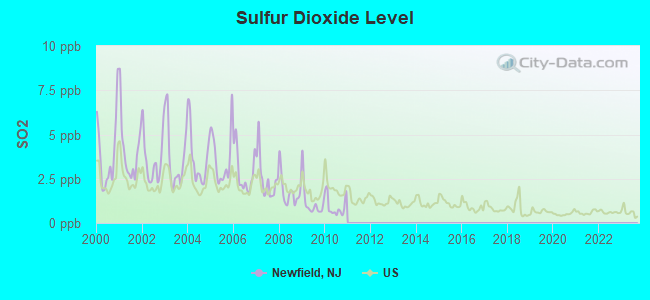
Air pollution - SO2
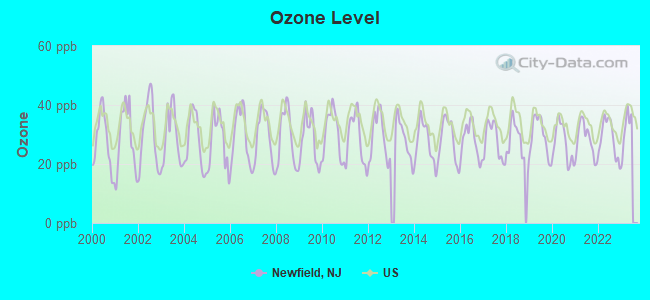
Air pollution - Ozone
Air pollution - PM10
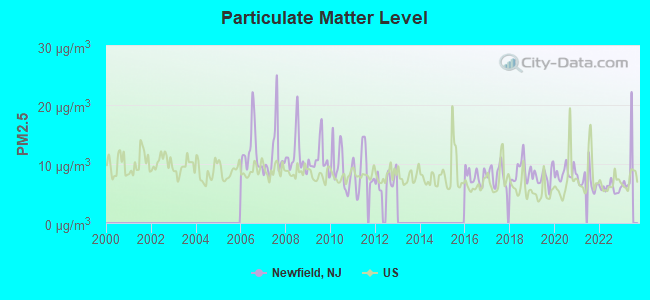
Air pollution - PM25
Air pollution - Pb
Crime - Murders per 100,000 population
Crime - Rapes per 100,000 population
Crime - Robberies per 100,000 population
Crime - Assaults per 100,000 population
Crime - Burglaries per 100,000 population
Crime - Thefts per 100,000 population
Crime - Auto thefts per 100,000 population
Crime - Arson per 100,000 population
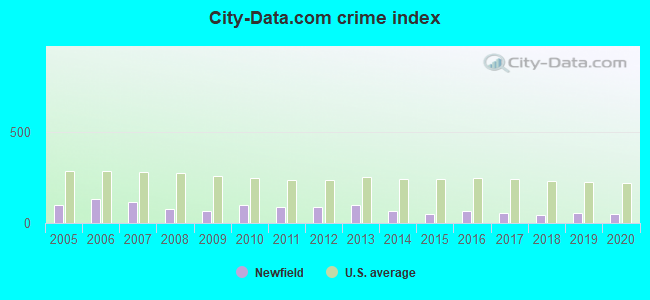
Crime - City-data.com crime index
Crime - Violent crime index
Crime - Property crime index
Crime - Murders per 100,000 population (5 year average)
Crime - Rapes per 100,000 population (5 year average)
Crime - Robberies per 100,000 population (5 year average)
Crime - Assaults per 100,000 population (5 year average)
Crime - Burglaries per 100,000 population (5 year average)
Crime - Thefts per 100,000 population (5 year average)
Crime - Auto thefts per 100,000 population (5 year average)
Crime - Arson per 100,000 population (5 year average)
Crime - City-data.com crime index (5 year average)
Crime - Violent crime index (5 year average)
Crime - Property crime index (5 year average)
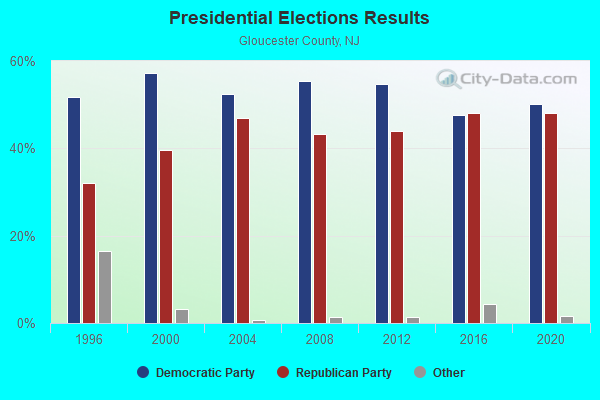
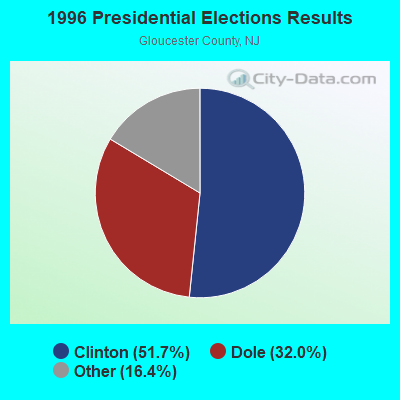
1996 Presidential Elections Results (%) - Democratic Party (Clinton)
1996 Presidential Elections Results (%) - Republican Party (Dole)
1996 Presidential Elections Results (%) - Other
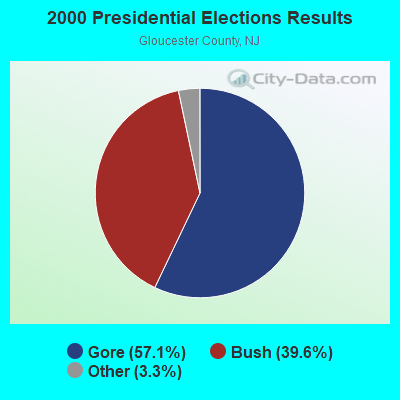
2000 Presidential Elections Results (%) - Democratic Party (Gore)
2000 Presidential Elections Results (%) - Republican Party (Bush)
2000 Presidential Elections Results (%) - Other
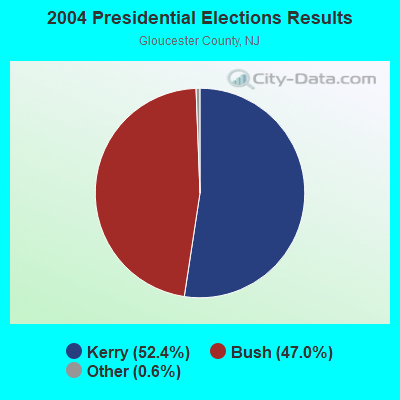
2004 Presidential Elections Results (%) - Democratic Party (Kerry)
2004 Presidential Elections Results (%) - Republican Party (Bush)
2004 Presidential Elections Results (%) - Other
2008 Presidential Elections Results (%) - Democratic Party (Obama)
2008 Presidential Elections Results (%) - Republican Party (McCain)
2008 Presidential Elections Results (%) - Other
2012 Presidential Elections Results (%) - Democratic Party (Obama)
2012 Presidential Elections Results (%) - Republican Party (Romney)
2012 Presidential Elections Results (%) - Other
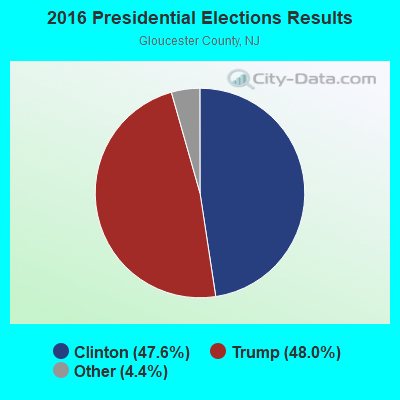
2016 Presidential Elections Results (%) - Democratic Party (Clinton)
2016 Presidential Elections Results (%) - Republican Party (Trump)
2016 Presidential Elections Results (%) - Other
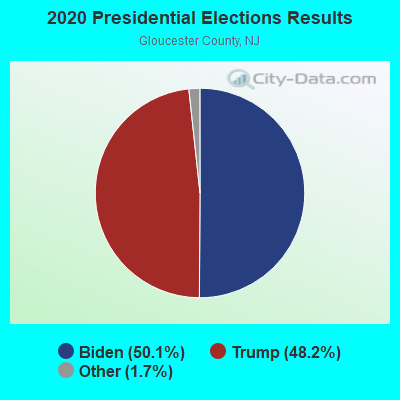
2020 Presidential Elections Results (%) - Democratic Party (Biden)
2020 Presidential Elections Results (%) - Republican Party (Trump)
2020 Presidential Elections Results (%) - Other
Ancestries Reported - Arab (%)
Ancestries Reported - Czech (%)
Ancestries Reported - Danish (%)
Ancestries Reported - Dutch (%)
Ancestries Reported - English (%)
Ancestries Reported - French (%)
Ancestries Reported - French Canadian (%)
Ancestries Reported - German (%)
Ancestries Reported - Greek (%)
Ancestries Reported - Hungarian (%)
Ancestries Reported - Irish (%)
Ancestries Reported - Italian (%)
Ancestries Reported - Lithuanian (%)
Ancestries Reported - Norwegian (%)
Ancestries Reported - Polish (%)
Ancestries Reported - Portuguese (%)
Ancestries Reported - Russian (%)
Ancestries Reported - Scotch-Irish (%)
Ancestries Reported - Scottish (%)
Ancestries Reported - Slovak (%)
Ancestries Reported - Subsaharan African (%)
Ancestries Reported - Swedish (%)
Ancestries Reported - Swiss (%)
Ancestries Reported - Ukrainian (%)
Ancestries Reported - United States (%)
Ancestries Reported - Welsh (%)
Ancestries Reported - West Indian (%)
Ancestries Reported - Other (%)
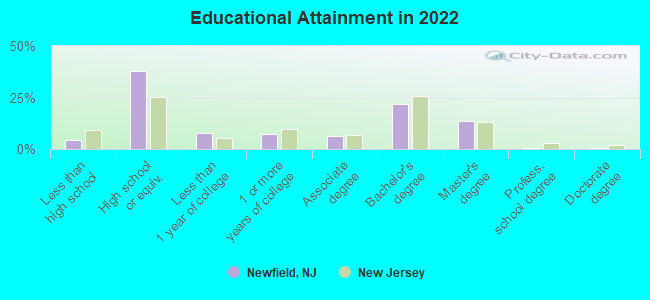
Educational Attainment - No schooling completed (%)
Educational Attainment - Less than high school (%)
Educational Attainment - High school or equivalent (%)
Educational Attainment - Less than 1 year of college (%)
Educational Attainment - 1 or more years of college (%)
Educational Attainment - Associate degree (%)
Educational Attainment - Bachelor's degree (%)
Educational Attainment - Master's degree (%)
Educational Attainment - Professional school degree (%)
Educational Attainment - Doctorate degree (%)
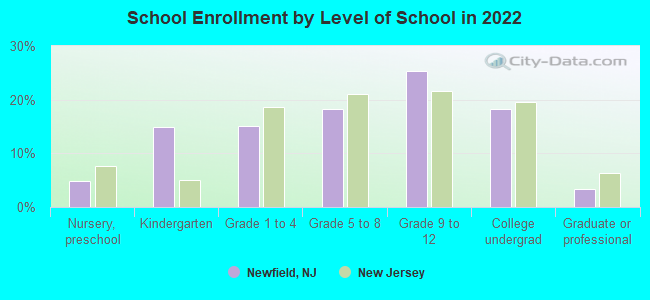
School Enrollment - Nursery, preschool (%)
School Enrollment - Kindergarten (%)
School Enrollment - Grade 1 to 4 (%)
School Enrollment - Grade 5 to 8 (%)
School Enrollment - Grade 9 to 12 (%)
School Enrollment - College undergrad (%)
School Enrollment - Graduate or professional (%)
School Enrollment - Not enrolled in school (%)
School enrollment - Public schools (%)
School enrollment - Private schools (%)
School enrollment - Not enrolled (%)
Median number of rooms in houses and condos
Median number of rooms in apartments
Housing units lacking complete plumbing facilities (%)
Housing units lacking complete kitchen facilities (%)
Density of houses
Urban houses (%)
Rural houses (%)
Households with people 60 years and over (%)
Households with people 65 years and over (%)
Households with people 75 years and over (%)
Households with one or more nonrelatives (%)
Households with no nonrelatives (%)
Population in households (%)
Family households (%)
Nonfamily households (%)
Population in families (%)
Family households with own children (%)
Median number of bedrooms in owner occupied houses
Mean number of bedrooms in owner occupied houses
Median number of bedrooms in renter occupied houses
Mean number of bedrooms in renter occupied houses
Median number of vehichles in owner occupied houses
Mean number of vehichles in owner occupied houses
Median number of vehichles in renter occupied houses
Mean number of vehichles in renter occupied houses
Mortgage status - with mortgage (%)
Mortgage status - with second mortgage (%)
Mortgage status - with home equity loan (%)
Mortgage status - with both second mortgage and home equity loan (%)
Mortgage status - without a mortgage (%)
Average family size
Average family size - White
Average family size - Black or African American
Average family size - Asian
Average family size - Hispanic or Latino
Average family size - American Indian and Alaska Native
Average family size - Multirace
Average family size - Other Race
Geographical mobility - Same house 1 year ago (%)
Geographical mobility - Moved within same county (%)
Geographical mobility - Moved from different county within same state (%)
Geographical mobility - Moved from different state (%)
Geographical mobility - Moved from abroad (%)
Place of birth - Born in state of residence (%)
Place of birth - Born in other state (%)
Place of birth - Native, outside of US (%)
Place of birth - Foreign born (%)
Housing units in structures - 1, detached (%)
Housing units in structures - 1, attached (%)
Housing units in structures - 2 (%)
Housing units in structures - 3 or 4 (%)
Housing units in structures - 5 to 9 (%)
Housing units in structures - 10 to 19 (%)
Housing units in structures - 20 to 49 (%)
Housing units in structures - 50 or more (%)
Housing units in structures - Mobile home (%)
Housing units in structures - Boat, RV, van, etc. (%)
House/condo owner moved in on average (years ago)
Renter moved in on average (years ago)
Year householder moved into unit - Moved in 1999 to March 2000 (%)
Year householder moved into unit - Moved in 1995 to 1998 (%)
Year householder moved into unit - Moved in 1990 to 1994 (%)
Year householder moved into unit - Moved in 1980 to 1989 (%)
Year householder moved into unit - Moved in 1970 to 1979 (%)
Year householder moved into unit - Moved in 1969 or earlier (%)
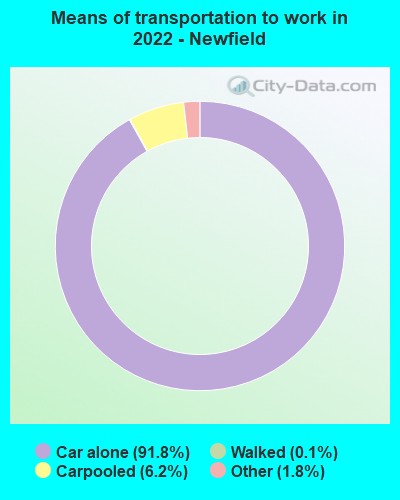
Means of transportation to work - Drove car alone (%)
Means of transportation to work - Carpooled (%)
Means of transportation to work - Public transportation (%)
Means of transportation to work - Bus or trolley bus (%)
Means of transportation to work - Streetcar or trolley car (%)
Means of transportation to work - Subway or elevated (%)
Means of transportation to work - Railroad (%)
Means of transportation to work - Ferryboat (%)
Means of transportation to work - Taxicab (%)
Means of transportation to work - Motorcycle (%)
Means of transportation to work - Bicycle (%)
Means of transportation to work - Walked (%)
Means of transportation to work - Other means (%)
Working at home (%)
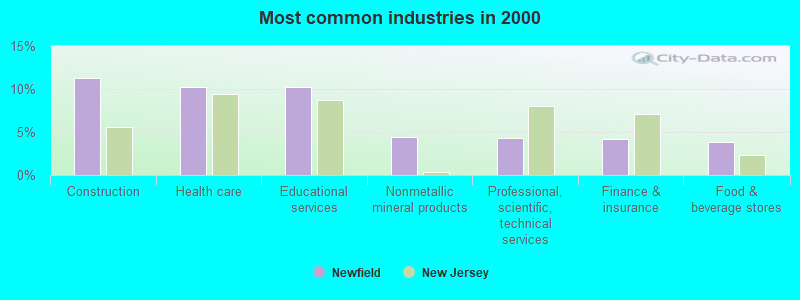
Industry diversity
Most Common Industries - Agriculture, forestry, fishing and hunting, and mining (%)
Most Common Industries - Agriculture, forestry, fishing and hunting (%)
Most Common Industries - Mining, quarrying, and oil and gas extraction (%)
Most Common Industries - Construction (%)
Most Common Industries - Manufacturing (%)
Most Common Industries - Wholesale trade (%)
Most Common Industries - Retail trade (%)
Most Common Industries - Transportation and warehousing, and utilities (%)
Most Common Industries - Transportation and warehousing (%)
Most Common Industries - Utilities (%)
Most Common Industries - Information (%)
Most Common Industries - Finance and insurance, and real estate and rental and leasing (%)
Most Common Industries - Finance and insurance (%)
Most Common Industries - Real estate and rental and leasing (%)
Most Common Industries - Professional, scientific, and management, and administrative and waste management services (%)
Most Common Industries - Professional, scientific, and technical services (%)
Most Common Industries - Management of companies and enterprises (%)
Most Common Industries - Administrative and support and waste management services (%)
Most Common Industries - Educational services, and health care and social assistance (%)
Most Common Industries - Educational services (%)
Most Common Industries - Health care and social assistance (%)
Most Common Industries - Arts, entertainment, and recreation, and accommodation and food services (%)
Most Common Industries - Arts, entertainment, and recreation (%)
Most Common Industries - Accommodation and food services (%)
Most Common Industries - Other services, except public administration (%)
Most Common Industries - Public administration (%)
Occupation diversity
Most Common Occupations - Management, business, science, and arts occupations (%)
Most Common Occupations - Management, business, and financial occupations (%)
Most Common Occupations - Management occupations (%)
Most Common Occupations - Business and financial operations occupations (%)
Most Common Occupations - Computer, engineering, and science occupations (%)
Most Common Occupations - Computer and mathematical occupations (%)
Most Common Occupations - Architecture and engineering occupations (%)
Most Common Occupations - Life, physical, and social science occupations (%)
Most Common Occupations - Education, legal, community service, arts, and media occupations (%)
Most Common Occupations - Community and social service occupations (%)
Most Common Occupations - Legal occupations (%)
Most Common Occupations - Education, training, and library occupations (%)
Most Common Occupations - Arts, design, entertainment, sports, and media occupations (%)
Most Common Occupations - Healthcare practitioners and technical occupations (%)
Most Common Occupations - Health diagnosing and treating practitioners and other technical occupations (%)
Most Common Occupations - Health technologists and technicians (%)
Most Common Occupations - Service occupations (%)
Most Common Occupations - Healthcare support occupations (%)
Most Common Occupations - Protective service occupations (%)
Most Common Occupations - Fire fighting and prevention, and other protective service workers including supervisors (%)
Most Common Occupations - Law enforcement workers including supervisors (%)
Most Common Occupations - Food preparation and serving related occupations (%)
Most Common Occupations - Building and grounds cleaning and maintenance occupations (%)
Most Common Occupations - Personal care and service occupations (%)
Most Common Occupations - Sales and office occupations (%)
Most Common Occupations - Sales and related occupations (%)
Most Common Occupations - Office and administrative support occupations (%)
Most Common Occupations - Natural resources, construction, and maintenance occupations (%)
Most Common Occupations - Farming, fishing, and forestry occupations (%)
Most Common Occupations - Construction and extraction occupations (%)
Most Common Occupations - Installation, maintenance, and repair occupations (%)
Most Common Occupations - Production, transportation, and material moving occupations (%)
Most Common Occupations - Production occupations (%)
Most Common Occupations - Transportation occupations (%)
Most Common Occupations - Material moving occupations (%)
People in Group quarters - Institutionalized population (%)
People in Group quarters - Correctional institutions (%)
People in Group quarters - Federal prisons and detention centers (%)
People in Group quarters - Halfway houses (%)
People in Group quarters - Local jails and other confinement facilities (including police lockups) (%)
People in Group quarters - Military disciplinary barracks (%)
People in Group quarters - State prisons (%)
People in Group quarters - Other types of correctional institutions (%)
People in Group quarters - Nursing homes (%)
People in Group quarters - Hospitals/wards, hospices, and schools for the handicapped (%)
People in Group quarters - Hospitals/wards and hospices for chronically ill (%)
People in Group quarters - Hospices or homes for chronically ill (%)
People in Group quarters - Military hospitals or wards for chronically ill (%)
People in Group quarters - Other hospitals or wards for chronically ill (%)
People in Group quarters - Hospitals or wards for drug/alcohol abuse (%)
People in Group quarters - Mental (Psychiatric) hospitals or wards (%)
People in Group quarters - Schools, hospitals, or wards for the mentally retarded (%)
People in Group quarters - Schools, hospitals, or wards for the physically handicapped (%)
People in Group quarters - Institutions for the deaf (%)
People in Group quarters - Institutions for the blind (%)
People in Group quarters - Orthopedic wards and institutions for the physically handicapped (%)
People in Group quarters - Wards in general hospitals for patients who have no usual home elsewhere (%)
People in Group quarters - Wards in military hospitals for patients who have no usual home elsewhere (%)
People in Group quarters - Juvenile institutions (%)
People in Group quarters - Long-term care (%)
People in Group quarters - Homes for abused, dependent, and neglected children (%)
People in Group quarters - Residential treatment centers for emotionally disturbed children (%)
People in Group quarters - Training schools for juvenile delinquents (%)
People in Group quarters - Short-term care, detention or diagnostic centers for delinquent children (%)
People in Group quarters - Type of juvenile institution unknown (%)
People in Group quarters - Noninstitutionalized population (%)
People in Group quarters - College dormitories (includes college quarters off campus) (%)
People in Group quarters - Military quarters (%)
People in Group quarters - On base (%)
People in Group quarters - Barracks, unaccompanied personnel housing (UPH), (Enlisted/Officer), ;and similar group living quarters for military personnel (%)
People in Group quarters - Transient quarters for temporary residents (%)
People in Group quarters - Military ships (%)
People in Group quarters - Group homes (%)
People in Group quarters - Homes or halfway houses for drug/alcohol abuse (%)
People in Group quarters - Homes for the mentally ill (%)
People in Group quarters - Homes for the mentally retarded (%)
People in Group quarters - Homes for the physically handicapped (%)
People in Group quarters - Other group homes (%)
People in Group quarters - Religious group quarters (%)
People in Group quarters - Dormitories (%)
People in Group quarters - Agriculture workers' dormitories on farms (%)
People in Group quarters - Job Corps and vocational training facilities (%)
People in Group quarters - Other workers' dormitories (%)
People in Group quarters - Crews of maritime vessels (%)
People in Group quarters - Other nonhousehold living situations (%)
People in Group quarters - Other noninstitutional group quarters (%)
Residents speaking English at home (%)
Residents speaking English at home - Born in the United States (%)
Residents speaking English at home - Native, born elsewhere (%)
Residents speaking English at home - Foreign born (%)
Residents speaking Spanish at home (%)
Residents speaking Spanish at home - Born in the United States (%)
Residents speaking Spanish at home - Native, born elsewhere (%)
Residents speaking Spanish at home - Foreign born (%)
Residents speaking other language at home (%)
Residents speaking other language at home - Born in the United States (%)
Residents speaking other language at home - Native, born elsewhere (%)
Residents speaking other language at home - Foreign born (%)
Class of Workers - Employee of private company (%)
Class of Workers - Self-employed in own incorporated business (%)
Class of Workers - Private not-for-profit wage and salary workers (%)
Class of Workers - Local government workers (%)
Class of Workers - State government workers (%)
Class of Workers - Federal government workers (%)
Class of Workers - Self-employed workers in own not incorporated business and Unpaid family workers (%)
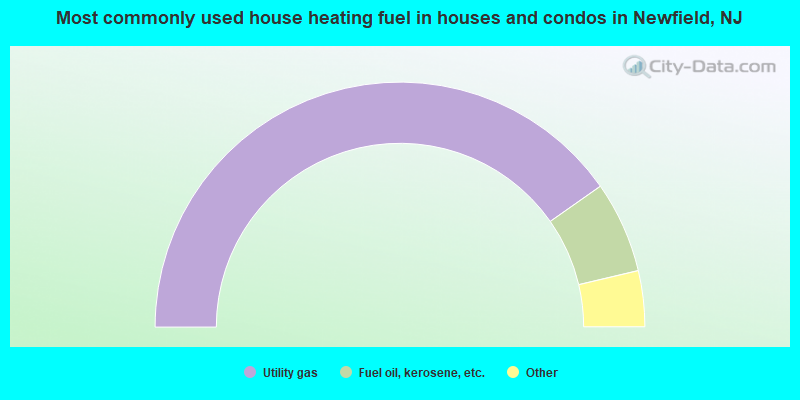
House heating fuel used in houses and condos - Utility gas (%)
House heating fuel used in houses and condos - Bottled, tank, or LP gas (%)
House heating fuel used in houses and condos - Electricity (%)
House heating fuel used in houses and condos - Fuel oil, kerosene, etc. (%)
House heating fuel used in houses and condos - Coal or coke (%)
House heating fuel used in houses and condos - Wood (%)
House heating fuel used in houses and condos - Solar energy (%)
House heating fuel used in houses and condos - Other fuel (%)
House heating fuel used in houses and condos - No fuel used (%)
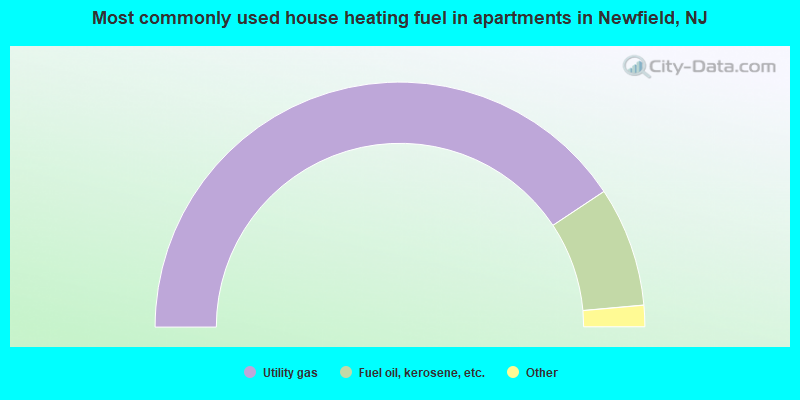
House heating fuel used in apartments - Utility gas (%)
House heating fuel used in apartments - Bottled, tank, or LP gas (%)
House heating fuel used in apartments - Electricity (%)
House heating fuel used in apartments - Fuel oil, kerosene, etc. (%)
House heating fuel used in apartments - Coal or coke (%)
House heating fuel used in apartments - Wood (%)
House heating fuel used in apartments - Solar energy (%)
House heating fuel used in apartments - Other fuel (%)
House heating fuel used in apartments - No fuel used (%)
Armed forces status - In Armed Forces (%)
Armed forces status - Civilian (%)
Armed forces status - Civilian - Veteran (%)
Armed forces status - Civilian - Nonveteran (%)
Fatal accidents locations in years 2005-2021
Fatal accidents locations in 2005
Fatal accidents locations in 2006
Fatal accidents locations in 2007
Fatal accidents locations in 2008
Fatal accidents locations in 2009
Fatal accidents locations in 2010
Fatal accidents locations in 2011
Fatal accidents locations in 2012
Fatal accidents locations in 2013
Fatal accidents locations in 2014
Fatal accidents locations in 2015
Fatal accidents locations in 2016
Fatal accidents locations in 2017
Fatal accidents locations in 2018
Fatal accidents locations in 2019
Fatal accidents locations in 2020
Fatal accidents locations in 2021
Alcohol use - People drinking some alcohol every month (%)
Alcohol use - People not drinking at all (%)
Alcohol use - Average days/month drinking alcohol
Alcohol use - Average drinks/week
Alcohol use - Average days/year people drink much
Audiometry - Average condition of hearing (%)
Audiometry - People that can hear a whisper from across a quiet room (%)
Audiometry - People that can hear normal voice from across a quiet room (%)
Audiometry - Ears ringing, roaring, buzzing (%)
Audiometry - Had a job exposure to loud noise (%)
Audiometry - Had off-work exposure to loud noise (%)
Blood Pressure & Cholesterol - Has high blood pressure (%)
Blood Pressure & Cholesterol - Checking blood pressure at home (%)
Blood Pressure & Cholesterol - Frequently checking blood cholesterol (%)
Blood Pressure & Cholesterol - Has high cholesterol level (%)
Consumer Behavior - Money monthly spent on food at supermarket/grocery store
Consumer Behavior - Money monthly spent on food at other stores
Consumer Behavior - Money monthly spent on eating out
Consumer Behavior - Money monthly spent on carryout/delivered foods
Consumer Behavior - Income spent on food at supermarket/grocery store (%)
Consumer Behavior - Income spent on food at other stores (%)
Consumer Behavior - Income spent on eating out (%)
Consumer Behavior - Income spent on carryout/delivered foods (%)
Current Health Status - General health condition (%)
Current Health Status - Blood donors (%)
Current Health Status - Has blood ever tested for HIV virus (%)
Current Health Status - Left-handed people (%)
Dermatology - People using sunscreen (%)
Diabetes - Diabetics (%)
Diabetes - Had a blood test for high blood sugar (%)
Diabetes - People taking insulin (%)
Diet Behavior & Nutrition - Diet health (%)
Diet Behavior & Nutrition - Milk product consumption (# of products/month)
Diet Behavior & Nutrition - Meals not home prepared (#/week)
Diet Behavior & Nutrition - Meals from fast food or pizza place (#/week)
Diet Behavior & Nutrition - Ready-to-eat foods (#/month)
Diet Behavior & Nutrition - Frozen meals/pizza (#/month)
Drug Use - People that ever used marijuana or hashish (%)
Drug Use - Ever used hard drugs (%)
Drug Use - Ever used any form of cocaine (%)
Drug Use - Ever used heroin (%)
Drug Use - Ever used methamphetamine (%)
Health Insurance - People covered by health insurance (%)
Kidney Conditions-Urology - Avg. # of times urinating at night
Medical Conditions - People with asthma (%)
Medical Conditions - People with anemia (%)
Medical Conditions - People with psoriasis (%)
Medical Conditions - People with overweight (%)
Medical Conditions - Elderly people having difficulties in thinking or remembering (%)
Medical Conditions - People who ever received blood transfusion (%)
Medical Conditions - People having trouble seeing even with glass/contacts (%)
Medical Conditions - People with arthritis (%)
Medical Conditions - People with gout (%)
Medical Conditions - People with congestive heart failure (%)
Medical Conditions - People with coronary heart disease (%)
Medical Conditions - People with angina pectoris (%)
Medical Conditions - People who ever had heart attack (%)
Medical Conditions - People who ever had stroke (%)
Medical Conditions - People with emphysema (%)
Medical Conditions - People with thyroid problem (%)
Medical Conditions - People with chronic bronchitis (%)
Medical Conditions - People with any liver condition (%)
Medical Conditions - People who ever had cancer or malignancy (%)
Mental Health - People who have little interest in doing things (%)
Mental Health - People feeling down, depressed, or hopeless (%)
Mental Health - People who have trouble sleeping or sleeping too much (%)
Mental Health - People feeling tired or having little energy (%)
Mental Health - People with poor appetite or overeating (%)
Mental Health - People feeling bad about themself (%)
Mental Health - People who have trouble concentrating on things (%)
Mental Health - People moving or speaking slowly or too fast (%)
Mental Health - People having thoughts they would be better off dead (%)
Oral Health - Average years since last visit a dentist
Oral Health - People embarrassed because of mouth (%)
Oral Health - People with gum disease (%)
Oral Health - General health of teeth and gums (%)
Oral Health - Average days a week using dental floss/device
Oral Health - Average days a week using mouthwash for dental problem
Oral Health - Average number of teeth
Pesticide Use - Households using pesticides to control insects (%)
Pesticide Use - Households using pesticides to kill weeds (%)
Physical Activity - People doing vigorous-intensity work activities (%)
Physical Activity - People doing moderate-intensity work activities (%)
Physical Activity - People walking or bicycling (%)
Physical Activity - People doing vigorous-intensity recreational activities (%)
Physical Activity - People doing moderate-intensity recreational activities (%)
Physical Activity - Average hours a day doing sedentary activities
Physical Activity - Average hours a day watching TV or videos
Physical Activity - Average hours a day using computer
Physical Functioning - People having limitations keeping them from working (%)
Physical Functioning - People limited in amount of work they can do (%)
Physical Functioning - People that need special equipment to walk (%)
Physical Functioning - People experiencing confusion/memory problems (%)
Physical Functioning - People requiring special healthcare equipment (%)
Prescription Medications - Average number of prescription medicines taking
Preventive Aspirin Use - Adults 40+ taking low-dose aspirin (%)
Reproductive Health - Vaginal deliveries (%)
Reproductive Health - Cesarean deliveries (%)
Reproductive Health - Deliveries resulted in a live birth (%)
Reproductive Health - Pregnancies resulted in a delivery (%)
Reproductive Health - Women breastfeeding newborns (%)
Reproductive Health - Women that had a hysterectomy (%)
Reproductive Health - Women that had both ovaries removed (%)
Reproductive Health - Women that have ever taken birth control pills (%)
Reproductive Health - Women taking birth control pills (%)
Reproductive Health - Women that have ever used Depo-Provera or injectables (%)
Reproductive Health - Women that have ever used female hormones (%)
Sexual Behavior - People 18+ that ever had sex (vaginal, anal, or oral) (%)
Sexual Behavior - Males 18+ that ever had vaginal sex with a woman (%)
Sexual Behavior - Males 18+ that ever performed oral sex on a woman (%)
Sexual Behavior - Males 18+ that ever had anal sex with a woman (%)
Sexual Behavior - Males 18+ that ever had any sex with a man (%)
Sexual Behavior - Females 18+ that ever had vaginal sex with a man (%)
Sexual Behavior - Females 18+ that ever performed oral sex on a man (%)
Sexual Behavior - Females 18+ that ever had anal sex with a man (%)
Sexual Behavior - Females 18+ that ever had any kind of sex with a woman (%)
Sexual Behavior - Average age people first had sex
Sexual Behavior - Average number of female sex partners in lifetime (males 18+)
Sexual Behavior - Average number of female vaginal sex partners in lifetime (males 18+)
Sexual Behavior - Average age people first performed oral sex on a woman (18+)
Sexual Behavior - Average number of woman performed oral sex on in lifetime (18+)
Sexual Behavior - Average number of male sex partners in lifetime (males 18+)
Sexual Behavior - Average number of male anal sex partners in lifetime (males 18+)
Sexual Behavior - Average age people first performed oral sex on a man (18+)
Sexual Behavior - Average number of male oral sex partners in lifetime (18+)
Sexual Behavior - People using protection when performing oral sex (%)
Sexual Behavior - Average number of times people have vaginal or anal sex a year
Sexual Behavior - People having sex without condom (%)
Sexual Behavior - Average number of male sex partners in lifetime (females 18+)
Sexual Behavior - Average number of male vaginal sex partners in lifetime (females 18+)
Sexual Behavior - Average number of female sex partners in lifetime (females 18+)
Sexual Behavior - Circumcised males 18+ (%)
Sleep Disorders - Average hours sleeping at night
Sleep Disorders - People that has trouble sleeping (%)
Smoking-Cigarette Use - People smoking cigarettes (%)
Taste & Smell - People 40+ having problems with smell (%)
Taste & Smell - People 40+ having problems with taste (%)
Taste & Smell - People 40+ that ever had wisdom teeth removed (%)
Taste & Smell - People 40+ that ever had tonsils teeth removed (%)
Taste & Smell - People 40+ that ever had a loss of consciousness because of a head injury (%)
Taste & Smell - People 40+ that ever had a broken nose or other serious injury to face or skull (%)
Taste & Smell - People 40+ that ever had two or more sinus infections (%)
Weight - Average height (inches)
Weight - Average weight (pounds)
Weight - Average BMI
Weight - People that are obese (%)
Weight - People that ever were obese (%)
Weight - People trying to lose weight (%)
Officers per 1,000 residents here:
3.19New Jersey average:
3.60
Latest news from Newfield, NJ collected exclusively by city-data.com from local newspapers, TV, and radio stations
Ancestries: Italian (37.1%), German (14.0%), American (9.4%), Irish (7.6%), English (6.2%), Scotch-Irish (1.4%).
Current Local Time:
Land area: 1.70 square miles.
Population density: 1,055 people per square mile (low).
33 residents are foreign born
This borough:
1.8%New Jersey:
23.2%
Median real estate property taxes paid for housing units with mortgages in 2022: $6,909 (2.6%)Median real estate property taxes paid for housing units with no mortgage in 2022: $6,210 (2.5%)
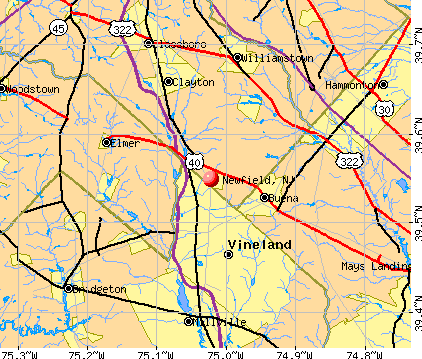
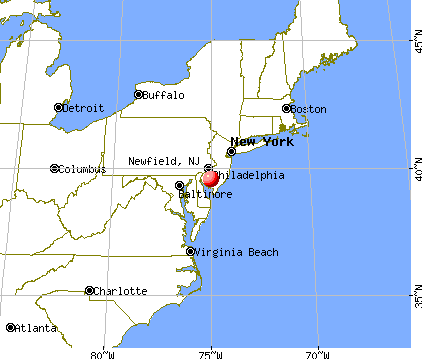
Nearest city with pop. 50,000+: Vineland, NJ
Nearest city with pop. 200,000+: Philadelphia, PA
Nearest cities:
Latitude: 39.55 N, Longitude: 75.02 W
Area code commonly used in this area: 856
Unemployment in December 2023:
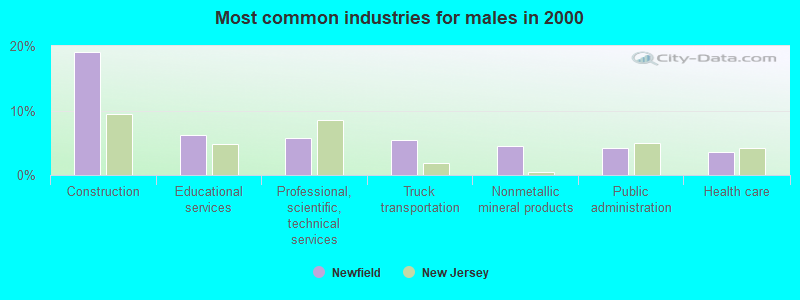
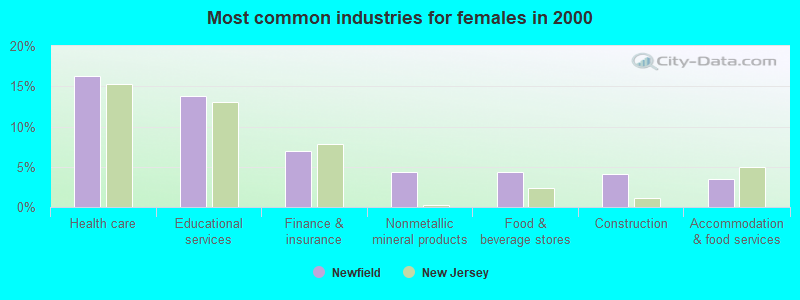
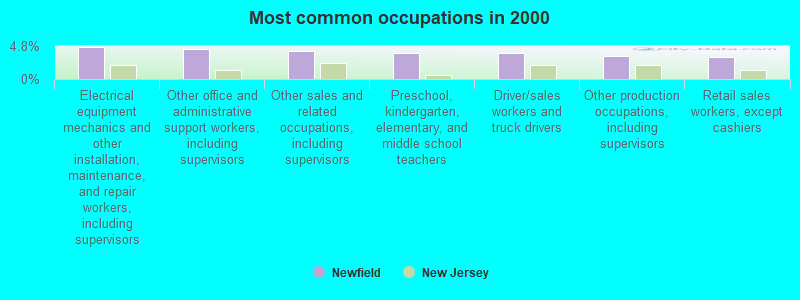
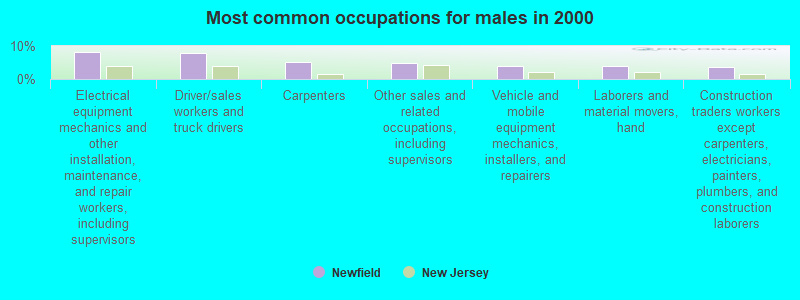
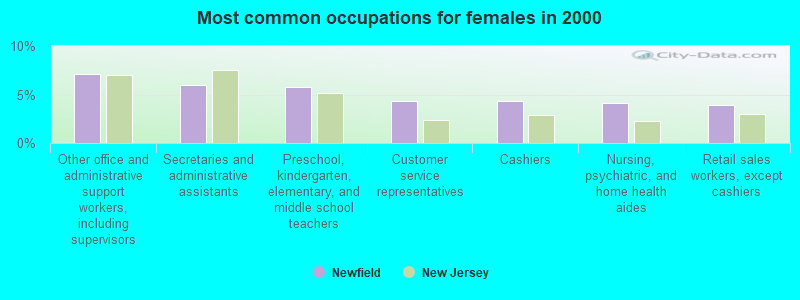
Most common occupations in Newfield, NJ (%)
Both Males Females
Electrical equipment mechanics and other installation, maintenance, and repair workers, including supervisors (4.7%)
Other office and administrative support workers, including supervisors (4.3%)
Other sales and related occupations, including supervisors (4.1%)
Preschool, kindergarten, elementary, and middle school teachers (3.7%)
Driver/sales workers and truck drivers (3.7%)
Other production occupations, including supervisors (3.4%)
Retail sales workers, except cashiers (3.2%)
Electrical equipment mechanics and other installation, maintenance, and repair workers, including supervisors (8.2%)
Driver/sales workers and truck drivers (7.8%)
Carpenters (5.2%)
Other sales and related occupations, including supervisors (4.8%)
Vehicle and mobile equipment mechanics, installers, and repairers (4.0%)
Laborers and material movers, hand (4.0%)
Construction traders workers except carpenters, electricians, painters, plumbers, and construction laborers (3.8%)
Other office and administrative support workers, including supervisors (7.1%)
Secretaries and administrative assistants (6.0%)
Preschool, kindergarten, elementary, and middle school teachers (5.7%)
Customer service representatives (4.4%)
Cashiers (4.4%)
Nursing, psychiatric, and home health aides (4.1%)
Retail sales workers, except cashiers (3.9%)
Tornado activity:
Newfield-area historical tornado activity is near New Jersey state average. It is 25% smaller than the overall U.S. average.
On 4/28/1961, a category F3 (max. wind speeds 158-206 mph) tornado 30.4 miles away from the Newfield borough center caused between $5000 and $50,000 in damages.
On 5/10/1990, a category F2 (max. wind speeds 113-157 mph) tornado 4.8 miles away from the borough center caused between $50,000 and $500,000 in damages.
Earthquake activity:
Newfield-area historical earthquake activity is significantly above New Jersey state average. It is 66% smaller than the overall U.S. average. On 8/23/2011 at 17:51:04, a magnitude 5.8 (5.8 MW, Depth: 3.7 mi, Class: Moderate, Intensity: VI - VII) earthquake occurred 193.8 miles away from the city center On 1/16/1994 at 01:49:16, a magnitude 4.6 (4.6 MB, 4.6 LG, Depth: 3.1 mi, Class: Light, Intensity: IV - V) earthquake occurred 76.3 miles away from the city center On 11/30/2017 at 21:47:31, a magnitude 4.1 (4.1 MW, Depth: 6.1 mi) earthquake occurred 32.7 miles away from the city center On 1/16/1994 at 00:42:43, a magnitude 4.2 (4.2 MB, 4.0 LG, Depth: 3.1 mi) earthquake occurred 75.0 miles away from the city center On 10/7/1983 at 10:18:46, a magnitude 5.3 (5.1 MB, 5.3 LG, 5.1 ML) earthquake occurred 306.6 miles away from Newfield center On 1/15/2019 at 23:30:48, a magnitude 4.6 (4.6 MW, Depth: 6.2 mi) earthquake occurred 193.9 miles away from the city center Magnitude types: regional Lg-wave magnitude (LG), body-wave magnitude (MB), local magnitude (ML), moment magnitude (MW) Natural disasters: The number of natural disasters in Gloucester County (24) is greater than the US average (15).Major Disasters (Presidential) Declared: 15Emergencies Declared: 9Hurricanes: 6, Floods: 5, Storms: 5, Snowstorms: 3, Blizzards: 2, Heavy Rains: 2, Water Shortages: 2, Tornado: 1, Tropical Storm: 1, Wind: 1, Winter Storm: 1, Other: 3 (Note: some incidents may be assigned to more than one category). Hospitals and medical centers in Newfield: MATER DEI NH (176 ROUTE 40)
MATER DEI NURSING HOME (176 ROUTE 40)
Other hospitals and medical centers near Newfield: NEW JERSEY VETERANS MEMORIAL VINELAND (Nursing Home, about 4 miles away; VINELAND, NJ)
VINELAND DEVELOPMENTAL CENTER/HOSPITAL (Hospital, about 5 miles away; VINELAND, NJ)
VINELAND DEVELOPMENTAL CTR (Hospital, about 5 miles away; VINELAND, NJ)
NEWCOMB MEDICAL CENTER (Hospital, about 5 miles away; VINELAND, NJ)
BISHOP MCCARTHY RESIDENCE (Nursing Home, about 5 miles away; VINELAND, NJ)
US RENAL CARE VINELAND DIALYSIS (Dialysis Facility, about 6 miles away; VINELAND, NJ)
BAYADA NURSES, INC (Home Health Center, about 6 miles away; SOUTH VINELAND, NJ)
Colleges/universities with over 2000 students nearest to Newfield:
Cumberland County College (about 8 miles; Vineland, NJ ; Full-time enrollment: 2,898)
Rowan University (about 13 miles; Glassboro, NJ ; FT enrollment: 10,632)
Camden County College (about 17 miles; Blackwood, NJ ; FT enrollment: 9,901)
Gloucester County College (about 18 miles; Sewell, NJ ; FT enrollment: 5,490)
Atlantic Cape Community College (about 20 miles; Mays Landing, NJ ; FT enrollment: 5,392)
The Richard Stockton College of New Jersey (about 27 miles; Galloway, NJ ; FT enrollment: 8,360)
Widener University-Main Campus (about 29 miles; Chester, PA ; FT enrollment: 4,051)
Private high school in Newfield: OUR LADY OF MERCY ACADEMY Students: 148, Location: 1001 MAIN RD, Grades: 9-12, Girls only )
Public elementary/middle school in Newfield:
Private elementary/middle school in Newfield: NOTRE DAME REGIONAL SCHOOL Students: 256, Location: 108 CHURCH ST, Grades: PK-8)
See full list of schools located in Newfield Library in Newfield: NEWFIELD PUBLIC LIBRARY Operating income: $37,146; Location: 115 CATAWBA AVENUE; 22,052 books ; 196 audio materials ; 564 video materials ; 27 local licensed databases ; 22 state licensed databases ; 25 print serial subscriptions )
Gloucester County has a predicted average indoor radon screening level between 2 and 4 pCi/L (pico curies per liter) - Moderate Potential Drinking water stations with addresses in Newfield and their reported violations in the past:
WHITE OAKS COUNTRY CLUB (Population served: 90, Groundwater):
Past monitoring violations:
One routine major monitoring violation
Population served: 80, Groundwater):
Past health violations:
MCL, Average - Between APR-2008 and JUN-2008, Contaminant: Nitrate. Follow-up actions: St Public Notif received (MAY-28-2008), St Public Notif requested (JUN-03-2008), St Formal NOV issued (JUN-03-2008), St Compliance achieved (APR-28-2010)
MCL, Average - Between JAN-2008 and DEC-2008, Contaminant: Nitrate. Follow-up actions: St Compliance achieved (APR-28-2008), St Formal NOV issued (MAY-09-2008), St Public Notif requested (MAY-09-2008), St Public Notif received (MAY-28-2008)
MCL, Single Sample - Between JAN-2006 and MAR-2006, Contaminant: Nitrate. Follow-up actions: St Compliance achieved (MAR-17-2006), St Formal NOV issued (APR-07-2006), St Public Notif requested (APR-07-2006)
MCL, Single Sample - Between JUL-2005 and SEP-2005, Contaminant: Nitrate. Follow-up actions: St Compliance achieved (OCT-05-2005)
Past monitoring violations:
One minor monitoring violation
Average household size: This borough:
2.7 peopleNew Jersey:
2.7 people
Percentage of family households: This borough:
78.2%Whole state:
69.3%
Percentage of households with unmarried partners: This borough:
4.8%Whole state:
5.9%
Likely homosexual households (counted as self-reported same-sex unmarried-partner households)
Lesbian couples: 0.2% of all households Gay men: 0.2% of all households
2 people in other nonhousehold living situations in 2000
Banks with branches in Newfield (2011 data):
Newfield National Bank: at 18-24 West Boulevard, branch established on 1934/01/01. Info updated 2010/05/12: Bank assets: $514.4 mil, Deposits: $462.8 mil, local headquarters , positive income , Commercial Lending Specialization, 12 total offices , Holding Company: Newfield Bancorp, Inc.
For population 15 years and over in Newfield:
Never married: 31.0%Now married: 53.7%Separated: 1.9%Widowed: 3.4%Divorced: 10.0% For population 25 years and over in Newfield:
High school or higher: 94.7%Bachelor's degree or higher: 35.0%Graduate or professional degree: 14.2%Unemployed: 4.8%Mean travel time to work (commute): 26.1 minutes
Education Gini index (Inequality in education) Here:
9.1New Jersey average:
12.8
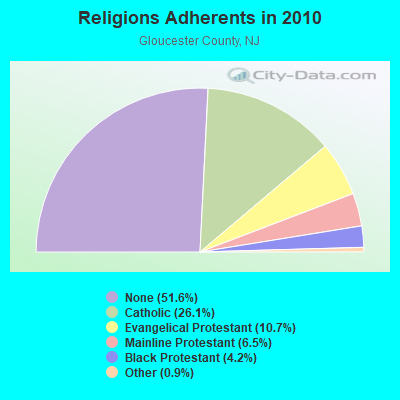
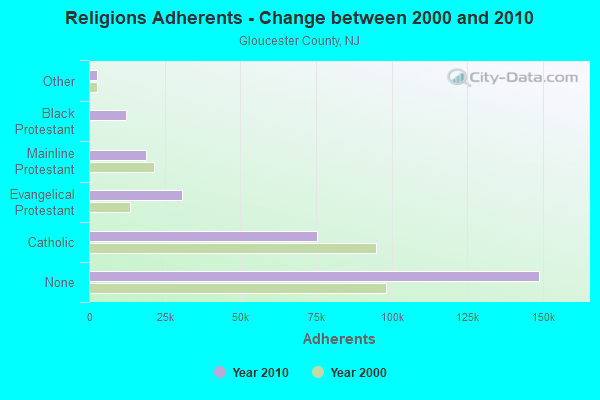
Religion statistics for Newfield, NJ (based on Gloucester County data)
Religion Adherents Congregations Catholic 75,218 21 Evangelical Protestant 30,715 83 Mainline Protestant 18,855 84 Black Protestant 12,099 16 Other 2,511 12 None 148,890 -
Source: Clifford Grammich, Kirk Hadaway, Richard Houseal, Dale E.Jones, Alexei Krindatch, Richie Stanley and Richard H.Taylor. 2012. 2010 U.S.Religion Census: Religious Congregations & Membership Study. Association of Statisticians of American Religious Bodies. Jones, Dale E., et al. 2002. Congregations and Membership in the United States 2000. Nashville, TN: Glenmary Research Center. Graphs represent county-level data
Food Environment Statistics: Number of grocery stores : 53Gloucester County :
1.86 / 10,000 pop.New Jersey :
2.90 / 10,000 pop.
Number of supercenters and club stores : 3Gloucester County :
0.11 / 10,000 pop.State :
0.06 / 10,000 pop.
Number of convenience stores (no gas) : 72Gloucester County :
2.52 / 10,000 pop.New Jersey :
1.76 / 10,000 pop.
Number of convenience stores (with gas) : 27This county :
0.95 / 10,000 pop.New Jersey :
0.81 / 10,000 pop.
Number of full-service restaurants : 131This county :
4.59 / 10,000 pop.New Jersey :
7.15 / 10,000 pop.
Adult diabetes rate : Gloucester County :
9.8%New Jersey :
8.3%
Adult obesity rate : Gloucester County :
24.9%New Jersey :
23.3%
Low-income preschool obesity rate : Here :
14.9%New Jersey :
18.0%
Health and Nutrition: Healthy diet rate : Newfield:
51.0%State:
50.6%
Average overall health of teeth and gums : Newfield:
48.5%State:
48.5%
Average BMI : Newfield:
28.6New Jersey:
28.5
People feeling badly about themselves : Newfield:
21.8%State:
20.0%
People not drinking alcohol at all : Newfield:
10.0%New Jersey:
11.1%
Average hours sleeping at night : This city:
6.9New Jersey:
6.8
Overweight people : This city:
34.2%New Jersey:
33.6%
General health condition : Newfield:
57.7%State:
56.9%
Average condition of hearing : Newfield:
78.2%New Jersey:
80.0%
More about Health and Nutrition of Newfield, NJ Residents
Local government employment and payroll (March 2022)
Function
Full-time employees
Monthly full-time payroll
Average yearly full-time wage
Part-time employees
Monthly part-time payroll
Police Protection - Officers
5 $24,866 $59,678 1 $1,860 Streets and Highways
2 $8,594 $51,564 1 $1,780 Other Government Administration
2 $10,704 $64,224 3 $1,774 Financial Administration
0 $0 4 $3,689 Water Supply
0 $0 4 $4,017 Other and Unallocable
0 $0 6 $2,691
Totals for Government
9 $44,164 $58,885 19 $15,811
Newfield government finances - Expenditure in 2021 (per resident):
Construction - Regular Highways: $88,000 ($49.08)
Current Operations - Water Utilities: $387,000 ($215.84)
General - Other: $278,000 ($155.05)Regular Highways: $168,000 ($93.70)Central Staff Services: $95,000 ($52.98)Solid Waste Management: $76,000 ($42.39)General Public Buildings: $58,000 ($32.35)Financial Administration: $42,000 ($23.42)Judicial and Legal Services: $24,000 ($13.39)Libraries: $22,000 ($12.27)Local Fire Protection: $7,000 ($3.90)General - Interest on Debt: $16,000 ($8.92)
Intergovernmental to Local - Other - Police Protection: $465,000 ($259.34)
Other Capital Outlay - Water Utilities: $276,000 ($153.93)
Local Fire Protection: $8,000 ($4.46)Total Salaries and Wages: $362,000 ($201.90)
Water Utilities - Interest on Debt: $14,000 ($7.81)
Newfield government finances - Revenue in 2021 (per resident):
Charges - Other: $146,000 ($81.43)
Local Intergovernmental - General Local Government Support: $130,000 ($72.50)
Other: $13,000 ($7.25)Miscellaneous - General Revenue - Other: $46,000 ($25.66)
Rents: $19,000 ($10.60)Fines and Forfeits: $13,000 ($7.25)Sale of Property: $8,000 ($4.46)Interest Earnings: $7,000 ($3.90)Revenue - Water Utilities: $483,000 ($269.38)
Tax - Property: $1,331,000 ($742.33)
Alcoholic Beverage License: $1,000 ($0.56)
Newfield government finances - Debt in 2021 (per resident):
Long Term Debt - Beginning Outstanding - Unspecified Public Purpose: $444,000 ($247.63)
Outstanding Unspecified Public Purpose: $415,000 ($231.46)Retired Unspecified Public Purpose: $29,000 ($16.17)
Newfield government finances - Cash and Securities in 2021 (per resident):
Other Funds - Cash and Securities: $1,487,000 ($829.34)
6.21% of this county's 2020 resident taxpayers moved to other counties in 2021 ($73,670 average adjusted gross income )
Here:
6.21%New Jersey average:
7.02%
0.02% of residents moved to foreign countries ($171 average AGI )Gloucester County:
0.02%New Jersey average:
0.02%
Top counties to which taxpayers relocated from this county between 2020 and 2021: Businesses in Newfield, NJ
Decora Cabinetry: 2MasterBrand Cabinets: 7U-Haul: 1 Strongest AM radio stations in Newfield:
WNJC (1360 AM; 5 kW; VINELAND, NJ; Owner: FORSYTHE BROADCASTING, INC.)
WVCH (740 AM; 50 kW; CHESTER, PA; Owner: WVCH COMMUNICATIONS, INC.)
WPEN (950 AM; 50 kW; PHILADELPHIA, PA; Owner: GREATER PHILADELPHIA RADIO, INC.)
WPHT (1210 AM; 50 kW; PHILADELPHIA, PA; Owner: INFINITY BROADCASTING OPERATIONS, INC.)
WZZD (990 AM; 50 kW; PHILADELPHIA, PA; Owner: PENNSYLVANIA MEDIA ASSOCIATES, INC.)
KYW (1060 AM; 50 kW; PHILADELPHIA, PA; Owner: INFINITY BROADCASTING OPERATIONS, INC.)
WNWR (1540 AM; 50 kW; PHILADELPHIA, PA)
WWJZ (640 AM; 50 kW; MOUNT HOLLY, NJ; Owner: ABC, INC.)
WIP (610 AM; 5 kW; PHILADELPHIA, PA; Owner: INFINITY BROADCASTING CORPORATION OF PHILADELPHIA)
WMIZ (1270 AM; 0 kW; VINELAND, NJ; Owner: CLEAR COMMUNICATIONS, INC.)
WTMR (800 AM; 5 kW; CAMDEN, NJ; Owner: WTMR LICENSE LIMITED PARTNERSHIP)
WMVB (1440 AM; 1 kW; MILLVILLE, NJ; Owner: QUINN BROADCASTING, INCORPORATED)
WMCA (570 AM; 50 kW; NEW YORK, NY; Owner: SALEM MEDIA OF NEW YORK, LLC)
Strongest FM radio stations in Newfield:
WVLT (92.1 FM; VINELAND, NJ; Owner: CLEAR COMMUNICATIONS, INC.)
WNJS-FM (88.1 FM; BERLIN, NJ; Owner: NEW JERSEY PUBLIC BROADCASTING AUTHORITY)
WSNJ-FM (107.7 FM; BRIDGETON, NJ; Owner: COHANZICK BROADCASTING CORPORATION)
WGLS-FM (89.7 FM; GLASSBORO, NJ; Owner: ROWAN UNIVERSITY)
WNJB-FM (89.3 FM; BRIDGETON, NJ; Owner: NJ PUBLIC BROADCASTING AUTHORITY)
WMMR (93.3 FM; PHILADELPHIA, PA; Owner: GREATER BOSTON RADIO, INC.)
WMGK (102.9 FM; PHILADELPHIA, PA; Owner: GREATER PHILADELPHIA RADIO, INC.)
WMWX (95.7 FM; PHILADELPHIA, PA; Owner: GREATER PHILADELPHIA RADIO, INC.)
WPLY (100.3 FM; MEDIA, PA; Owner: RADIO ONE LICENSES, LLC)
WOGL (98.1 FM; PHILADELPHIA, PA; Owner: INFINITY BROADCASTING OPERATIONS, INC.)
WOJZ (104.9 FM; EGG HARBOR CITY, NJ; Owner: MEGA COMMUNICATIONS OF EGG HARBOR LICENSEE, L.L.C.)
WIXM (97.3 FM; MILLVILLE, NJ; Owner: MILLENNIUM ATLANTIC CITY II LICENSE HOLDCO, LLC)
WBEB (101.1 FM; PHILADELPHIA, PA; Owner: WEAZ-FM RADIO, INC.)
WRTI (90.1 FM; PHILADELPHIA, PA; Owner: TEMPLE UNIV. OF THE COMMONWEALTH, ET)
WSNI-FM (104.5 FM; PHILADELPHIA, PA; Owner: AMFM RADIO LICENSES, L.L.C.)
WPHI-FM (103.9 FM; JENKINTOWN, PA; Owner: RADIO ONE LICENSES, LLC)
WHYY-FM (90.9 FM; PHILADELPHIA, PA; Owner: WHYY, INC.)
WXTU (92.5 FM; PHILADELPHIA, PA; Owner: WXTU LICENSE LIMITED PARTNERSHIP)
WXPN (88.5 FM; PHILADELPHIA, PA; Owner: TRUSTEES OF THE UNIVERSITY OF PENNA.)
WKDN (106.9 FM; CAMDEN, NJ; Owner: FAMILY STATIONS, INC.)
TV broadcast stations around Newfield:
WMCN-TV (Channel 53; ATLANTIC CITY, NJ; Owner: LENFEST BROADCASTING, LLC)
WUVP (Channel 65; VINELAND, NJ; Owner: UNIVISION PHILADELPHIA LLC)
WNJS (Channel 23; CAMDEN, NJ; Owner: NEW JERSEY PUBLIC BROADCASTING AUTHORITY)
WPSJ-LP (Channel 8; HAMMONTON, ETC., NJ; Owner: ENGLE BROADCASTING)
KYW-TV (Channel 3; PHILADELPHIA, PA; Owner: CBS BROADCASTING INC.)
WWJT-LP (Channel 7; PHILADELPHIA, PA; Owner: PHILADELPHIA TELEVISION NETWORK, INC)
WPHL-TV (Channel 17; PHILADELPHIA, PA; Owner: TRIBUNE TELEVISION COMPANY)
WPVI-TV (Channel 6; PHILADELPHIA, PA; Owner: ABC, INC.)
WPSG (Channel 57; PHILADELPHIA, PA; Owner: VIACOM STATIONS GROUP OF PHILADELPHIA INC.)
WPPX (Channel 61; WILMINGTON, DE; Owner: PAXSON PHILADELPHIA LICENSE, INC.)
WCAU (Channel 10; PHILADELPHIA, PA; Owner: NBC SUBSIDIARY (WCAU-TV), L.P.)
WTSD-CA (Channel 14; WILMINGTON, DE; Owner: PRIORITY COMMUNICATIONS MINISTRIES, INC.)
WGTW (Channel 48; BURLINGTON, NJ; Owner: BRUNSON COMMUNICATIONS, INC.)
WYBE (Channel 35; PHILADELPHIA, PA; Owner: INDEPENDENCE PUBLIC MEDIA OF PHILADELPHIA, INC.)
WWSI (Channel 62; ATLANTIC CITY, NJ; Owner: HISPANIC BROADCASTERS OF PHILADELPHIA, L.L.C.)
WHYY-TV (Channel 12; WILMINGTON, DE; Owner: WHYY, INC.)
WTXF-TV (Channel 29; PHILADELPHIA, PA; Owner: FOX TV STATIONS OF PHILADELPHIA)
WELL-LP (Channel 8; WILLOW GROVE, ETC., PA; Owner: WORD OF GOD FELLOWSHIP, INC.)
Newfield fatal accident list:
Apr 25, 1996 06:24 AM, Weymouth, Vehicles: 1, Persons: 1, Fatalities: 1
FCC Registered Cell Phone Towers: 1 (
See the full list of FCC Registered Cell Phone Towers in Newfield )
FCC Registered Antenna Towers: 17 (
See the full list of FCC Registered Antenna Towers )
FCC Registered Commercial Land Mobile Towers: 1
Lat: 39.553778 Lon: -75.050361, Call Sign: WQOD992, Assigned Frequencies: 54.0000 MHz, 174.000 MHz, 470.000 MHz, 494.000 MHz, 653.000 MHz, Grant Date: 08/26/2011, Expiration Date: 06/01/2023, Certifier: Jeff R Staigh, Registrant: Covington & Burling LLP, One Citycenter, 850 Tenth Street, Nw, Washington, DC 20001, Phone: (202) 662-5543, Fax: (202) 778-5543, Email:
FCC Registered Broadcast Land Mobile Towers: 1
WELL 5, 2 Woodlawn Ave (Lat: 39.546389 Lon: -75.007778), Type: Bant, Structure height: 5 m, Overall height: 6.1 m, Call Sign: WRCC498, Assigned Frequencies: 152.990 MHz, Grant Date: 08/24/2018, Expiration Date: 08/24/2028, Certifier: Sam Barbagli, Registrant: Cara Enterprises, Inc, Las Vegas, NV 89140-0124, Phone: (702) 838-9728, Fax: (702) 363-4607, Email:
FCC Registered Microwave Towers: 2
PLAINVILLE, 90 Dutch Mill Road (Lat: 39.575389 Lon: -75.013056), Type: Mast, Structure height: 55.2 m, Overall height: 57.9 m, Call Sign: WPOR677, Assigned Frequencies: 6345.49 MHz, 6256.54 MHz, Grant Date: 02/10/2009, Expiration Date: 03/08/2019, Cancellation Date: 01/21/2015, Certifier: Carol L Tacker, Registrant: At&t Mobility LLC, 1120 20th Street, Nw - Suite 1000, Washington, DC 20036, Phone: (202) 457-2055, Fax: (202) 457-3073, Email:
Malaga, Marshall Mill Rd- Rear (Lat: 39.585056 Lon: -75.045667), Type: Gtower, Structure height: 91.4 m, Overall height: 100.6 m, Call Sign: WQVQ356, Assigned Frequencies: 6315.84 MHz, 6256.54 MHz, Grant Date: 04/14/2015, Expiration Date: 04/14/2025, Certifier: J. Thomas Butts, Registrant: Gloucester County Emergency Response Center, 1200 N. Delsea Dr., Clayton, NJ 08312, Phone: (856) 307-7100, Fax: (856) 863-5839, Email:
FCC Registered Paging Towers: 1
5.5 Km N Of Vineland (Lat: 39.543167 Lon: -75.023500), Overall height: 30.5 m, Call Sign: KTS240, Assigned Frequencies: 152.180 MHz, Grant Date: 04/12/1999, Expiration Date: 04/01/2009, Cancellation Date: 01/08/2009, Registrant: Gurman, Blask And Freedman, 1400 Sixteenth St., N.W., Suite 500, Washington, DC 20036, Phone: (202) 328-8200, Fax: (202) 462-1784, Email:
FCC Registered Amateur Radio Licenses: 26 (
See the full list of FCC Registered Amateur Radio Licenses in Newfield )
FAA Registered Aircraft: 2
Aircraft: PIPER PA-22-108 (Category: Land, Seats: 2, Weight: Up to 12,499 Pounds, Speed: 94 mph), Engine: LYCOMING 0-235 SERIES (115 HP) (Reciprocating)N-Number: 5717Z, N5717Z, N-5717Z, Serial Number: 22-9556, Year manufactured: 1963, Airworthiness Date: 02/15/1963, Certificate Issue Date: 10/01/2019Registrant (Individual): Charles W C Jr Johnston, 919 Piney Hollow Rd, Newfield, NJ 08344Aircraft: PIPER PA-28R-200 (Category: Land, Seats: 4, Weight: Up to 12,499 Pounds, Speed: 107 mph), Engine: LYCOMING I0360 SER (180 HP) (Reciprocating)N-Number: 65CN, N65CN, N-65CN, Serial Number: 28R-35111, Airworthiness Date: 03/14/1969, Certificate Issue Date: 04/11/2019Registrant (Individual): Charles Wc Jr Johnston, 919 Piney Hollow Rd, Newfield, NJ 08344
Home Mortgage Disclosure Act Aggregated Statistics For Year 2009(Based on 1 full tract) A) FHA, FSA/RHS & VA B) Conventional C) Refinancings D) Home Improvement Loans E) Loans on Dwellings For 5+ Families F) Non-occupant Loans on Number Average Value Number Average Value Number Average Value Number Average Value Number Average Value Number Average Value
LOANS ORIGINATED 3 $151,333 8 $131,125 35 $151,514 8 $22,125 1 $744,000 3 $85,333 APPLICATIONS APPROVED, NOT ACCEPTED 2 $150,000 0 $0 2 $128,000 1 $5,000 0 $0 0 $0 APPLICATIONS DENIED 1 $274,000 1 $48,000 13 $154,154 6 $20,333 0 $0 0 $0 APPLICATIONS WITHDRAWN 1 $177,000 0 $0 16 $150,250 1 $60,000 0 $0 0 $0 FILES CLOSED FOR INCOMPLETENESS 0 $0 0 $0 2 $162,500 0 $0 0 $0 0 $0
Aggregated Statistics For Year 2008(Based on 1 full tract) A) FHA, FSA/RHS & VA B) Conventional C) Refinancings D) Home Improvement Loans F) Non-occupant Loans on Number Average Value Number Average Value Number Average Value Number Average Value Number Average Value
LOANS ORIGINATED 6 $176,333 4 $174,750 36 $132,444 10 $33,300 2 $137,500 APPLICATIONS APPROVED, NOT ACCEPTED 1 $131,000 2 $161,000 3 $165,667 2 $48,000 0 $0 APPLICATIONS DENIED 0 $0 2 $129,000 27 $164,259 7 $33,714 0 $0 APPLICATIONS WITHDRAWN 2 $166,500 1 $153,000 10 $137,300 2 $135,000 0 $0 FILES CLOSED FOR INCOMPLETENESS 1 $58,000 0 $0 0 $0 0 $0 0 $0
Aggregated Statistics For Year 2007(Based on 1 full tract) A) FHA, FSA/RHS & VA B) Conventional C) Refinancings D) Home Improvement Loans E) Loans on Dwellings For 5+ Families F) Non-occupant Loans on Number Average Value Number Average Value Number Average Value Number Average Value Number Average Value Number Average Value
LOANS ORIGINATED 2 $160,000 18 $170,000 36 $137,028 18 $52,611 0 $0 5 $145,400 APPLICATIONS APPROVED, NOT ACCEPTED 0 $0 1 $176,000 4 $153,500 0 $0 0 $0 1 $176,000 APPLICATIONS DENIED 0 $0 6 $244,667 25 $144,240 17 $67,588 0 $0 4 $92,500 APPLICATIONS WITHDRAWN 0 $0 5 $124,000 18 $129,500 4 $108,500 1 $450,000 2 $157,000 FILES CLOSED FOR INCOMPLETENESS 0 $0 1 $154,000 3 $174,000 0 $0 0 $0 0 $0
Aggregated Statistics For Year 2006(Based on 1 full tract) A) FHA, FSA/RHS & VA B) Conventional C) Refinancings D) Home Improvement Loans F) Non-occupant Loans on Number Average Value Number Average Value Number Average Value Number Average Value Number Average Value
LOANS ORIGINATED 4 $168,000 15 $139,000 49 $135,000 22 $54,864 4 $169,500 APPLICATIONS APPROVED, NOT ACCEPTED 0 $0 3 $136,333 4 $203,500 1 $6,000 0 $0 APPLICATIONS DENIED 0 $0 2 $139,000 21 $150,048 12 $29,667 1 $148,000 APPLICATIONS WITHDRAWN 0 $0 10 $148,000 21 $138,000 1 $73,000 0 $0 FILES CLOSED FOR INCOMPLETENESS 0 $0 0 $0 3 $139,333 0 $0 0 $0
Aggregated Statistics For Year 2005(Based on 1 full tract) A) FHA, FSA/RHS & VA B) Conventional C) Refinancings D) Home Improvement Loans E) Loans on Dwellings For 5+ Families F) Non-occupant Loans on G) Loans On Manufactured Number Average Value Number Average Value Number Average Value Number Average Value Number Average Value Number Average Value Number Average Value
LOANS ORIGINATED 0 $0 28 $134,000 60 $133,583 17 $41,824 1 $485,000 6 $114,667 0 $0 APPLICATIONS APPROVED, NOT ACCEPTED 1 $167,000 2 $174,500 12 $107,667 1 $30,000 0 $0 1 $159,000 0 $0 APPLICATIONS DENIED 0 $0 3 $76,667 18 $108,278 9 $57,222 0 $0 0 $0 1 $77,000 APPLICATIONS WITHDRAWN 0 $0 4 $169,000 36 $128,111 1 $323,000 0 $0 1 $131,000 0 $0 FILES CLOSED FOR INCOMPLETENESS 0 $0 0 $0 5 $160,400 0 $0 0 $0 0 $0 0 $0
Aggregated Statistics For Year 2004(Based on 1 full tract) A) FHA, FSA/RHS & VA B) Conventional C) Refinancings D) Home Improvement Loans F) Non-occupant Loans on G) Loans On Manufactured Number Average Value Number Average Value Number Average Value Number Average Value Number Average Value Number Average Value
LOANS ORIGINATED 6 $146,500 25 $139,040 58 $108,052 23 $19,739 6 $159,833 1 $31,000 APPLICATIONS APPROVED, NOT ACCEPTED 0 $0 0 $0 5 $100,600 0 $0 0 $0 0 $0 APPLICATIONS DENIED 0 $0 3 $127,000 23 $110,739 12 $50,500 0 $0 0 $0 APPLICATIONS WITHDRAWN 0 $0 3 $122,667 20 $132,450 2 $39,500 1 $204,000 0 $0 FILES CLOSED FOR INCOMPLETENESS 0 $0 0 $0 5 $117,600 2 $12,500 0 $0 0 $0
Aggregated Statistics For Year 2003(Based on 1 full tract) A) FHA, FSA/RHS & VA B) Conventional C) Refinancings D) Home Improvement Loans F) Non-occupant Loans on Number Average Value Number Average Value Number Average Value Number Average Value Number Average Value
LOANS ORIGINATED 4 $131,250 15 $104,333 77 $106,156 12 $18,417 0 $0 APPLICATIONS APPROVED, NOT ACCEPTED 0 $0 1 $189,000 14 $90,929 0 $0 0 $0 APPLICATIONS DENIED 0 $0 1 $133,000 25 $113,520 7 $16,000 2 $137,500 APPLICATIONS WITHDRAWN 0 $0 0 $0 20 $90,950 0 $0 1 $85,000 FILES CLOSED FOR INCOMPLETENESS 0 $0 2 $62,500 2 $130,000 0 $0 0 $0
Aggregated Statistics For Year 2002(Based on 1 full tract) A) FHA, FSA/RHS & VA B) Conventional C) Refinancings D) Home Improvement Loans F) Non-occupant Loans on Number Average Value Number Average Value Number Average Value Number Average Value Number Average Value
LOANS ORIGINATED 3 $82,000 14 $105,929 63 $89,048 12 $30,167 3 $38,333 APPLICATIONS APPROVED, NOT ACCEPTED 0 $0 0 $0 17 $92,765 0 $0 1 $31,000 APPLICATIONS DENIED 0 $0 1 $85,000 25 $77,480 7 $16,000 0 $0 APPLICATIONS WITHDRAWN 0 $0 3 $71,333 14 $97,214 4 $40,250 0 $0 FILES CLOSED FOR INCOMPLETENESS 0 $0 1 $75,000 1 $206,000 2 $51,000 0 $0
Aggregated Statistics For Year 2001(Based on 1 full tract) A) FHA, FSA/RHS & VA B) Conventional C) Refinancings D) Home Improvement Loans F) Non-occupant Loans on Number Average Value Number Average Value Number Average Value Number Average Value Number Average Value
LOANS ORIGINATED 7 $97,429 14 $110,000 28 $71,536 9 $22,667 5 $96,200 APPLICATIONS APPROVED, NOT ACCEPTED 0 $0 1 $84,000 4 $98,000 1 $11,000 0 $0 APPLICATIONS DENIED 0 $0 3 $58,333 17 $60,941 3 $8,667 1 $20,000 APPLICATIONS WITHDRAWN 1 $82,000 1 $155,000 11 $78,091 3 $9,333 0 $0 FILES CLOSED FOR INCOMPLETENESS 0 $0 0 $0 2 $72,500 0 $0 0 $0
Aggregated Statistics For Year 2000(Based on 1 full tract) A) FHA, FSA/RHS & VA B) Conventional C) Refinancings D) Home Improvement Loans F) Non-occupant Loans on Number Average Value Number Average Value Number Average Value Number Average Value Number Average Value
LOANS ORIGINATED 7 $94,857 16 $100,812 23 $77,174 17 $15,235 2 $27,000 APPLICATIONS APPROVED, NOT ACCEPTED 0 $0 2 $103,000 5 $83,000 6 $10,667 0 $0 APPLICATIONS DENIED 0 $0 3 $111,333 12 $64,750 6 $16,333 2 $76,500 APPLICATIONS WITHDRAWN 0 $0 1 $179,000 4 $63,750 0 $0 0 $0 FILES CLOSED FOR INCOMPLETENESS 0 $0 1 $101,000 1 $80,000 0 $0 0 $0
Aggregated Statistics For Year 1999(Based on 1 full tract) A) FHA, FSA/RHS & VA B) Conventional C) Refinancings D) Home Improvement Loans F) Non-occupant Loans on Number Average Value Number Average Value Number Average Value Number Average Value Number Average Value
LOANS ORIGINATED 6 $98,972 18 $99,567 42 $68,099 18 $22,823 5 $79,048 APPLICATIONS APPROVED, NOT ACCEPTED 0 $0 1 $48,670 5 $61,526 4 $29,935 0 $0 APPLICATIONS DENIED 0 $0 0 $0 13 $55,864 6 $19,957 1 $53,540 APPLICATIONS WITHDRAWN 0 $0 3 $103,840 10 $74,083 1 $27,260 0 $0 FILES CLOSED FOR INCOMPLETENESS 0 $0 0 $0 3 $61,007 0 $0 0 $0
Detailed HMDA statistics for the following Tracts:
5018.00
Private Mortgage Insurance Companies Aggregated Statistics For Year 2008(Based on 1 full tract) A) Conventional B) Refinancings Number Average Value Number Average Value
LOANS ORIGINATED 0 $0 1 $171,000 APPLICATIONS APPROVED, NOT ACCEPTED 2 $196,500 0 $0 APPLICATIONS DENIED 0 $0 0 $0 APPLICATIONS WITHDRAWN 0 $0 0 $0 FILES CLOSED FOR INCOMPLETENESS 0 $0 0 $0
Aggregated Statistics For Year 2007(Based on 1 full tract) A) Conventional B) Refinancings Number Average Value Number Average Value
LOANS ORIGINATED 8 $208,125 2 $219,000 APPLICATIONS APPROVED, NOT ACCEPTED 2 $164,000 1 $250,000 APPLICATIONS DENIED 3 $225,667 0 $0 APPLICATIONS WITHDRAWN 0 $0 0 $0 FILES CLOSED FOR INCOMPLETENESS 0 $0 0 $0
Aggregated Statistics For Year 2006(Based on 1 full tract) A) Conventional B) Refinancings C) Non-occupant Loans on Number Average Value Number Average Value Number Average Value
LOANS ORIGINATED 3 $280,333 1 $202,000 1 $369,000 APPLICATIONS APPROVED, NOT ACCEPTED 0 $0 0 $0 0 $0 APPLICATIONS DENIED 0 $0 0 $0 0 $0 APPLICATIONS WITHDRAWN 0 $0 0 $0 0 $0 FILES CLOSED FOR INCOMPLETENESS 0 $0 0 $0 0 $0
Aggregated Statistics For Year 2005(Based on 1 full tract) A) Conventional B) Refinancings C) Non-occupant Loans on Number Average Value Number Average Value Number Average Value
LOANS ORIGINATED 4 $134,750 2 $199,000 1 $122,000 APPLICATIONS APPROVED, NOT ACCEPTED 0 $0 1 $158,000 0 $0 APPLICATIONS DENIED 0 $0 0 $0 0 $0 APPLICATIONS WITHDRAWN 0 $0 0 $0 0 $0 FILES CLOSED FOR INCOMPLETENESS 0 $0 0 $0 0 $0
Aggregated Statistics For Year 2004(Based on 1 full tract) A) Conventional B) Refinancings Number Average Value Number Average Value
LOANS ORIGINATED 4 $135,500 2 $169,500 APPLICATIONS APPROVED, NOT ACCEPTED 0 $0 0 $0 APPLICATIONS DENIED 1 $107,000 0 $0 APPLICATIONS WITHDRAWN 0 $0 0 $0 FILES CLOSED FOR INCOMPLETENESS 0 $0 0 $0
Aggregated Statistics For Year 2003(Based on 1 full tract) A) Conventional B) Refinancings Number Average Value Number Average Value
LOANS ORIGINATED 6 $105,833 3 $106,333 APPLICATIONS APPROVED, NOT ACCEPTED 0 $0 0 $0 APPLICATIONS DENIED 0 $0 0 $0 APPLICATIONS WITHDRAWN 0 $0 0 $0 FILES CLOSED FOR INCOMPLETENESS 0 $0 0 $0
Aggregated Statistics For Year 2002(Based on 1 full tract) A) Conventional B) Refinancings Number Average Value Number Average Value
LOANS ORIGINATED 11 $120,091 7 $124,857 APPLICATIONS APPROVED, NOT ACCEPTED 1 $106,000 1 $194,000 APPLICATIONS DENIED 0 $0 0 $0 APPLICATIONS WITHDRAWN 1 $92,000 1 $104,000 FILES CLOSED FOR INCOMPLETENESS 0 $0 0 $0
Aggregated Statistics For Year 2001(Based on 1 full tract) A) Conventional B) Refinancings Number Average Value Number Average Value
LOANS ORIGINATED 3 $104,667 1 $96,000 APPLICATIONS APPROVED, NOT ACCEPTED 0 $0 2 $207,000 APPLICATIONS DENIED 0 $0 0 $0 APPLICATIONS WITHDRAWN 0 $0 0 $0 FILES CLOSED FOR INCOMPLETENESS 0 $0 0 $0
Aggregated Statistics For Year 2000(Based on 1 full tract) A) Conventional B) Refinancings Number Average Value Number Average Value
LOANS ORIGINATED 4 $140,250 3 $94,667 APPLICATIONS APPROVED, NOT ACCEPTED 1 $110,000 0 $0 APPLICATIONS DENIED 1 $110,000 0 $0 APPLICATIONS WITHDRAWN 0 $0 0 $0 FILES CLOSED FOR INCOMPLETENESS 0 $0 0 $0
Aggregated Statistics For Year 1999(Based on 1 full tract) A) Conventional B) Refinancings Number Average Value Number Average Value
LOANS ORIGINATED 8 $115,116 4 $104,650 APPLICATIONS APPROVED, NOT ACCEPTED 2 $128,500 0 $0 APPLICATIONS DENIED 0 $0 0 $0 APPLICATIONS WITHDRAWN 1 $115,850 0 $0 FILES CLOSED FOR INCOMPLETENESS 0 $0 0 $0
Detailed PMIC statistics for the following Tracts:
5018.00
Newfield compared to New Jersey state average:
Median house value below state average. Unemployed percentage significantly below state average. Black race population percentage significantly below state average. Foreign-born population percentage significantly below state average. Renting percentage below state average. Length of stay since moving in significantly above state average.
Top Patent Applicants
James F. Butz, Jr. (2)
David Diienno (1)
Total of 3 patent applications in 2008-2024.


 Recent articles from our blog. Our writers, many of them Ph.D. graduates or candidates, create easy-to-read articles on a wide variety of topics.

 (4.8 miles
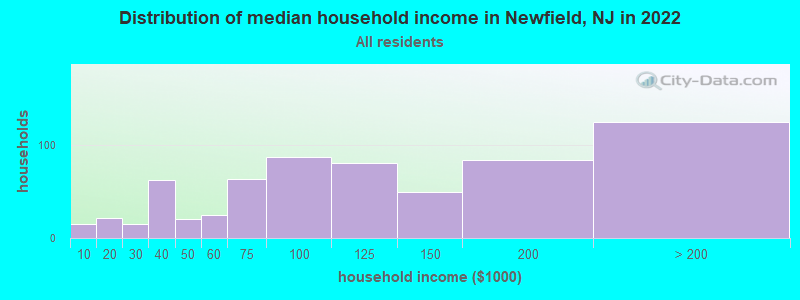


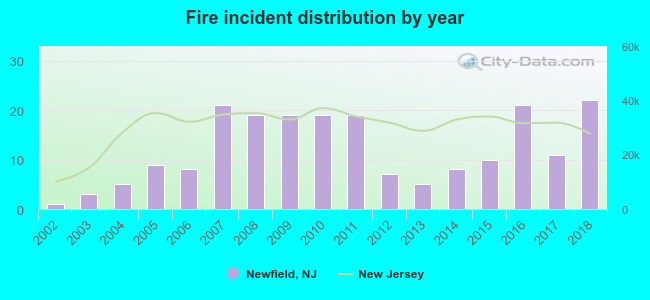 According to the data from the years 2002 - 2018 the average number of fires per year is 12. The highest number of fire incidents - 22 took place in 2018, and the least - 1 in 2002. The data has a growing trend.
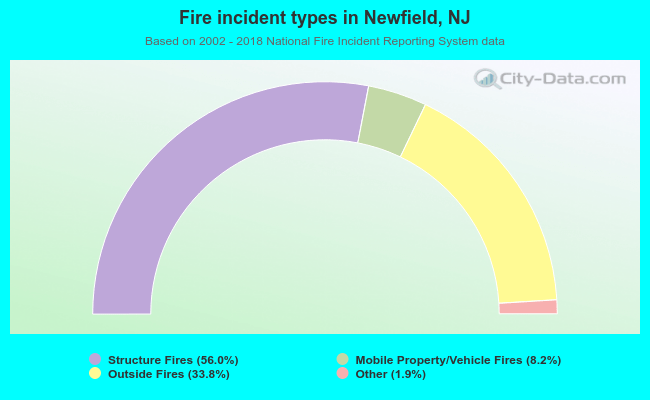 When looking into fire subcategories, the most reports belonged to: Structure Fires (56.0%), and Outside Fires (33.8%).