Irondale, Alabama Submit your own pictures of this city and show them to the world
OSM Map
General Map
Google Map
MSN Map
OSM Map
General Map
Google Map
MSN Map
OSM Map
General Map
Google Map
MSN Map
OSM Map
General Map
Google Map
MSN Map
Please wait while loading the map...
Population in 2022: 13,366 (95% urban, 5% rural). Population change since 2000: +36.2%Males: 7,131 Females: 6,235
March 2022 cost of living index in Irondale: 88.1 (less than average, U.S. average is 100) Percentage of residents living in poverty in 2022: 15.1%for White Non-Hispanic residents , 30.4% for Black residents , 11.7% for Hispanic or Latino residents , 46.2% for American Indian residents , 44.8% for other race residents , 17.3% for two or more races residents )
Profiles of local businesses
Business Search - 14 Million verified businesses
Data:
Median household income ($)
Median household income (% change since 2000)
Household income diversity
Ratio of average income to average house value (%)
Ratio of average income to average rent
Median household income ($) - White
Median household income ($) - Black or African American
Median household income ($) - Asian
Median household income ($) - Hispanic or Latino
Median household income ($) - American Indian and Alaska Native
Median household income ($) - Multirace
Median household income ($) - Other Race
Median household income for houses/condos with a mortgage ($)
Median household income for apartments without a mortgage ($)
Races - White alone (%)
Races - White alone (% change since 2000)
Races - Black alone (%)
Races - Black alone (% change since 2000)
Races - American Indian alone (%)
Races - American Indian alone (% change since 2000)
Races - Asian alone (%)
Races - Asian alone (% change since 2000)
Races - Hispanic (%)
Races - Hispanic (% change since 2000)
Races - Native Hawaiian and Other Pacific Islander alone (%)
Races - Native Hawaiian and Other Pacific Islander alone (% change since 2000)
Races - Two or more races (%)
Races - Two or more races (% change since 2000)
Races - Other race alone (%)
Races - Other race alone (% change since 2000)
Racial diversity
Unemployment (%)
Unemployment (% change since 2000)
Unemployment (%) - White
Unemployment (%) - Black or African American
Unemployment (%) - Asian
Unemployment (%) - Hispanic or Latino
Unemployment (%) - American Indian and Alaska Native
Unemployment (%) - Multirace
Unemployment (%) - Other Race
Population density (people per square mile)
Population - Males (%)
Population - Females (%)
Population - Males (%) - White
Population - Males (%) - Black or African American
Population - Males (%) - Asian
Population - Males (%) - Hispanic or Latino
Population - Males (%) - American Indian and Alaska Native
Population - Males (%) - Multirace
Population - Males (%) - Other Race
Population - Females (%) - White
Population - Females (%) - Black or African American
Population - Females (%) - Asian
Population - Females (%) - Hispanic or Latino
Population - Females (%) - American Indian and Alaska Native
Population - Females (%) - Multirace
Population - Females (%) - Other Race
Coronavirus confirmed cases (Jun 08, 2024)
Deaths caused by coronavirus (Jun 08, 2024)
Coronavirus confirmed cases (per 100k population) (Jun 08, 2024)
Deaths caused by coronavirus (per 100k population) (Jun 08, 2024)
Daily increase in number of cases (Jun 08, 2024)
Weekly increase in number of cases (Jun 08, 2024)
Cases doubled (in days) (Jun 08, 2024)
Hospitalized patients (Apr 18, 2022)
Negative test results (Apr 18, 2022)
Total test results (Apr 18, 2022)
COVID Vaccine doses distributed (per 100k population) (Sep 19, 2023)
COVID Vaccine doses administered (per 100k population) (Sep 19, 2023)
COVID Vaccine doses distributed (Sep 19, 2023)
COVID Vaccine doses administered (Sep 19, 2023)
Likely homosexual households (%)
Likely homosexual households (% change since 2000)
Likely homosexual households - Lesbian couples (%)
Likely homosexual households - Lesbian couples (% change since 2000)
Likely homosexual households - Gay men (%)
Likely homosexual households - Gay men (% change since 2000)
Cost of living index
Median gross rent ($)
Median contract rent ($)
Median monthly housing costs ($)
Median house or condo value ($)
Median house or condo value ($ change since 2000)
Mean house or condo value by units in structure - 1, detached ($)
Mean house or condo value by units in structure - 1, attached ($)
Mean house or condo value by units in structure - 2 ($)
Mean house or condo value by units in structure by units in structure - 3 or 4 ($)
Mean house or condo value by units in structure - 5 or more ($)
Mean house or condo value by units in structure - Boat, RV, van, etc. ($)
Mean house or condo value by units in structure - Mobile home ($)
Median house or condo value ($) - White
Median house or condo value ($) - Black or African American
Median house or condo value ($) - Asian
Median house or condo value ($) - Hispanic or Latino
Median house or condo value ($) - American Indian and Alaska Native
Median house or condo value ($) - Multirace
Median house or condo value ($) - Other Race
Median resident age
Resident age diversity
Median resident age - Males
Median resident age - Females
Median resident age - White
Median resident age - Black or African American
Median resident age - Asian
Median resident age - Hispanic or Latino
Median resident age - American Indian and Alaska Native
Median resident age - Multirace
Median resident age - Other Race
Median resident age - Males - White
Median resident age - Males - Black or African American
Median resident age - Males - Asian
Median resident age - Males - Hispanic or Latino
Median resident age - Males - American Indian and Alaska Native
Median resident age - Males - Multirace
Median resident age - Males - Other Race
Median resident age - Females - White
Median resident age - Females - Black or African American
Median resident age - Females - Asian
Median resident age - Females - Hispanic or Latino
Median resident age - Females - American Indian and Alaska Native
Median resident age - Females - Multirace
Median resident age - Females - Other Race
Commute - mean travel time to work (minutes)
Travel time to work - Less than 5 minutes (%)
Travel time to work - Less than 5 minutes (% change since 2000)
Travel time to work - 5 to 9 minutes (%)
Travel time to work - 5 to 9 minutes (% change since 2000)
Travel time to work - 10 to 19 minutes (%)
Travel time to work - 10 to 19 minutes (% change since 2000)
Travel time to work - 20 to 29 minutes (%)
Travel time to work - 20 to 29 minutes (% change since 2000)
Travel time to work - 30 to 39 minutes (%)
Travel time to work - 30 to 39 minutes (% change since 2000)
Travel time to work - 40 to 59 minutes (%)
Travel time to work - 40 to 59 minutes (% change since 2000)
Travel time to work - 60 to 89 minutes (%)
Travel time to work - 60 to 89 minutes (% change since 2000)
Travel time to work - 90 or more minutes (%)
Travel time to work - 90 or more minutes (% change since 2000)
Marital status - Never married (%)
Marital status - Now married (%)
Marital status - Separated (%)
Marital status - Widowed (%)
Marital status - Divorced (%)
Median family income ($)
Median family income (% change since 2000)
Median non-family income ($)
Median non-family income (% change since 2000)
Median per capita income ($)
Median per capita income (% change since 2000)
Median family income ($) - White
Median family income ($) - Black or African American
Median family income ($) - Asian
Median family income ($) - Hispanic or Latino
Median family income ($) - American Indian and Alaska Native
Median family income ($) - Multirace
Median family income ($) - Other Race
Median year house/condo built
Median year apartment built
Year house built - Built 2005 or later (%)
Year house built - Built 2000 to 2004 (%)
Year house built - Built 1990 to 1999 (%)
Year house built - Built 1980 to 1989 (%)
Year house built - Built 1970 to 1979 (%)
Year house built - Built 1960 to 1969 (%)
Year house built - Built 1950 to 1959 (%)
Year house built - Built 1940 to 1949 (%)
Year house built - Built 1939 or earlier (%)
Average household size
Household density (households per square mile)
Average household size - White
Average household size - Black or African American
Average household size - Asian
Average household size - Hispanic or Latino
Average household size - American Indian and Alaska Native
Average household size - Multirace
Average household size - Other Race
Occupied housing units (%)
Vacant housing units (%)
Owner occupied housing units (%)
Renter occupied housing units (%)
Vacancy status - For rent (%)
Vacancy status - For sale only (%)
Vacancy status - Rented or sold, not occupied (%)
Vacancy status - For seasonal, recreational, or occasional use (%)
Vacancy status - For migrant workers (%)
Vacancy status - Other vacant (%)
Residents with income below the poverty level (%)
Residents with income below 50% of the poverty level (%)
Children below poverty level (%)
Poor families by family type - Married-couple family (%)
Poor families by family type - Male, no wife present (%)
Poor families by family type - Female, no husband present (%)
Poverty status for native-born residents (%)
Poverty status for foreign-born residents (%)
Poverty among high school graduates not in families (%)
Poverty among people who did not graduate high school not in families (%)
Residents with income below the poverty level (%) - White
Residents with income below the poverty level (%) - Black or African American
Residents with income below the poverty level (%) - Asian
Residents with income below the poverty level (%) - Hispanic or Latino
Residents with income below the poverty level (%) - American Indian and Alaska Native
Residents with income below the poverty level (%) - Multirace
Residents with income below the poverty level (%) - Other Race
Air pollution - Air Quality Index (AQI)
Air pollution - CO
Air pollution - NO2
Air pollution - SO2
Air pollution - Ozone
Air pollution - PM10
Air pollution - PM25
Air pollution - Pb
Crime - Murders per 100,000 population
Crime - Rapes per 100,000 population
Crime - Robberies per 100,000 population
Crime - Assaults per 100,000 population
Crime - Burglaries per 100,000 population
Crime - Thefts per 100,000 population
Crime - Auto thefts per 100,000 population
Crime - Arson per 100,000 population
Crime - City-data.com crime index
Crime - Violent crime index
Crime - Property crime index
Crime - Murders per 100,000 population (5 year average)
Crime - Rapes per 100,000 population (5 year average)
Crime - Robberies per 100,000 population (5 year average)
Crime - Assaults per 100,000 population (5 year average)
Crime - Burglaries per 100,000 population (5 year average)
Crime - Thefts per 100,000 population (5 year average)
Crime - Auto thefts per 100,000 population (5 year average)
Crime - Arson per 100,000 population (5 year average)
Crime - City-data.com crime index (5 year average)
Crime - Violent crime index (5 year average)
Crime - Property crime index (5 year average)
1996 Presidential Elections Results (%) - Democratic Party (Clinton)
1996 Presidential Elections Results (%) - Republican Party (Dole)
1996 Presidential Elections Results (%) - Other
2000 Presidential Elections Results (%) - Democratic Party (Gore)
2000 Presidential Elections Results (%) - Republican Party (Bush)
2000 Presidential Elections Results (%) - Other
2004 Presidential Elections Results (%) - Democratic Party (Kerry)
2004 Presidential Elections Results (%) - Republican Party (Bush)
2004 Presidential Elections Results (%) - Other
2008 Presidential Elections Results (%) - Democratic Party (Obama)
2008 Presidential Elections Results (%) - Republican Party (McCain)
2008 Presidential Elections Results (%) - Other
2012 Presidential Elections Results (%) - Democratic Party (Obama)
2012 Presidential Elections Results (%) - Republican Party (Romney)
2012 Presidential Elections Results (%) - Other
2016 Presidential Elections Results (%) - Democratic Party (Clinton)
2016 Presidential Elections Results (%) - Republican Party (Trump)
2016 Presidential Elections Results (%) - Other
2020 Presidential Elections Results (%) - Democratic Party (Biden)
2020 Presidential Elections Results (%) - Republican Party (Trump)
2020 Presidential Elections Results (%) - Other
Ancestries Reported - Arab (%)
Ancestries Reported - Czech (%)
Ancestries Reported - Danish (%)
Ancestries Reported - Dutch (%)
Ancestries Reported - English (%)
Ancestries Reported - French (%)
Ancestries Reported - French Canadian (%)
Ancestries Reported - German (%)
Ancestries Reported - Greek (%)
Ancestries Reported - Hungarian (%)
Ancestries Reported - Irish (%)
Ancestries Reported - Italian (%)
Ancestries Reported - Lithuanian (%)
Ancestries Reported - Norwegian (%)
Ancestries Reported - Polish (%)
Ancestries Reported - Portuguese (%)
Ancestries Reported - Russian (%)
Ancestries Reported - Scotch-Irish (%)
Ancestries Reported - Scottish (%)
Ancestries Reported - Slovak (%)
Ancestries Reported - Subsaharan African (%)
Ancestries Reported - Swedish (%)
Ancestries Reported - Swiss (%)
Ancestries Reported - Ukrainian (%)
Ancestries Reported - United States (%)
Ancestries Reported - Welsh (%)
Ancestries Reported - West Indian (%)
Ancestries Reported - Other (%)
Educational Attainment - No schooling completed (%)
Educational Attainment - Less than high school (%)
Educational Attainment - High school or equivalent (%)
Educational Attainment - Less than 1 year of college (%)
Educational Attainment - 1 or more years of college (%)
Educational Attainment - Associate degree (%)
Educational Attainment - Bachelor's degree (%)
Educational Attainment - Master's degree (%)
Educational Attainment - Professional school degree (%)
Educational Attainment - Doctorate degree (%)
School Enrollment - Nursery, preschool (%)
School Enrollment - Kindergarten (%)
School Enrollment - Grade 1 to 4 (%)
School Enrollment - Grade 5 to 8 (%)
School Enrollment - Grade 9 to 12 (%)
School Enrollment - College undergrad (%)
School Enrollment - Graduate or professional (%)
School Enrollment - Not enrolled in school (%)
School enrollment - Public schools (%)
School enrollment - Private schools (%)
School enrollment - Not enrolled (%)
Median number of rooms in houses and condos
Median number of rooms in apartments
Housing units lacking complete plumbing facilities (%)
Housing units lacking complete kitchen facilities (%)
Density of houses
Urban houses (%)
Rural houses (%)
Households with people 60 years and over (%)
Households with people 65 years and over (%)
Households with people 75 years and over (%)
Households with one or more nonrelatives (%)
Households with no nonrelatives (%)
Population in households (%)
Family households (%)
Nonfamily households (%)
Population in families (%)
Family households with own children (%)
Median number of bedrooms in owner occupied houses
Mean number of bedrooms in owner occupied houses
Median number of bedrooms in renter occupied houses
Mean number of bedrooms in renter occupied houses
Median number of vehichles in owner occupied houses
Mean number of vehichles in owner occupied houses
Median number of vehichles in renter occupied houses
Mean number of vehichles in renter occupied houses
Mortgage status - with mortgage (%)
Mortgage status - with second mortgage (%)
Mortgage status - with home equity loan (%)
Mortgage status - with both second mortgage and home equity loan (%)
Mortgage status - without a mortgage (%)
Average family size
Average family size - White
Average family size - Black or African American
Average family size - Asian
Average family size - Hispanic or Latino
Average family size - American Indian and Alaska Native
Average family size - Multirace
Average family size - Other Race
Geographical mobility - Same house 1 year ago (%)
Geographical mobility - Moved within same county (%)
Geographical mobility - Moved from different county within same state (%)
Geographical mobility - Moved from different state (%)
Geographical mobility - Moved from abroad (%)
Place of birth - Born in state of residence (%)
Place of birth - Born in other state (%)
Place of birth - Native, outside of US (%)
Place of birth - Foreign born (%)
Housing units in structures - 1, detached (%)
Housing units in structures - 1, attached (%)
Housing units in structures - 2 (%)
Housing units in structures - 3 or 4 (%)
Housing units in structures - 5 to 9 (%)
Housing units in structures - 10 to 19 (%)
Housing units in structures - 20 to 49 (%)
Housing units in structures - 50 or more (%)
Housing units in structures - Mobile home (%)
Housing units in structures - Boat, RV, van, etc. (%)
House/condo owner moved in on average (years ago)
Renter moved in on average (years ago)
Year householder moved into unit - Moved in 1999 to March 2000 (%)
Year householder moved into unit - Moved in 1995 to 1998 (%)
Year householder moved into unit - Moved in 1990 to 1994 (%)
Year householder moved into unit - Moved in 1980 to 1989 (%)
Year householder moved into unit - Moved in 1970 to 1979 (%)
Year householder moved into unit - Moved in 1969 or earlier (%)
Means of transportation to work - Drove car alone (%)
Means of transportation to work - Carpooled (%)
Means of transportation to work - Public transportation (%)
Means of transportation to work - Bus or trolley bus (%)
Means of transportation to work - Streetcar or trolley car (%)
Means of transportation to work - Subway or elevated (%)
Means of transportation to work - Railroad (%)
Means of transportation to work - Ferryboat (%)
Means of transportation to work - Taxicab (%)
Means of transportation to work - Motorcycle (%)
Means of transportation to work - Bicycle (%)
Means of transportation to work - Walked (%)
Means of transportation to work - Other means (%)
Working at home (%)
Industry diversity
Most Common Industries - Agriculture, forestry, fishing and hunting, and mining (%)
Most Common Industries - Agriculture, forestry, fishing and hunting (%)
Most Common Industries - Mining, quarrying, and oil and gas extraction (%)
Most Common Industries - Construction (%)
Most Common Industries - Manufacturing (%)
Most Common Industries - Wholesale trade (%)
Most Common Industries - Retail trade (%)
Most Common Industries - Transportation and warehousing, and utilities (%)
Most Common Industries - Transportation and warehousing (%)
Most Common Industries - Utilities (%)
Most Common Industries - Information (%)
Most Common Industries - Finance and insurance, and real estate and rental and leasing (%)
Most Common Industries - Finance and insurance (%)
Most Common Industries - Real estate and rental and leasing (%)
Most Common Industries - Professional, scientific, and management, and administrative and waste management services (%)
Most Common Industries - Professional, scientific, and technical services (%)
Most Common Industries - Management of companies and enterprises (%)
Most Common Industries - Administrative and support and waste management services (%)
Most Common Industries - Educational services, and health care and social assistance (%)
Most Common Industries - Educational services (%)
Most Common Industries - Health care and social assistance (%)
Most Common Industries - Arts, entertainment, and recreation, and accommodation and food services (%)
Most Common Industries - Arts, entertainment, and recreation (%)
Most Common Industries - Accommodation and food services (%)
Most Common Industries - Other services, except public administration (%)
Most Common Industries - Public administration (%)
Occupation diversity
Most Common Occupations - Management, business, science, and arts occupations (%)
Most Common Occupations - Management, business, and financial occupations (%)
Most Common Occupations - Management occupations (%)
Most Common Occupations - Business and financial operations occupations (%)
Most Common Occupations - Computer, engineering, and science occupations (%)
Most Common Occupations - Computer and mathematical occupations (%)
Most Common Occupations - Architecture and engineering occupations (%)
Most Common Occupations - Life, physical, and social science occupations (%)
Most Common Occupations - Education, legal, community service, arts, and media occupations (%)
Most Common Occupations - Community and social service occupations (%)
Most Common Occupations - Legal occupations (%)
Most Common Occupations - Education, training, and library occupations (%)
Most Common Occupations - Arts, design, entertainment, sports, and media occupations (%)
Most Common Occupations - Healthcare practitioners and technical occupations (%)
Most Common Occupations - Health diagnosing and treating practitioners and other technical occupations (%)
Most Common Occupations - Health technologists and technicians (%)
Most Common Occupations - Service occupations (%)
Most Common Occupations - Healthcare support occupations (%)
Most Common Occupations - Protective service occupations (%)
Most Common Occupations - Fire fighting and prevention, and other protective service workers including supervisors (%)
Most Common Occupations - Law enforcement workers including supervisors (%)
Most Common Occupations - Food preparation and serving related occupations (%)
Most Common Occupations - Building and grounds cleaning and maintenance occupations (%)
Most Common Occupations - Personal care and service occupations (%)
Most Common Occupations - Sales and office occupations (%)
Most Common Occupations - Sales and related occupations (%)
Most Common Occupations - Office and administrative support occupations (%)
Most Common Occupations - Natural resources, construction, and maintenance occupations (%)
Most Common Occupations - Farming, fishing, and forestry occupations (%)
Most Common Occupations - Construction and extraction occupations (%)
Most Common Occupations - Installation, maintenance, and repair occupations (%)
Most Common Occupations - Production, transportation, and material moving occupations (%)
Most Common Occupations - Production occupations (%)
Most Common Occupations - Transportation occupations (%)
Most Common Occupations - Material moving occupations (%)
People in Group quarters - Institutionalized population (%)
People in Group quarters - Correctional institutions (%)
People in Group quarters - Federal prisons and detention centers (%)
People in Group quarters - Halfway houses (%)
People in Group quarters - Local jails and other confinement facilities (including police lockups) (%)
People in Group quarters - Military disciplinary barracks (%)
People in Group quarters - State prisons (%)
People in Group quarters - Other types of correctional institutions (%)
People in Group quarters - Nursing homes (%)
People in Group quarters - Hospitals/wards, hospices, and schools for the handicapped (%)
People in Group quarters - Hospitals/wards and hospices for chronically ill (%)
People in Group quarters - Hospices or homes for chronically ill (%)
People in Group quarters - Military hospitals or wards for chronically ill (%)
People in Group quarters - Other hospitals or wards for chronically ill (%)
People in Group quarters - Hospitals or wards for drug/alcohol abuse (%)
People in Group quarters - Mental (Psychiatric) hospitals or wards (%)
People in Group quarters - Schools, hospitals, or wards for the mentally retarded (%)
People in Group quarters - Schools, hospitals, or wards for the physically handicapped (%)
People in Group quarters - Institutions for the deaf (%)
People in Group quarters - Institutions for the blind (%)
People in Group quarters - Orthopedic wards and institutions for the physically handicapped (%)
People in Group quarters - Wards in general hospitals for patients who have no usual home elsewhere (%)
People in Group quarters - Wards in military hospitals for patients who have no usual home elsewhere (%)
People in Group quarters - Juvenile institutions (%)
People in Group quarters - Long-term care (%)
People in Group quarters - Homes for abused, dependent, and neglected children (%)
People in Group quarters - Residential treatment centers for emotionally disturbed children (%)
People in Group quarters - Training schools for juvenile delinquents (%)
People in Group quarters - Short-term care, detention or diagnostic centers for delinquent children (%)
People in Group quarters - Type of juvenile institution unknown (%)
People in Group quarters - Noninstitutionalized population (%)
People in Group quarters - College dormitories (includes college quarters off campus) (%)
People in Group quarters - Military quarters (%)
People in Group quarters - On base (%)
People in Group quarters - Barracks, unaccompanied personnel housing (UPH), (Enlisted/Officer), ;and similar group living quarters for military personnel (%)
People in Group quarters - Transient quarters for temporary residents (%)
People in Group quarters - Military ships (%)
People in Group quarters - Group homes (%)
People in Group quarters - Homes or halfway houses for drug/alcohol abuse (%)
People in Group quarters - Homes for the mentally ill (%)
People in Group quarters - Homes for the mentally retarded (%)
People in Group quarters - Homes for the physically handicapped (%)
People in Group quarters - Other group homes (%)
People in Group quarters - Religious group quarters (%)
People in Group quarters - Dormitories (%)
People in Group quarters - Agriculture workers' dormitories on farms (%)
People in Group quarters - Job Corps and vocational training facilities (%)
People in Group quarters - Other workers' dormitories (%)
People in Group quarters - Crews of maritime vessels (%)
People in Group quarters - Other nonhousehold living situations (%)
People in Group quarters - Other noninstitutional group quarters (%)
Residents speaking English at home (%)
Residents speaking English at home - Born in the United States (%)
Residents speaking English at home - Native, born elsewhere (%)
Residents speaking English at home - Foreign born (%)
Residents speaking Spanish at home (%)
Residents speaking Spanish at home - Born in the United States (%)
Residents speaking Spanish at home - Native, born elsewhere (%)
Residents speaking Spanish at home - Foreign born (%)
Residents speaking other language at home (%)
Residents speaking other language at home - Born in the United States (%)
Residents speaking other language at home - Native, born elsewhere (%)
Residents speaking other language at home - Foreign born (%)
Class of Workers - Employee of private company (%)
Class of Workers - Self-employed in own incorporated business (%)
Class of Workers - Private not-for-profit wage and salary workers (%)
Class of Workers - Local government workers (%)
Class of Workers - State government workers (%)
Class of Workers - Federal government workers (%)
Class of Workers - Self-employed workers in own not incorporated business and Unpaid family workers (%)
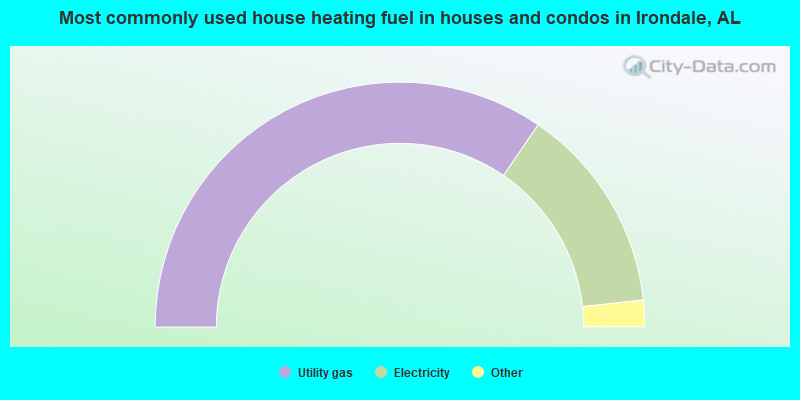
House heating fuel used in houses and condos - Utility gas (%)
House heating fuel used in houses and condos - Bottled, tank, or LP gas (%)
House heating fuel used in houses and condos - Electricity (%)
House heating fuel used in houses and condos - Fuel oil, kerosene, etc. (%)
House heating fuel used in houses and condos - Coal or coke (%)
House heating fuel used in houses and condos - Wood (%)
House heating fuel used in houses and condos - Solar energy (%)
House heating fuel used in houses and condos - Other fuel (%)
House heating fuel used in houses and condos - No fuel used (%)
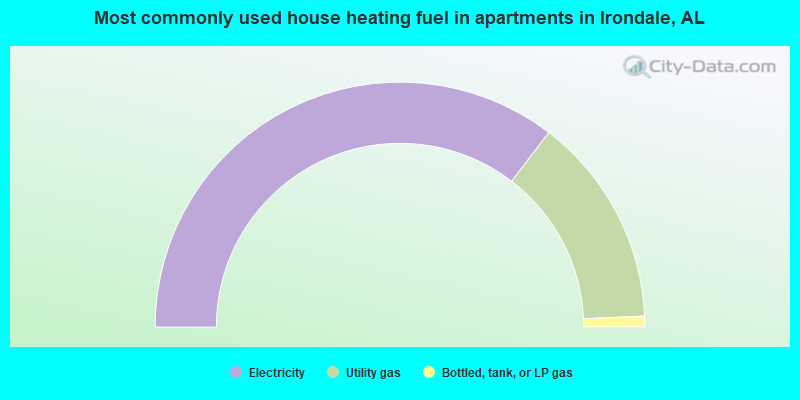
House heating fuel used in apartments - Utility gas (%)
House heating fuel used in apartments - Bottled, tank, or LP gas (%)
House heating fuel used in apartments - Electricity (%)
House heating fuel used in apartments - Fuel oil, kerosene, etc. (%)
House heating fuel used in apartments - Coal or coke (%)
House heating fuel used in apartments - Wood (%)
House heating fuel used in apartments - Solar energy (%)
House heating fuel used in apartments - Other fuel (%)
House heating fuel used in apartments - No fuel used (%)
Armed forces status - In Armed Forces (%)
Armed forces status - Civilian (%)
Armed forces status - Civilian - Veteran (%)
Armed forces status - Civilian - Nonveteran (%)
Fatal accidents locations in years 2005-2021
Fatal accidents locations in 2005
Fatal accidents locations in 2006
Fatal accidents locations in 2007
Fatal accidents locations in 2008
Fatal accidents locations in 2009
Fatal accidents locations in 2010
Fatal accidents locations in 2011
Fatal accidents locations in 2012
Fatal accidents locations in 2013
Fatal accidents locations in 2014
Fatal accidents locations in 2015
Fatal accidents locations in 2016
Fatal accidents locations in 2017
Fatal accidents locations in 2018
Fatal accidents locations in 2019
Fatal accidents locations in 2020
Fatal accidents locations in 2021
Alcohol use - People drinking some alcohol every month (%)
Alcohol use - People not drinking at all (%)
Alcohol use - Average days/month drinking alcohol
Alcohol use - Average drinks/week
Alcohol use - Average days/year people drink much
Audiometry - Average condition of hearing (%)
Audiometry - People that can hear a whisper from across a quiet room (%)
Audiometry - People that can hear normal voice from across a quiet room (%)
Audiometry - Ears ringing, roaring, buzzing (%)
Audiometry - Had a job exposure to loud noise (%)
Audiometry - Had off-work exposure to loud noise (%)
Blood Pressure & Cholesterol - Has high blood pressure (%)
Blood Pressure & Cholesterol - Checking blood pressure at home (%)
Blood Pressure & Cholesterol - Frequently checking blood cholesterol (%)
Blood Pressure & Cholesterol - Has high cholesterol level (%)
Consumer Behavior - Money monthly spent on food at supermarket/grocery store
Consumer Behavior - Money monthly spent on food at other stores
Consumer Behavior - Money monthly spent on eating out
Consumer Behavior - Money monthly spent on carryout/delivered foods
Consumer Behavior - Income spent on food at supermarket/grocery store (%)
Consumer Behavior - Income spent on food at other stores (%)
Consumer Behavior - Income spent on eating out (%)
Consumer Behavior - Income spent on carryout/delivered foods (%)
Current Health Status - General health condition (%)
Current Health Status - Blood donors (%)
Current Health Status - Has blood ever tested for HIV virus (%)
Current Health Status - Left-handed people (%)
Dermatology - People using sunscreen (%)
Diabetes - Diabetics (%)
Diabetes - Had a blood test for high blood sugar (%)
Diabetes - People taking insulin (%)
Diet Behavior & Nutrition - Diet health (%)
Diet Behavior & Nutrition - Milk product consumption (# of products/month)
Diet Behavior & Nutrition - Meals not home prepared (#/week)
Diet Behavior & Nutrition - Meals from fast food or pizza place (#/week)
Diet Behavior & Nutrition - Ready-to-eat foods (#/month)
Diet Behavior & Nutrition - Frozen meals/pizza (#/month)
Drug Use - People that ever used marijuana or hashish (%)
Drug Use - Ever used hard drugs (%)
Drug Use - Ever used any form of cocaine (%)
Drug Use - Ever used heroin (%)
Drug Use - Ever used methamphetamine (%)
Health Insurance - People covered by health insurance (%)
Kidney Conditions-Urology - Avg. # of times urinating at night
Medical Conditions - People with asthma (%)
Medical Conditions - People with anemia (%)
Medical Conditions - People with psoriasis (%)
Medical Conditions - People with overweight (%)
Medical Conditions - Elderly people having difficulties in thinking or remembering (%)
Medical Conditions - People who ever received blood transfusion (%)
Medical Conditions - People having trouble seeing even with glass/contacts (%)
Medical Conditions - People with arthritis (%)
Medical Conditions - People with gout (%)
Medical Conditions - People with congestive heart failure (%)
Medical Conditions - People with coronary heart disease (%)
Medical Conditions - People with angina pectoris (%)
Medical Conditions - People who ever had heart attack (%)
Medical Conditions - People who ever had stroke (%)
Medical Conditions - People with emphysema (%)
Medical Conditions - People with thyroid problem (%)
Medical Conditions - People with chronic bronchitis (%)
Medical Conditions - People with any liver condition (%)
Medical Conditions - People who ever had cancer or malignancy (%)
Mental Health - People who have little interest in doing things (%)
Mental Health - People feeling down, depressed, or hopeless (%)
Mental Health - People who have trouble sleeping or sleeping too much (%)
Mental Health - People feeling tired or having little energy (%)
Mental Health - People with poor appetite or overeating (%)
Mental Health - People feeling bad about themself (%)
Mental Health - People who have trouble concentrating on things (%)
Mental Health - People moving or speaking slowly or too fast (%)
Mental Health - People having thoughts they would be better off dead (%)
Oral Health - Average years since last visit a dentist
Oral Health - People embarrassed because of mouth (%)
Oral Health - People with gum disease (%)
Oral Health - General health of teeth and gums (%)
Oral Health - Average days a week using dental floss/device
Oral Health - Average days a week using mouthwash for dental problem
Oral Health - Average number of teeth
Pesticide Use - Households using pesticides to control insects (%)
Pesticide Use - Households using pesticides to kill weeds (%)
Physical Activity - People doing vigorous-intensity work activities (%)
Physical Activity - People doing moderate-intensity work activities (%)
Physical Activity - People walking or bicycling (%)
Physical Activity - People doing vigorous-intensity recreational activities (%)
Physical Activity - People doing moderate-intensity recreational activities (%)
Physical Activity - Average hours a day doing sedentary activities
Physical Activity - Average hours a day watching TV or videos
Physical Activity - Average hours a day using computer
Physical Functioning - People having limitations keeping them from working (%)
Physical Functioning - People limited in amount of work they can do (%)
Physical Functioning - People that need special equipment to walk (%)
Physical Functioning - People experiencing confusion/memory problems (%)
Physical Functioning - People requiring special healthcare equipment (%)
Prescription Medications - Average number of prescription medicines taking
Preventive Aspirin Use - Adults 40+ taking low-dose aspirin (%)
Reproductive Health - Vaginal deliveries (%)
Reproductive Health - Cesarean deliveries (%)
Reproductive Health - Deliveries resulted in a live birth (%)
Reproductive Health - Pregnancies resulted in a delivery (%)
Reproductive Health - Women breastfeeding newborns (%)
Reproductive Health - Women that had a hysterectomy (%)
Reproductive Health - Women that had both ovaries removed (%)
Reproductive Health - Women that have ever taken birth control pills (%)
Reproductive Health - Women taking birth control pills (%)
Reproductive Health - Women that have ever used Depo-Provera or injectables (%)
Reproductive Health - Women that have ever used female hormones (%)
Sexual Behavior - People 18+ that ever had sex (vaginal, anal, or oral) (%)
Sexual Behavior - Males 18+ that ever had vaginal sex with a woman (%)
Sexual Behavior - Males 18+ that ever performed oral sex on a woman (%)
Sexual Behavior - Males 18+ that ever had anal sex with a woman (%)
Sexual Behavior - Males 18+ that ever had any sex with a man (%)
Sexual Behavior - Females 18+ that ever had vaginal sex with a man (%)
Sexual Behavior - Females 18+ that ever performed oral sex on a man (%)
Sexual Behavior - Females 18+ that ever had anal sex with a man (%)
Sexual Behavior - Females 18+ that ever had any kind of sex with a woman (%)
Sexual Behavior - Average age people first had sex
Sexual Behavior - Average number of female sex partners in lifetime (males 18+)
Sexual Behavior - Average number of female vaginal sex partners in lifetime (males 18+)
Sexual Behavior - Average age people first performed oral sex on a woman (18+)
Sexual Behavior - Average number of woman performed oral sex on in lifetime (18+)
Sexual Behavior - Average number of male sex partners in lifetime (males 18+)
Sexual Behavior - Average number of male anal sex partners in lifetime (males 18+)
Sexual Behavior - Average age people first performed oral sex on a man (18+)
Sexual Behavior - Average number of male oral sex partners in lifetime (18+)
Sexual Behavior - People using protection when performing oral sex (%)
Sexual Behavior - Average number of times people have vaginal or anal sex a year
Sexual Behavior - People having sex without condom (%)
Sexual Behavior - Average number of male sex partners in lifetime (females 18+)
Sexual Behavior - Average number of male vaginal sex partners in lifetime (females 18+)
Sexual Behavior - Average number of female sex partners in lifetime (females 18+)
Sexual Behavior - Circumcised males 18+ (%)
Sleep Disorders - Average hours sleeping at night
Sleep Disorders - People that has trouble sleeping (%)
Smoking-Cigarette Use - People smoking cigarettes (%)
Taste & Smell - People 40+ having problems with smell (%)
Taste & Smell - People 40+ having problems with taste (%)
Taste & Smell - People 40+ that ever had wisdom teeth removed (%)
Taste & Smell - People 40+ that ever had tonsils teeth removed (%)
Taste & Smell - People 40+ that ever had a loss of consciousness because of a head injury (%)
Taste & Smell - People 40+ that ever had a broken nose or other serious injury to face or skull (%)
Taste & Smell - People 40+ that ever had two or more sinus infections (%)
Weight - Average height (inches)
Weight - Average weight (pounds)
Weight - Average BMI
Weight - People that are obese (%)
Weight - People that ever were obese (%)
Weight - People trying to lose weight (%)
7,849 58.9% White alone 4,297 32.3% Black alone 740 5.6% Hispanic 191 1.4% Two or more races 125 0.9% Asian alone 80 0.6% Other race alone 5 0.04% American Indian alone
According to our research of Alabama and other state lists, there were 14 registered sex offenders living in Irondale, Alabama as of June 08, 2024 . The ratio of all residents to sex offenders in Irondale is 885 to 1.The ratio of registered sex offenders to all residents in this city is lower than the state average.
Officers per 1,000 residents here:
2.41Alabama average:
2.40
Latest news from Irondale, AL collected exclusively by city-data.com from local newspapers, TV, and radio stations
Ancestries: American (15.4%), European (7.2%), English (6.4%), Irish (3.7%), Scottish (3.1%), African (3.0%).
Current Local Time:
Land area: 8.97 square miles.
Population density: 1,490 people per square mile (low).
723 residents are foreign born (2.1% Latin America , 1.6% Africa , 1.0% Asia , 0.6% Europe ).
This city:
5.4%Alabama:
3.5%
Median real estate property taxes paid for housing units with mortgages in 2022: $1,125 (0.4%)Median real estate property taxes paid for housing units with no mortgage in 2022: $907 (0.5%)
Nearest city with pop. 50,000+: Birmingham, AL
Nearest city with pop. 1,000,000+: Houston, TX
Nearest cities:
Latitude: 33.53 N, Longitude: 86.69 W
Daytime population change due to commuting: +2,947 (+22.1%)Workers who live and work in this city: 1,265 (18.7%)
Area code commonly used in this area: 205
Single-family new house construction building permits:
2022: 156 buildings , average cost: $164,5002021: 32 buildings , average cost: $310,6002020: 95 buildings , average cost: $227,2002019: 108 buildings , average cost: $194,6002018: 80 buildings , average cost: $175,7002017: 57 buildings , average cost: $144,0002016: 57 buildings , average cost: $119,2002015: 26 buildings , average cost: $190,3002014: 34 buildings , average cost: $133,3002013: 48 buildings , average cost: $90,1002012: 33 buildings , average cost: $98,6002011: 44 buildings , average cost: $89,4002010: 30 buildings , average cost: $84,4002009: 7 buildings , average cost: $118,1002008: 16 buildings , average cost: $102,1002007: 20 buildings , average cost: $109,1002006: 38 buildings , average cost: $108,6002005: 47 buildings , average cost: $124,6002004: 18 buildings , average cost: $143,6002003: 17 buildings , average cost: $130,5002002: 35 buildings , average cost: $105,4002001: 22 buildings , average cost: $105,0002000: 29 buildings , average cost: $98,4001999: 29 buildings , average cost: $91,5001998: 30 buildings , average cost: $152,7001997: 27 buildings , average cost: $146,300Unemployment in December 2023:
Population change in the 1990s: +263 (+2.8%).
Most common occupations in Irondale, AL (%)
Both Males Females
Other office and administrative support workers, including supervisors (6.6%)
Other management occupations, except farmers and farm managers (5.1%)
Other sales and related occupations, including supervisors (5.1%)
Retail sales workers, except cashiers (4.9%)
Sales representatives, services, wholesale and manufacturing (4.1%)
Secretaries and administrative assistants (3.9%)
Preschool, kindergarten, elementary, and middle school teachers (3.3%)
Other sales and related occupations, including supervisors (7.2%)
Other management occupations, except farmers and farm managers (6.0%)
Sales representatives, services, wholesale and manufacturing (5.5%)
Other office and administrative support workers, including supervisors (4.4%)
Retail sales workers, except cashiers (4.3%)
Engineers (4.0%)
Building and grounds cleaning and maintenance occupations (3.8%)
Other office and administrative support workers, including supervisors (8.6%)
Secretaries and administrative assistants (7.0%)
Preschool, kindergarten, elementary, and middle school teachers (5.5%)
Retail sales workers, except cashiers (5.4%)
Bookkeeping, accounting, and auditing clerks (5.1%)
Other management occupations, except farmers and farm managers (4.3%)
Financial clerks, except bookkeeping, accounting and auditing clerks (3.6%)
Tornado activity:
Irondale-area historical tornado activity is slightly above Alabama state average. It is 152% greater than the overall U.S. average.
On 4/4/1977, a category F5 (max. wind speeds 261-318 mph) tornado 4.8 miles away from the Irondale city center killed 22 people and injured 130 people and caused between $5,000,000 and $50,000,000 in damages.
On 4/8/1998, a category F5 tornado 11.1 miles away from the city center killed 32 people and injured 259 people and caused $200 million in damages.
Earthquake activity:
Irondale-area historical earthquake activity is significantly above Alabama state average. It is 125% greater than the overall U.S. average. On 1/18/1999 at 07:00:53, a magnitude 4.8 (4.8 MB, 4.0 LG, Depth: 0.6 mi, Class: Light, Intensity: IV - V) earthquake occurred 33.9 miles away from the city center On 4/29/2003 at 08:59:39, a magnitude 4.9 (4.4 MB, 4.6 MW, 4.9 LG) earthquake occurred 90.0 miles away from the city center On 6/24/1975 at 11:11:36, a magnitude 4.5 (4.5 MB) earthquake occurred 67.7 miles away from the city center On 4/29/2003 at 08:59:39, a magnitude 4.6 (4.6 MW, Depth: 12.3 mi) earthquake occurred 90.0 miles away from Irondale center On 10/24/1997 at 08:35:17, a magnitude 4.9 (4.8 MB, 4.2 MS, 4.9 LG, Depth: 6.2 mi) earthquake occurred 170.1 miles away from Irondale center On 11/7/2004 at 11:20:21, a magnitude 4.3 (4.3 MW, Depth: 3.1 mi) earthquake occurred 94.6 miles away from the city center Magnitude types: regional Lg-wave magnitude (LG), body-wave magnitude (MB), surface-wave magnitude (MS), moment magnitude (MW) Natural disasters: The number of natural disasters in Jefferson County (32) is a lot greater than the US average (15).Major Disasters (Presidential) Declared: 24Emergencies Declared: 6Storms: 18, Tornadoes: 16, Floods: 14, Hurricanes: 6, Winds: 6, Drought: 1, Fire: 1, Heavy Rain: 1, Snowfall: 1, Winter Storm: 1, Other: 1 (Note: some incidents may be assigned to more than one category). Hospitals and medical centers in Irondale: TENDER LOVING CARE (1900 CRESTWOOD BLVD, 1900 BLDG, SUITE 95)
Other hospitals and medical centers near Irondale: INTREPID USA HEALTHCARE SERVICES (Home Health Center, about 2 miles away; BIRMINGHAM, AL)
ST MARTIN'S IN THE PINES (Nursing Home, about 2 miles away; BIRMINGHAM, AL)
FAIR HAVEN RETIREMENT CENTER (Nursing Home, about 3 miles away; BIRMINGHAM, AL)
KIRKWOOD BY THE RIVER (Nursing Home, about 4 miles away; BIRMINGHAM, AL)
CARE FIRST HOME HEALTH OF JEFFERSON COUNTY (Home Health Center, about 4 miles away; HOOVER, AL)
DCI BIRMINGHAM (Dialysis Facility, about 4 miles away; BIRMINGHAM, AL)
TRINITY MEDICAL CENTER (about 4 miles away; BIRMINGHAM, AL)
Amtrak station near Irondale: 8 miles: BIRMINGHAM (1819 MORRIS AVE.) Services: ticket office, partially wheelchair accessible, enclosed waiting area, public restrooms, public payphones, vending machines, paid short-term parking, paid long-term parking, call for taxi service.
Colleges/universities with over 2000 students nearest to Irondale:
University of Alabama at Birmingham (about 8 miles; Birmingham, AL ; Full-time enrollment: 14,853)
Samford University (about 8 miles; Birmingham, AL ; FT enrollment: 3,829)
Jefferson State Community College (about 9 miles; Birmingham, AL ; FT enrollment: 6,041)
Virginia College-Birmingham (about 9 miles; Birmingham, AL ; FT enrollment: 8,167)
Lawson State Community College-Birmingham Campus (about 13 miles; Birmingham, AL ; FT enrollment: 2,695)
University of Montevallo (about 32 miles; Montevallo, AL ; FT enrollment: 2,826)
George C Wallace State Community College-Hanceville (about 38 miles; Hanceville, AL ; FT enrollment: 4,486)
Public high school in Irondale:
Private high school in Irondale: JEFFERSON CHRISTIAN ACADEMY Students: 266, Location: 1500 HERITAGE PLACE DR, Grades: PK-12)
Public elementary/middle schools in Irondale:
See full list of schools located in Irondale Library in Irondale: IRONDALE PUBLIC LIBRARY Operating income: $350,481; Location: 105 TWENTIETH STREET SOUTH; 41,128 books ; 944 audio materials ; 1,666 video materials ; 81 state licensed databases ; 95 print serial subscriptions )
User-submitted facts and corrections:
Elementary Schools - Grantswood Community School (Students: 265; Location: 5110 Grantswood Road; Grades: K - 02)
Notable locations in Irondale: (A) , Mountain Brook Swim and Tennis Club (B) , Irondale City Hall (C) , Irondale Fire Department Station 1 (D) , Irondale Fire Department Station 2 (E) . Display/hide their locations on the map
Shopping Centers: (1) , Grants Mill Station Shopping Center (2) . Display/hide their locations on the map
Churches in Irondale include: (A) , Irondale Presbyterian Church (B) , First Pentecostal Holiness Church (C) , First Baptist Church of Irondale (D) , Bethel Church (E) , Mount Hebron Baptist Church (F) , Brookview Wesleyan Church (G) , Grantswood Baptist Church (H) . Display/hide their locations on the map
Reservoirs: (A) , Hall Lake (B) , Overton Lake (C) . Display/hide their locations on the map
Parks in Irondale include: (1) , Irondale Municipal Park (2) . Display/hide their locations on the map
Jefferson County has a predicted average indoor radon screening level between 2 and 4 pCi/L (pico curies per liter) - Moderate Potential Drinking water stations with addresses in Irondale that have no violations reported:
IRONDALE WATER SYSTEM (Population served: 8,492, Primary Water Source Type: Groundwater)
Average household size: This city:
2.4 peopleAlabama:
2.5 people
Percentage of family households: This city:
66.1%Whole state:
67.8%
Percentage of households with unmarried partners: This city:
4.7%Whole state:
4.7%
Likely homosexual households (counted as self-reported same-sex unmarried-partner households)
Lesbian couples: 0.4% of all households Gay men: 0.3% of all households
18 people in other noninstitutional facilities in 2010people in group homes for juveniles (non-correctional) in 2010People in group quarters in Irondale in 2000:
47 people in other noninstitutional group quarters
15 people in religious group quarters
9 people in other nonhousehold living situations
3 people in homes for the mentally retarded
Banks with branches in Irondale (2011 data):
Branch Banking and Trust Company: Eastwood Branch at 1500 Montclair Road, branch established on 1994/04/20. Info updated 2010/03/29: Bank assets: $168,867.6 mil, Deposits: $127,549.5 mil, headquarters in Winston Salem, NC, positive income , Commercial Lending Specialization, 1793 total offices , Holding Company: Bb&T Corporation
Regions Bank: Irondale Branch at 1845 Crestwood Boulevard, branch established on 1959/09/09. Info updated 2011/02/24: Bank assets: $123,368.2 mil, Deposits: $98,301.3 mil, headquarters in Birmingham, AL, positive income , Commercial Lending Specialization, 1778 total offices , Holding Company: Regions Financial Corporation
Wells Fargo Bank, National Association: Irondale Branch at 2880 Crestwood Boulevard, branch established on 1978/08/07. Info updated 2011/04/05: Bank assets: $1,161,490.0 mil, Deposits: $905,653.0 mil, headquarters in Sioux Falls, SD, positive income , 6395 total offices , Holding Company: Wells Fargo & Company
Beal Bank, SSB: Www.Umbrellabank.com at Www.Umbrellabank.com, branch established on 2004/08/01. Info updated 2011/10/26: Bank assets: $3,750.0 mil, Deposits: $2,445.6 mil, headquarters in Plano, TX, positive income , Mortgage Lending Specialization, 38 total offices
For population 15 years and over in Irondale:
Never married: 36.6%Now married: 42.0%Separated: 1.0%Widowed: 6.8%Divorced: 13.6% For population 25 years and over in Irondale:
High school or higher: 93.4%Bachelor's degree or higher: 40.4%Graduate or professional degree: 17.6%Unemployed: 2.7%Mean travel time to work (commute): 18.6 minutes
Education Gini index (Inequality in education) Here:
11.7Alabama average:
11.5
Religion statistics for Irondale, AL (based on Jefferson County data)
Religion Adherents Congregations Evangelical Protestant 308,984 710 Black Protestant 106,653 257 Mainline Protestant 67,037 150 Catholic 55,083 32 Other 13,073 45 Orthodox 1,424 4 None 106,212 -
Source: Clifford Grammich, Kirk Hadaway, Richard Houseal, Dale E.Jones, Alexei Krindatch, Richie Stanley and Richard H.Taylor. 2012. 2010 U.S.Religion Census: Religious Congregations & Membership Study. Association of Statisticians of American Religious Bodies. Jones, Dale E., et al. 2002. Congregations and Membership in the United States 2000. Nashville, TN: Glenmary Research Center. Graphs represent county-level data
Food Environment Statistics: Number of grocery stores : 135Here :
2.05 / 10,000 pop.State :
1.89 / 10,000 pop.
Number of supercenters and club stores : 12Here :
0.18 / 10,000 pop.Alabama :
0.20 / 10,000 pop.
Number of convenience stores (no gas) : 65This county :
0.99 / 10,000 pop.Alabama :
0.65 / 10,000 pop.
Number of convenience stores (with gas) : 380Jefferson County :
5.77 / 10,000 pop.Alabama :
6.32 / 10,000 pop.
Number of full-service restaurants : 357Here :
5.42 / 10,000 pop.Alabama :
5.75 / 10,000 pop.
Adult diabetes rate : This county :
12.4%Alabama :
11.8%
Adult obesity rate : This county :
31.1%Alabama :
31.7%
Low-income preschool obesity rate : This county :
12.0%Alabama :
13.5%
Health and Nutrition: Healthy diet rate : Irondale:
48.6%Alabama:
49.0%
Average overall health of teeth and gums : This city:
44.7%State:
45.7%
People feeling badly about themselves : People not drinking alcohol at all : Average hours sleeping at night : Overweight people : Irondale:
35.6%Alabama:
34.4%
General health condition : Irondale:
54.6%Alabama:
55.2%
Average condition of hearing : Irondale:
78.4%Alabama:
79.3%
More about Health and Nutrition of Irondale, AL Residents
Local government employment and payroll (March 2022)
Function
Full-time employees
Monthly full-time payroll
Average yearly full-time wage
Part-time employees
Monthly part-time payroll
Firefighters
50 $268,117 $64,348 0 $0 Police Protection - Officers
31 $165,582 $64,096 0 $0 Streets and Highways
14 $44,784 $38,386 0 $0 Financial Administration
12 $52,948 $52,948 0 $0 Other and Unallocable
11 $53,637 $58,513 2 $1,371 Solid Waste Management
11 $33,677 $36,739 0 $0 Other Government Administration
7 $43,125 $73,929 6 $10,345 Police - Other
7 $33,221 $56,950 0 $0 Water Supply
6 $22,756 $45,512 0 $0 Local Libraries
5 $25,154 $60,370 2 $2,026 Parks and Recreation
3 $12,391 $49,564 0 $0 Judicial and Legal
2 $11,517 $69,102 0 $0
Totals for Government
159 $766,909 $57,880 10 $13,742
Irondale government finances - Expenditure in 2021 (per resident):
Construction - General - Other: $1,373,000 ($102.72)
Water Utilities: $579,000 ($43.32)Current Operations - Local Fire Protection: $3,699,000 ($276.75)
Police Protection: $3,458,000 ($258.72)Solid Waste Management: $2,774,000 ($207.54)Financial Administration: $2,398,000 ($179.41)Water Utilities: $1,290,000 ($96.51)General - Other: $751,000 ($56.19)Central Staff Services: $536,000 ($40.10)Libraries: $525,000 ($39.28)Parks and Recreation: $289,000 ($21.62)General Public Buildings: $258,000 ($19.30)Judicial and Legal Services: $226,000 ($16.91)General - Interest on Debt: $1,492,000 ($111.63)
Other Capital Outlay - General - Other: $725,000 ($54.24)
Regular Highways: $163,000 ($12.20)Water Utilities - Interest on Debt: $211,000 ($15.79)
Irondale government finances - Revenue in 2021 (per resident):
Charges - Solid Waste Management: $979,000 ($73.25)
Other: $614,000 ($45.94)Local Intergovernmental - Other: $121,000 ($9.05)
Miscellaneous - Rents: $1,092,000 ($81.70)
Fines and Forfeits: $447,000 ($33.44)General Revenue - Other: $194,000 ($14.51)Interest Earnings: $132,000 ($9.88)Revenue - Water Utilities: $2,232,000 ($166.99)
State Intergovernmental - Other: $1,400,000 ($104.74)
General Local Government Support: $600,000 ($44.89)Tax - General Sales and Gross Receipts: $10,154,000 ($759.69)
Occupation and Business License - Other: $2,276,000 ($170.28)Property: $1,210,000 ($90.53)Public Utilities Sales: $1,091,000 ($81.63)Other Selective Sales: $780,000 ($58.36)Other: $264,000 ($19.75)Motor Fuels Sales: $236,000 ($17.66)Other License: $181,000 ($13.54)Motor Vehicle License: $129,000 ($9.65)Alcoholic Beverage Sales: $46,000 ($3.44)Tobacco Products Sales: $9,000 ($0.67)
Irondale government finances - Debt in 2021 (per resident):
Long Term Debt - Beginning Outstanding - Unspecified Public Purpose: $45,500,000 ($3404.16)
Outstanding Unspecified Public Purpose: $42,793,000 ($3201.63)Retired Unspecified Public Purpose: $2,707,000 ($202.53)
Irondale government finances - Cash and Securities in 2021 (per resident):
Other Funds - Cash and Securities: $16,783,000 ($1255.65)
6.20% of this county's 2020 resident taxpayers moved to other counties in 2021 ($76,918 average adjusted gross income )
Here:
6.20%Alabama average:
6.41%
0.01% of residents moved to foreign countries ($73 average AGI )Jefferson County:
0.01%Alabama average:
0.02%
Top counties to which taxpayers relocated from this county between 2020 and 2021:
Businesses in Irondale, AL
Name Count Name Count
Audi 1 Penske 1 BMW 1 Sam's Club 1 Chick-Fil-A 1 T-Mobile 2 FedEx 4 U-Haul 1 Kincaid 1 Waffle House 1 La-Z-Boy 1 Walmart 1 McDonald's 1
Strongest AM radio stations in Irondale:
WLPH (1480 AM; daytime; 5 kW; IRONDALE, AL; Owner: BIRMINGHAM CHRISTIAN RADIO, INC.)
WDJC (850 AM; 50 kW; BIRMINGHAM, AL; Owner: KIMTRON, INC.)
WJOX (690 AM; 50 kW; BIRMINGHAM, AL; Owner: CITADEL BROADCASTING COMPANY)
WAPI (1070 AM; 50 kW; BIRMINGHAM, AL; Owner: CITADEL BROADCASTING COMPANY)
WYDE (1260 AM; 5 kW; BIRMINGHAM, AL; Owner: KIMTRON, INC.)
WERC (960 AM; 5 kW; BIRMINGHAM, AL; Owner: CAPSTAR TX LIMITED PARTNERSHIP)
WRJS (1320 AM; 5 kW; BIRMINGHAM, AL; Owner: CXR HOLDINGS, INC.)
WNSI (810 AM; 50 kW; JACKSONVILLE, AL; Owner: UNITED BROADCASTING NETWORK, INC.)
WATV (900 AM; 1 kW; BIRMINGHAM, AL)
WAYE (1220 AM; 1 kW; BIRMINGHAM, AL; Owner: BIRMINGHAM CHRISTIAN RADIO, INC.)
WFHK (1430 AM; 5 kW; PELL CITY, AL; Owner: STOCKS BROADCASTING, INC.)
WURL (760 AM; daytime; 1 kW; MOODY, AL; Owner: THE BILL DAVISON EVANGELISTIC ASSOC)
WKNG (1060 AM; daytime; 50 kW; TALLAPOOSA, GA; Owner: WKNG, INC.)
Strongest FM radio stations in Irondale:
WENN (105.9 FM; TRUSSVILLE, AL; Owner: CAPSTAR TX LIMITED PARTNERSHIP)
WBPT (106.9 FM; BIRMINGHAM, AL; Owner: CXR HOLDINGS, INC.)
WBHK (98.7 FM; WARRIOR, AL; Owner: CXR HOLDINGS, INC.)
WBHM (90.3 FM; BIRMINGHAM, AL; Owner: BD OF TRUSTEES/U OF AL AT BIRMINGHAM)
WZZK-FM (104.7 FM; BIRMINGHAM, AL; Owner: CXR HOLDINGS, INC.)
WODL (97.3 FM; HOMEWOOD, AL; Owner: CXR HOLDINGS, INC.)
WYSF (94.5 FM; BIRMINGHAM, AL; Owner: CITADEL BROADCASTING COMPANY)
WGIB (91.9 FM; BIRMINGHAM, AL; Owner: GLEN IRIS BAPTIST SCHOOL)
WBFR (89.5 FM; BIRMINGHAM, AL; Owner: FAMILY STATIONS, INC.)
WRAX (107.7 FM; BIRMINGHAM, AL; Owner: CITADEL BROADCASTING COMPANY)
WMJJ (96.5 FM; BIRMINGHAM, AL; Owner: CAPSTAR TX LIMITED PARTNERSHIP)
WQEN (103.7 FM; GADSDEN, AL; Owner: CAPSTAR TX LIMITED PARTNERSHIP)
WDJC-FM (93.7 FM; BIRMINGHAM, AL; Owner: KIMTRON, INC.)
WZRR (99.5 FM; BIRMINGHAM, AL; Owner: CITADEL BROADCASTING COMPANY)
WVSU-FM (91.1 FM; BIRMINGHAM, AL; Owner: SAMFORD UNIVERSITY)
WLJR (88.5 FM; BIRMINGHAM, AL; Owner: BRIARWOOD PRESBYTERIAN CHURCH)
W281AB (104.1 FM; MOUNTAIN BROOK, AL; Owner: FAMILY STATIONS, INC.)
WDXB (102.5 FM; JASPER, AL; Owner: CAPSTAR TX LIMITED PARTNERSHIP)
WJSR (91.1 FM; BIRMINGHAM, AL; Owner: JEFFERSON STATE COMMUNITY COLLEGE)
WYDE-FM (101.1 FM; CULLMAN, AL; Owner: KIMTRON, INC.)
TV broadcast stations around Irondale:
WBRC (Channel 6; BIRMINGHAM, AL; Owner: WBRC LICENSE, INC.)
WVTM-TV (Channel 13; BIRMINGHAM, AL; Owner: BIRMINGHAM BROADCASTING (WVTM-TV), LLC)
WIAT (Channel 42; BIRMINGHAM, AL; Owner: MEDIA GENERAL COMMUNICATIONS, INC.)
WBIQ (Channel 10; BIRMINGHAM, AL; Owner: ALABAMA EDUCATIONAL TELEVISION COMMISSION)
WTTO (Channel 21; HOMEWOOD, AL; Owner: WTTO LICENSEE, LLC)
WABM (Channel 68; BIRMINGHAM, AL; Owner: BIRMINGHAM (WABM-TV) LICENSEE, INC.)
W27CM (Channel 27; BIRMINGHAM, AL; Owner: EQUITY BROADCASTING CORPORATION)
W46DK (Channel 46; BIRMINGHAM, AL; Owner: TRINITY BROADCASTING NETWORK)
WBXA-CA (Channel 2; BIRMINGHAM, AL; Owner: THE BOX WORLDWIDE LLC)
W34BI (Channel 34; BIRMINGHAM, AL; Owner: VENTANA TELEVISION, INC.)
WBMA-LP (Channel 58; BIRMINGHAM, AL; Owner: TV ALABAMA, INC.)
WDBB (Channel 17; BESSEMER, AL; Owner: WDBB-TV, INC.)
WCFT-TV (Channel 33; TUSCALOOSA, AL; Owner: TV ALABAMA, INCORPORATED)
WJSU-TV (Channel 40; ANNISTON, AL; Owner: TV ALABAMA, INC.)
W49AY (Channel 49; BIRMINGHAM, AL; Owner: GLEN IRIS BAPTIST SCHOOL)
WTJP (Channel 60; GADSDEN, AL; Owner: TRINITY BROADCASTING NETWORK)
W62BG (Channel 62; BIRMINGHAM, AL; Owner: WTTO LICENSEE, LLC)
WPXH (Channel 44; GADSDEN, AL; Owner: PAXSON COMMUNICATIONS LICENSE COMPANY, LLC)
WBMG-LP (Channel 38; MOODY, AL; Owner: TIGER EYE BROADCASTING CORPORATION)
National Bridge Inventory (NBI) Statistics 53 Number of bridges1,020ft / 311m Total length $151,398,000 Total costs1,544,010 Total average daily traffic235,940 Total average daily truck traffic
New bridges - historical statistics
1 1900-1909 1 1930-1939 1 1950-1959 3 1960-1969 5 1970-1979 41 1980-1989 1 1990-1999
See full National Bridge Inventory statistics for Irondale, AL
Home Mortgage Disclosure Act Aggregated Statistics For Year 2009(Based on 6 partial tracts) A) FHA, FSA/RHS & VA B) Conventional C) Refinancings D) Home Improvement Loans F) Non-occupant Loans on G) Loans On Manufactured Number Average Value Number Average Value Number Average Value Number Average Value Number Average Value Number Average Value
LOANS ORIGINATED 19 $141,353 31 $240,748 171 $240,266 4 $187,068 3 $104,507 0 $0 APPLICATIONS APPROVED, NOT ACCEPTED 1 $55,660 1 $310,720 12 $239,577 1 $45,370 0 $0 0 $0 APPLICATIONS DENIED 5 $122,510 4 $172,160 44 $178,284 7 $38,504 1 $27,320 1 $14,100 APPLICATIONS WITHDRAWN 3 $113,940 6 $172,747 44 $229,753 2 $110,360 2 $284,370 0 $0 FILES CLOSED FOR INCOMPLETENESS 1 $186,870 1 $344,520 13 $185,954 1 $74,070 0 $0 0 $0
Aggregated Statistics For Year 2008(Based on 6 partial tracts) A) FHA, FSA/RHS & VA B) Conventional C) Refinancings D) Home Improvement Loans F) Non-occupant Loans on G) Loans On Manufactured Number Average Value Number Average Value Number Average Value Number Average Value Number Average Value Number Average Value
LOANS ORIGINATED 17 $138,243 44 $282,727 86 $209,340 9 $56,422 10 $113,873 0 $0 APPLICATIONS APPROVED, NOT ACCEPTED 1 $153,150 4 $188,828 14 $195,739 1 $37,430 0 $0 0 $0 APPLICATIONS DENIED 5 $131,398 7 $126,186 48 $163,889 10 $49,626 1 $66,720 2 $39,970 APPLICATIONS WITHDRAWN 2 $168,810 5 $243,440 27 $208,819 1 $103,370 2 $327,680 0 $0 FILES CLOSED FOR INCOMPLETENESS 1 $150,050 3 $170,880 8 $271,970 1 $101,020 1 $147,720 0 $0
Aggregated Statistics For Year 2007(Based on 6 partial tracts) A) FHA, FSA/RHS & VA B) Conventional C) Refinancings D) Home Improvement Loans F) Non-occupant Loans on G) Loans On Manufactured Number Average Value Number Average Value Number Average Value Number Average Value Number Average Value Number Average Value
LOANS ORIGINATED 9 $117,376 104 $228,444 110 $255,935 14 $54,815 12 $123,024 0 $0 APPLICATIONS APPROVED, NOT ACCEPTED 0 $0 7 $193,901 26 $186,018 2 $174,965 1 $181,290 0 $0 APPLICATIONS DENIED 0 $0 16 $150,864 65 $165,396 19 $43,492 5 $97,034 1 $61,040 APPLICATIONS WITHDRAWN 1 $89,600 14 $209,968 35 $269,219 5 $76,712 3 $206,577 0 $0 FILES CLOSED FOR INCOMPLETENESS 0 $0 5 $193,906 13 $189,457 1 $10,190 1 $113,940 0 $0
Aggregated Statistics For Year 2006(Based on 6 partial tracts) A) FHA, FSA/RHS & VA B) Conventional C) Refinancings D) Home Improvement Loans F) Non-occupant Loans on G) Loans On Manufactured Number Average Value Number Average Value Number Average Value Number Average Value Number Average Value Number Average Value
LOANS ORIGINATED 3 $138,740 99 $198,391 113 $170,317 16 $60,130 14 $139,411 0 $0 APPLICATIONS APPROVED, NOT ACCEPTED 0 $0 12 $156,289 22 $128,239 3 $92,440 1 $85,480 0 $0 APPLICATIONS DENIED 1 $139,460 22 $175,691 75 $123,790 18 $47,967 3 $144,433 1 $62,060 APPLICATIONS WITHDRAWN 1 $99,630 16 $171,669 46 $150,251 3 $77,450 4 $106,248 0 $0 FILES CLOSED FOR INCOMPLETENESS 1 $56,900 10 $146,803 16 $175,023 1 $88,400 2 $101,940 0 $0
Aggregated Statistics For Year 2005(Based on 6 partial tracts) A) FHA, FSA/RHS & VA B) Conventional C) Refinancings D) Home Improvement Loans F) Non-occupant Loans on G) Loans On Manufactured Number Average Value Number Average Value Number Average Value Number Average Value Number Average Value Number Average Value
LOANS ORIGINATED 6 $143,605 129 $182,201 136 $199,605 10 $52,749 14 $117,221 0 $0 APPLICATIONS APPROVED, NOT ACCEPTED 0 $0 12 $151,555 25 $129,437 4 $45,245 3 $96,577 1 $26,850 APPLICATIONS DENIED 1 $83,460 30 $129,491 71 $154,813 15 $55,123 4 $123,822 5 $34,632 APPLICATIONS WITHDRAWN 0 $0 33 $130,456 60 $162,322 10 $216,716 4 $131,910 0 $0 FILES CLOSED FOR INCOMPLETENESS 0 $0 6 $133,657 15 $197,945 3 $42,100 0 $0 0 $0
Aggregated Statistics For Year 2004(Based on 6 partial tracts) A) FHA, FSA/RHS & VA B) Conventional C) Refinancings D) Home Improvement Loans F) Non-occupant Loans on G) Loans On Manufactured Number Average Value Number Average Value Number Average Value Number Average Value Number Average Value Number Average Value
LOANS ORIGINATED 8 $122,528 114 $196,643 151 $171,454 13 $73,123 16 $109,051 0 $0 APPLICATIONS APPROVED, NOT ACCEPTED 0 $0 13 $156,056 29 $124,337 2 $37,090 1 $88,850 2 $46,630 APPLICATIONS DENIED 4 $97,710 23 $130,206 76 $137,802 14 $25,457 3 $63,753 4 $84,298 APPLICATIONS WITHDRAWN 0 $0 12 $151,722 50 $138,954 5 $53,644 2 $109,775 0 $0 FILES CLOSED FOR INCOMPLETENESS 0 $0 5 $194,316 33 $163,644 1 $32,520 1 $82,890 0 $0
Aggregated Statistics For Year 2003(Based on 6 partial tracts) A) FHA, FSA/RHS & VA B) Conventional C) Refinancings D) Home Improvement Loans E) Loans on Dwellings For 5+ Families F) Non-occupant Loans on Number Average Value Number Average Value Number Average Value Number Average Value Number Average Value Number Average Value
LOANS ORIGINATED 15 $108,816 105 $164,768 334 $175,417 10 $43,953 1 $540,500 13 $103,618 APPLICATIONS APPROVED, NOT ACCEPTED 0 $0 15 $167,205 38 $131,257 5 $46,150 0 $0 2 $64,875 APPLICATIONS DENIED 4 $91,450 18 $116,307 96 $114,333 12 $45,207 0 $0 4 $87,710 APPLICATIONS WITHDRAWN 1 $77,480 10 $142,673 62 $132,570 3 $94,340 0 $0 1 $79,780 FILES CLOSED FOR INCOMPLETENESS 0 $0 4 $137,322 14 $151,386 1 $42,090 0 $0 0 $0
Aggregated Statistics For Year 2002(Based on 6 partial tracts) A) FHA, FSA/RHS & VA B) Conventional C) Refinancings D) Home Improvement Loans F) Non-occupant Loans on Number Average Value Number Average Value Number Average Value Number Average Value Number Average Value
LOANS ORIGINATED 14 $108,931 87 $180,252 244 $170,689 10 $42,287 8 $90,029 APPLICATIONS APPROVED, NOT ACCEPTED 1 $71,900 7 $159,481 29 $136,741 2 $58,400 1 $30,780 APPLICATIONS DENIED 3 $129,350 10 $99,202 52 $118,914 13 $25,931 1 $33,930 APPLICATIONS WITHDRAWN 1 $134,040 10 $134,401 45 $113,701 3 $67,773 2 $90,955 FILES CLOSED FOR INCOMPLETENESS 0 $0 4 $142,672 15 $134,661 0 $0 1 $43,080
Aggregated Statistics For Year 2001(Based on 6 partial tracts) A) FHA, FSA/RHS & VA B) Conventional C) Refinancings D) Home Improvement Loans E) Loans on Dwellings For 5+ Families F) Non-occupant Loans on Number Average Value Number Average Value Number Average Value Number Average Value Number Average Value Number Average Value
LOANS ORIGINATED 17 $99,295 93 $154,449 200 $161,103 14 $53,893 1 $144,160 6 $84,815 APPLICATIONS APPROVED, NOT ACCEPTED 0 $0 9 $123,463 18 $112,648 3 $15,227 0 $0 2 $41,105 APPLICATIONS DENIED 1 $117,660 18 $63,594 57 $124,897 8 $14,490 0 $0 3 $53,153 APPLICATIONS WITHDRAWN 2 $84,085 5 $164,152 32 $127,700 1 $47,000 0 $0 0 $0 FILES CLOSED FOR INCOMPLETENESS 0 $0 4 $98,830 13 $111,461 0 $0 0 $0 1 $20,580
Aggregated Statistics For Year 2000(Based on 6 partial tracts) A) FHA, FSA/RHS & VA B) Conventional C) Refinancings D) Home Improvement Loans F) Non-occupant Loans on Number Average Value Number Average Value Number Average Value Number Average Value Number Average Value
LOANS ORIGINATED 18 $93,067 85 $160,876 51 $130,527 16 $44,646 4 $90,495 APPLICATIONS APPROVED, NOT ACCEPTED 1 $101,560 11 $169,392 9 $77,971 3 $68,170 1 $21,630 APPLICATIONS DENIED 1 $57,140 17 $75,979 41 $100,112 6 $15,925 1 $69,680 APPLICATIONS WITHDRAWN 1 $115,850 11 $156,079 14 $92,018 1 $27,210 2 $128,850 FILES CLOSED FOR INCOMPLETENESS 1 $33,370 5 $103,366 16 $80,798 1 $13,150 0 $0
Aggregated Statistics For Year 1999(Based on 6 partial tracts) A) FHA, FSA/RHS & VA B) Conventional C) Refinancings D) Home Improvement Loans F) Non-occupant Loans on Number Average Value Number Average Value Number Average Value Number Average Value Number Average Value
LOANS ORIGINATED 17 $92,709 100 $169,106 103 $127,880 13 $69,188 7 $107,537 APPLICATIONS APPROVED, NOT ACCEPTED 2 $77,085 9 $99,622 10 $99,399 2 $18,175 1 $58,170 APPLICATIONS DENIED 3 $89,023 27 $65,921 37 $75,724 13 $17,432 3 $66,313 APPLICATIONS WITHDRAWN 3 $107,313 11 $205,222 26 $100,191 1 $31,740 1 $75,250 FILES CLOSED FOR INCOMPLETENESS 1 $59,300 2 $108,805 10 $95,252 0 $0 0 $0
Detailed HMDA statistics for the following Tracts:
0108.03
, 0108.05 , 0126.02 , 0127.01
Private Mortgage Insurance Companies Aggregated Statistics For Year 2009(Based on 6 partial tracts) A) Conventional B) Refinancings Number Average Value Number Average Value
LOANS ORIGINATED 5 $209,010 3 $245,360 APPLICATIONS APPROVED, NOT ACCEPTED 0 $0 2 $178,105 APPLICATIONS DENIED 1 $202,910 1 $234,720 APPLICATIONS WITHDRAWN 1 $120,250 0 $0 FILES CLOSED FOR INCOMPLETENESS 0 $0 1 $127,620
Aggregated Statistics For Year 2008(Based on 6 partial tracts) A) Conventional B) Refinancings C) Non-occupant Loans on Number Average Value Number Average Value Number Average Value
LOANS ORIGINATED 13 $200,716 7 $174,646 1 $115,260 APPLICATIONS APPROVED, NOT ACCEPTED 4 $217,372 2 $239,330 0 $0 APPLICATIONS DENIED 1 $48,920 0 $0 0 $0 APPLICATIONS WITHDRAWN 0 $0 0 $0 0 $0 FILES CLOSED FOR INCOMPLETENESS 0 $0 1 $70,950 0 $0
Aggregated Statistics For Year 2007(Based on 6 partial tracts) A) Conventional B) Refinancings C) Non-occupant Loans on Number Average Value Number Average Value Number Average Value
LOANS ORIGINATED 32 $147,638 8 $144,385 3 $89,523 APPLICATIONS APPROVED, NOT ACCEPTED 4 $150,290 2 $155,280 1 $113,220 APPLICATIONS DENIED 1 $254,400 0 $0 0 $0 APPLICATIONS WITHDRAWN 2 $266,005 0 $0 0 $0 FILES CLOSED FOR INCOMPLETENESS 0 $0 0 $0 0 $0
Aggregated Statistics For Year 2006(Based on 6 partial tracts) A) Conventional B) Refinancings C) Non-occupant Loans on Number Average Value Number Average Value Number Average Value
LOANS ORIGINATED 17 $180,480 7 $154,739 1 $83,940 APPLICATIONS APPROVED, NOT ACCEPTED 4 $205,460 1 $306,160 0 $0 APPLICATIONS DENIED 1 $127,740 0 $0 0 $0 APPLICATIONS WITHDRAWN 1 $285,450 1 $47,680 0 $0 FILES CLOSED FOR INCOMPLETENESS 0 $0 0 $0 0 $0
Aggregated Statistics For Year 2005(Based on 6 partial tracts) A) Conventional B) Refinancings C) Non-occupant Loans on Number Average Value Number Average Value Number Average Value
LOANS ORIGINATED 18 $128,304 9 $163,389 2 $76,990 APPLICATIONS APPROVED, NOT ACCEPTED 1 $197,170 3 $140,673 0 $0 APPLICATIONS DENIED 0 $0 0 $0 0 $0 APPLICATIONS WITHDRAWN 3 $129,497 0 $0 1 $64,390 FILES CLOSED FOR INCOMPLETENESS 0 $0 0 $0 0 $0
Aggregated Statistics For Year 2004(Based on 6 partial tracts) A) Conventional B) Refinancings C) Non-occupant Loans on Number Average Value Number Average Value Number Average Value
LOANS ORIGINATED 16 $125,928 10 $123,454 2 $105,070 APPLICATIONS APPROVED, NOT ACCEPTED 2 $145,330 3 $144,433 0 $0 APPLICATIONS DENIED 1 $111,280 0 $0 0 $0 APPLICATIONS WITHDRAWN 0 $0 1 $161,880 0 $0 FILES CLOSED FOR INCOMPLETENESS 0 $0 0 $0 0 $0
Aggregated Statistics For Year 2003(Based on 6 partial tracts) A) Conventional B) Refinancings C) Non-occupant Loans on Number Average Value Number Average Value Number Average Value
LOANS ORIGINATED 22 $114,395 29 $141,727 2 $78,695 APPLICATIONS APPROVED, NOT ACCEPTED 3 $96,440 6 $140,495 1 $65,400 APPLICATIONS DENIED 0 $0 0 $0 0 $0 APPLICATIONS WITHDRAWN 1 $132,660 2 $93,600 0 $0 FILES CLOSED FOR INCOMPLETENESS 0 $0 0 $0 0 $0
Aggregated Statistics For Year 2002(Based on 6 partial tracts) A) Conventional B) Refinancings C) Non-occupant Loans on Number Average Value Number Average Value Number Average Value
LOANS ORIGINATED 21 $135,850 22 $155,370 1 $68,340 APPLICATIONS APPROVED, NOT ACCEPTED 2 $210,855 5 $95,272 0 $0 APPLICATIONS DENIED 1 $56,100 1 $97,890 0 $0 APPLICATIONS WITHDRAWN 2 $136,090 2 $72,520 0 $0 FILES CLOSED FOR INCOMPLETENESS 0 $0 0 $0 0 $0
Aggregated Statistics For Year 2001(Based on 6 partial tracts) A) Conventional B) Refinancings C) Non-occupant Loans on Number Average Value Number Average Value Number Average Value
LOANS ORIGINATED 22 $138,036 21 $141,717 1 $85,650 APPLICATIONS APPROVED, NOT ACCEPTED 2 $84,210 2 $116,880 0 $0 APPLICATIONS DENIED 1 $103,450 0 $0 1 $73,100 APPLICATIONS WITHDRAWN 1 $94,390 0 $0 0 $0 FILES CLOSED FOR INCOMPLETENESS 0 $0 0 $0 0 $0
Aggregated Statistics For Year 2000(Based on 6 partial tracts) A) Conventional B) Refinancings Number Average Value Number Average Value
LOANS ORIGINATED 22 $120,419 5 $144,980 APPLICATIONS APPROVED, NOT ACCEPTED 2 $144,465 1 $47,960 APPLICATIONS DENIED 2 $55,590 0 $0 APPLICATIONS WITHDRAWN 0 $0 1 $70,120 FILES CLOSED FOR INCOMPLETENESS 0 $0 0 $0
Aggregated Statistics For Year 1999(Based on 6 partial tracts) A) Conventional B) Refinancings C) Non-occupant Loans on Number Average Value Number Average Value Number Average Value
LOANS ORIGINATED 24 $147,298 8 $98,710 1 $67,910 APPLICATIONS APPROVED, NOT ACCEPTED 1 $248,410 1 $64,980 0 $0 APPLICATIONS DENIED 1 $152,480 0 $0 0 $0 APPLICATIONS WITHDRAWN 1 $211,380 0 $0 0 $0 FILES CLOSED FOR INCOMPLETENESS 0 $0 0 $0 0 $0
Detailed PMIC statistics for the following Tracts:
0108.03
, 0108.05 , 0126.02 , 0127.01 Fire-safe hotels and motels in Irondale, Alabama:
Siesta Motel Inc, 2510 Crestwood Blvd, Irondale, Alabama 35210 Phone: (205) 956-1400
Holiday Inn Express Hotel & Suites, 811 Old Grants Mill Rd, Irondale, Alabama 35210 Phone: (205) 957-0555, Fax: (205) 957-0559
All 2 fire-safe hotels and motels in Irondale, Alabama Irondale compared to Alabama state average:
Unemployed percentage significantly below state average. Black race population percentage above state average. Median age below state average. Foreign-born population percentage above state average. Length of stay since moving in significantly above state average. Percentage of population with a bachelor's degree or higher above state average.
#45 on the list of "Top 101 cities with the most residents born in Other Southern Europe (population 500+)"
#61 on the list of "Top 101 cities with the most full-time firefighters per 1000 residents (population 5,000+)"
#72 on the list of "Top 101 cities with the most residents born in Syria (population 500+)"
#5 on the list of "Top 101 counties with the highest number of infant deaths per 1000 residents 2007-2013 (pop. 50,000+)"
#5 on the list of "Top 101 counties with the most Black Protestant adherents"
#5 on the list of "Top 101 counties with the most Black Protestant congregations"
#9 on the list of "Top 101 counties with the highest average weight of females"
#9 on the list of "Top 101 counties with the most Evangelical Protestant adherents"
Top Patent Applicants
Anita T. Fowler (3)
Scott D. Green (2)
Eric Vickery (2)
Jacob A. Nelson (1)
Michael J. Passineau (1)
Total of 9 patent applications in 2008-2024.
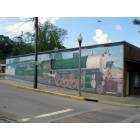
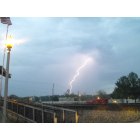


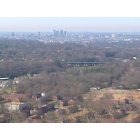

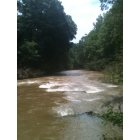
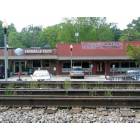
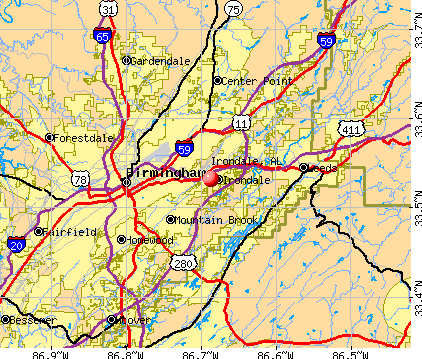


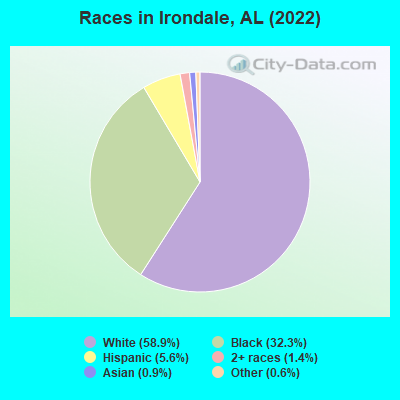
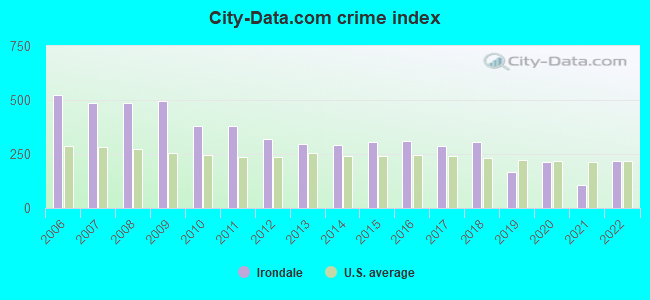
 Recent articles from our blog. Our writers, many of them Ph.D. graduates or candidates, create easy-to-read articles on a wide variety of topics.

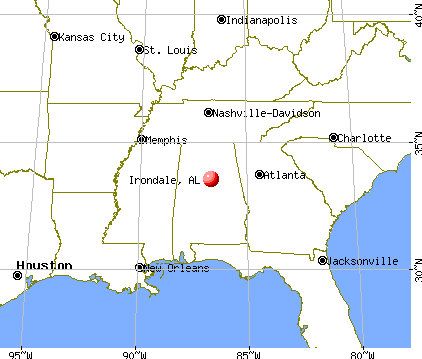
 (7.3 miles
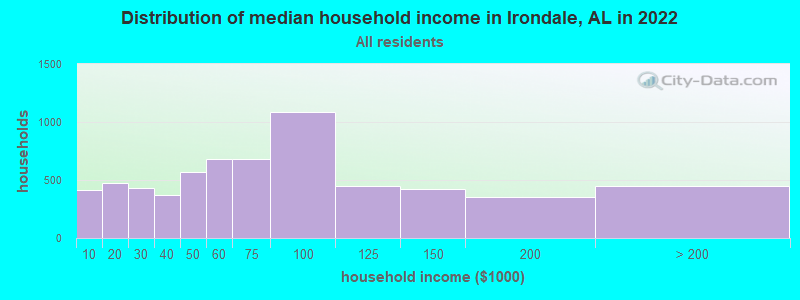
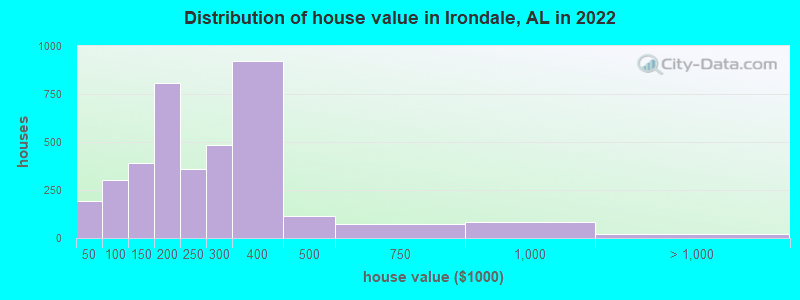

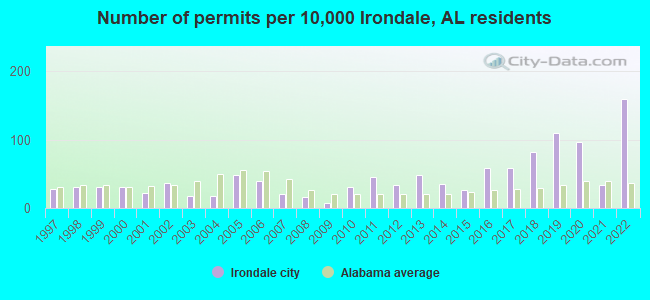
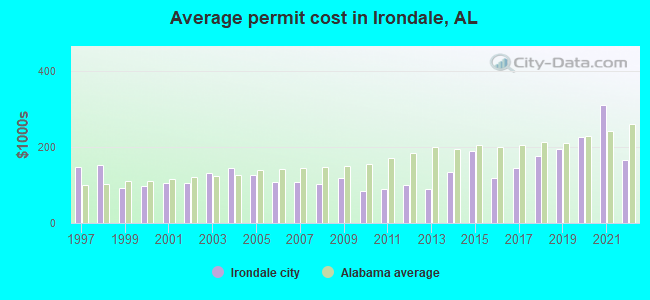
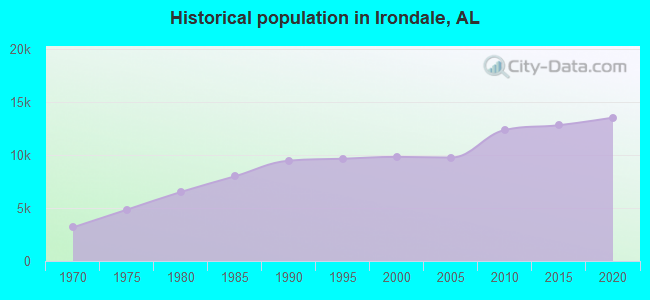
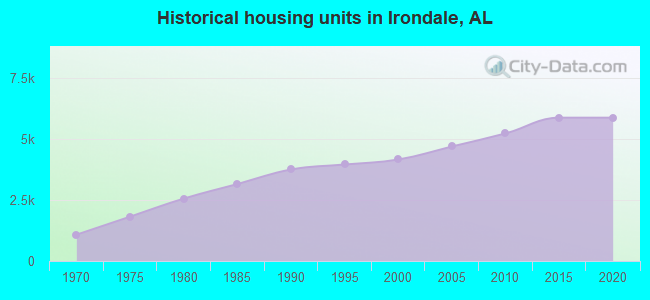
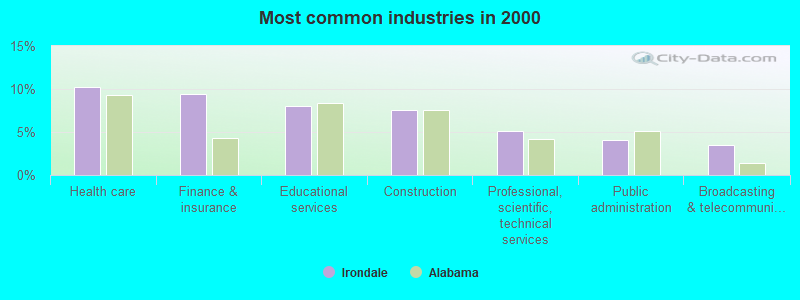
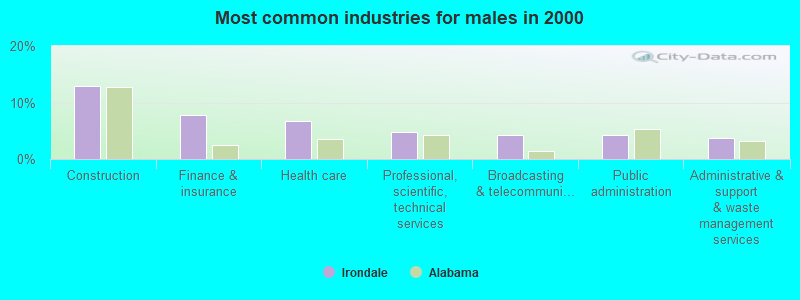
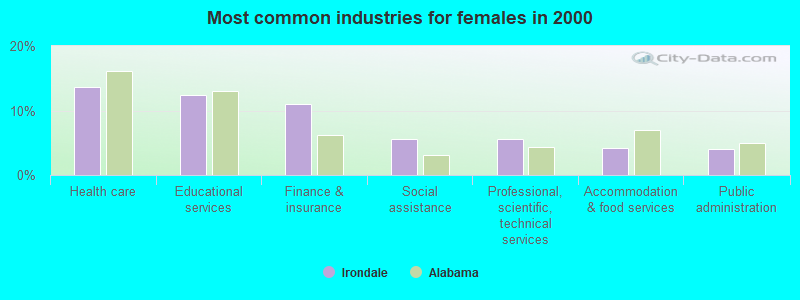
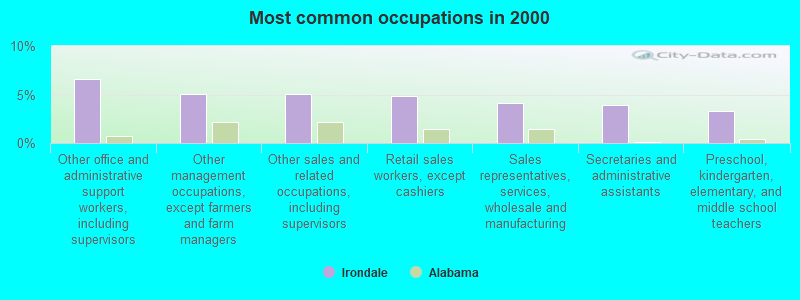
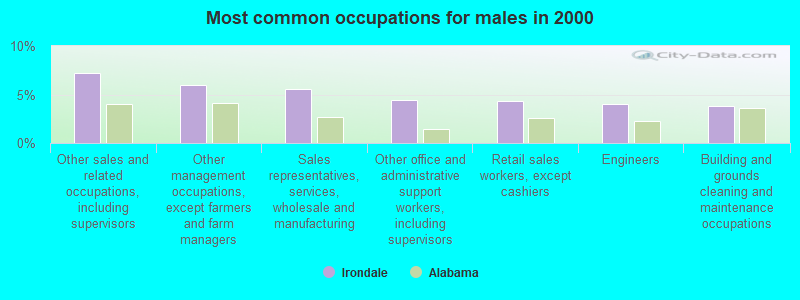
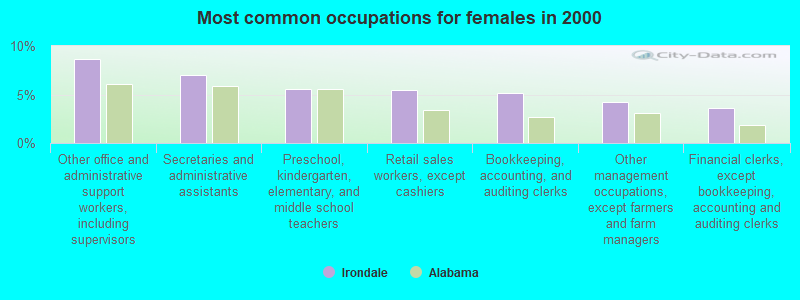


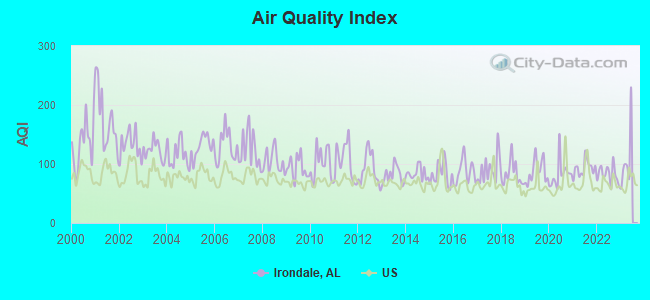
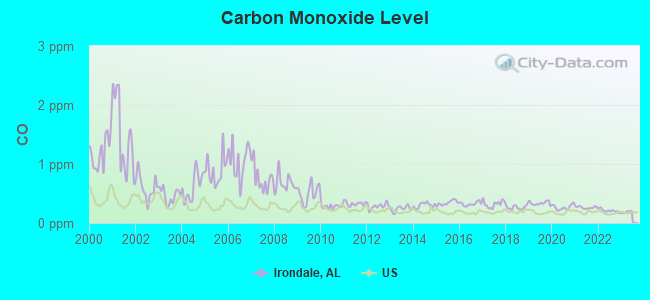
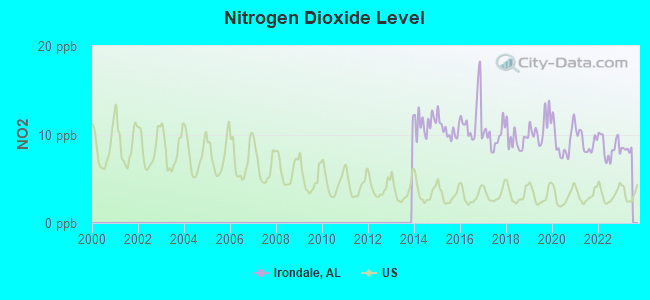
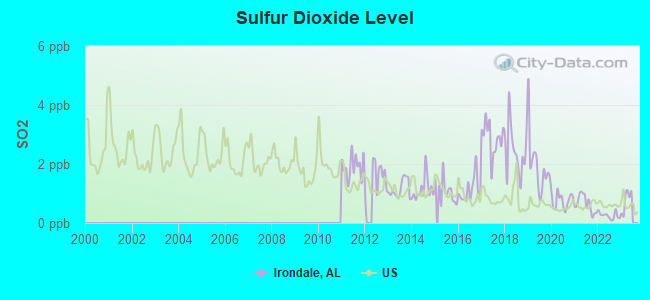
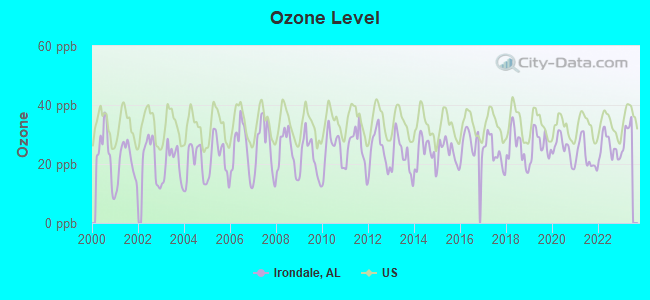
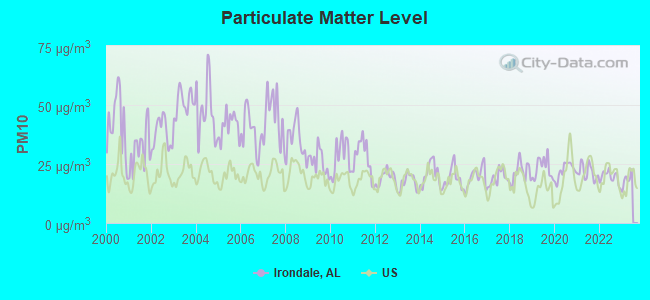
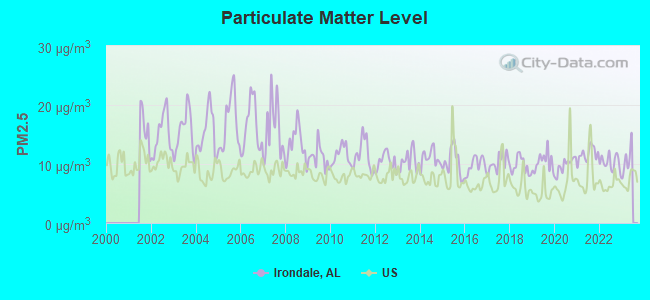
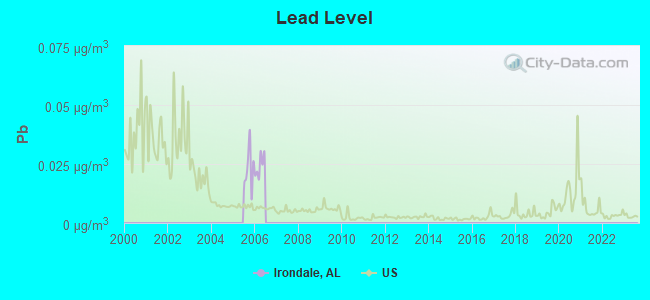

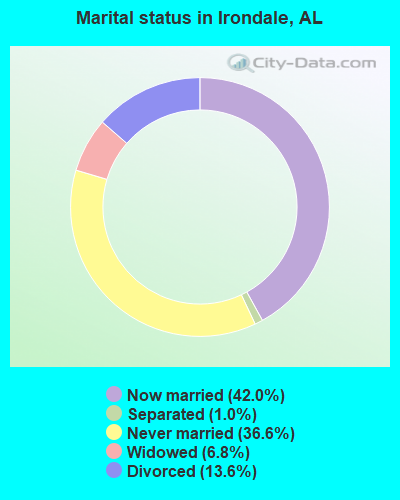
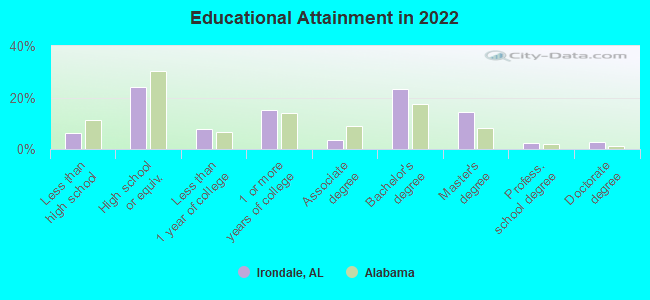
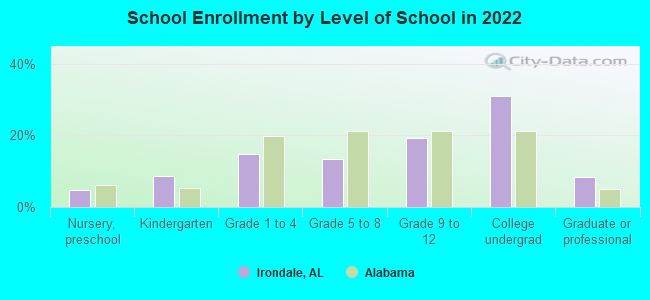
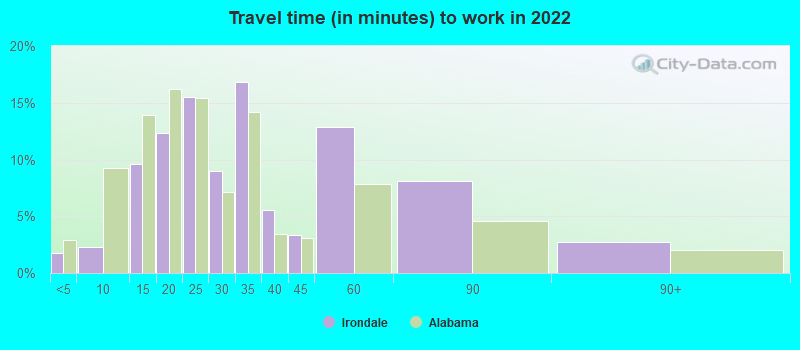
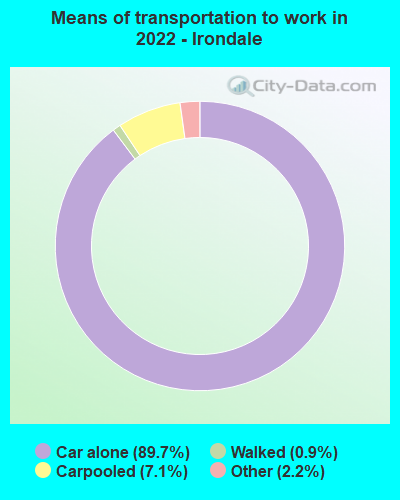
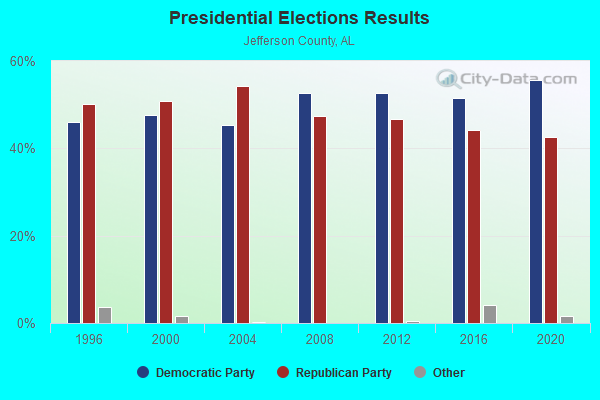
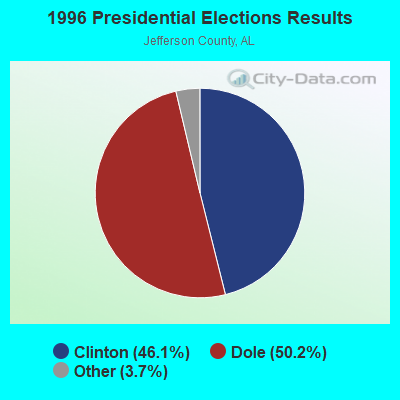
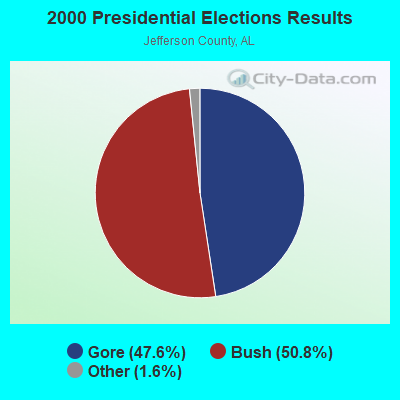
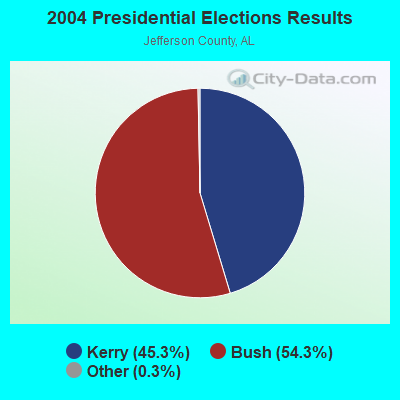
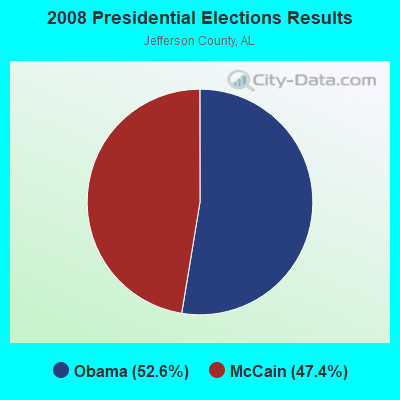
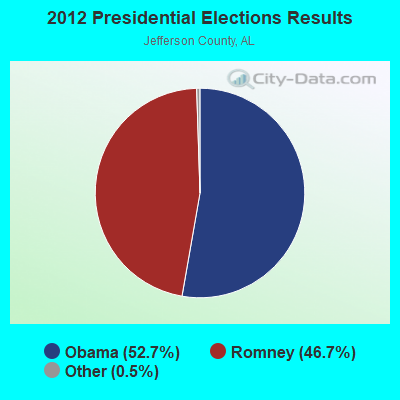
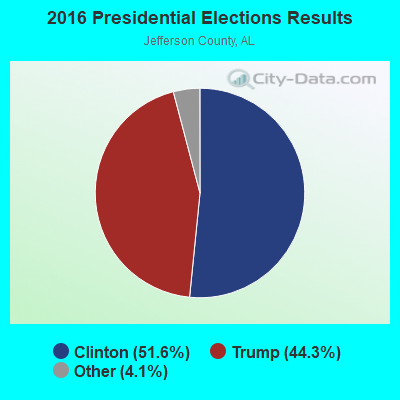
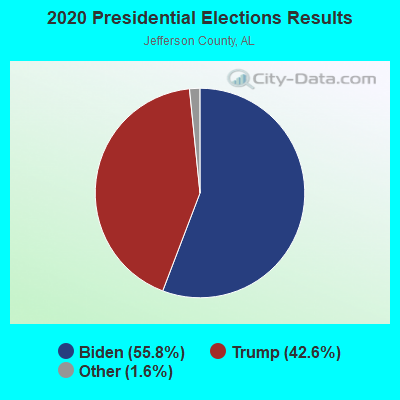
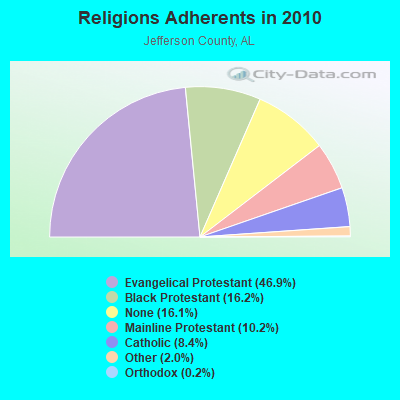
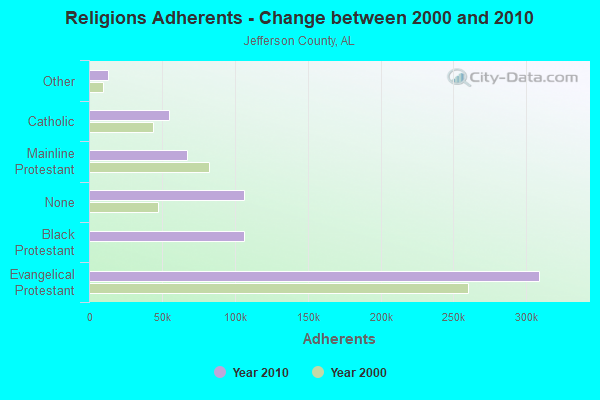
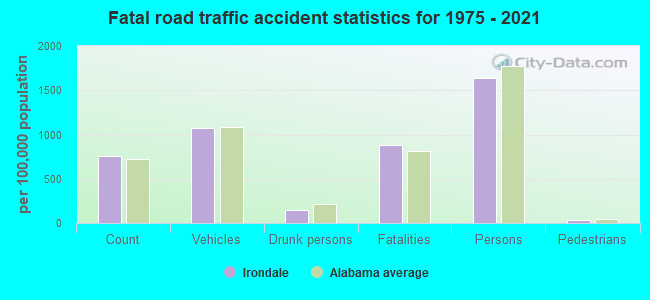
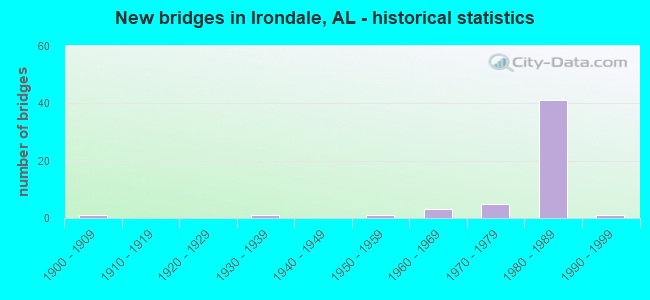
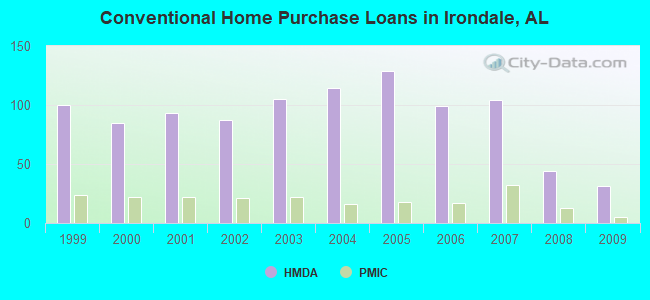
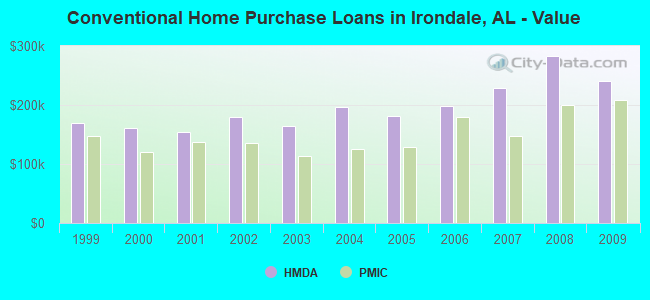
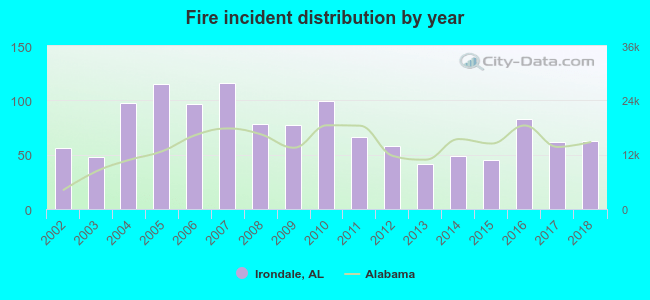 According to the data from the years 2002 - 2018 the average number of fire incidents per year is 74. The highest number of fires - 116 took place in 2007, and the least - 41 in 2013. The data has a growing trend.
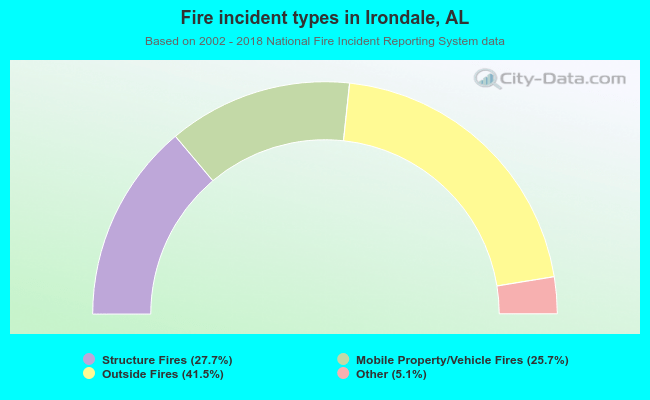 When looking into fire subcategories, the most incidents belonged to: Outside Fires (41.5%), and Structure Fires (27.7%).