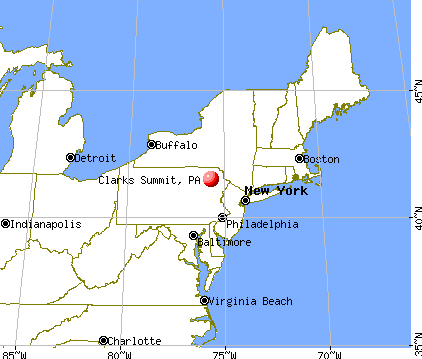
Clarks Summit, Pennsylvania
Submit your own pictures of this borough and show them to the world
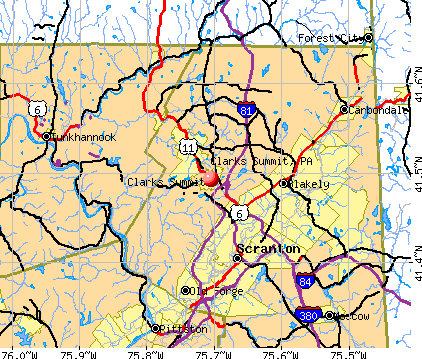
- OSM Map
- General Map
- Google Map
- MSN Map
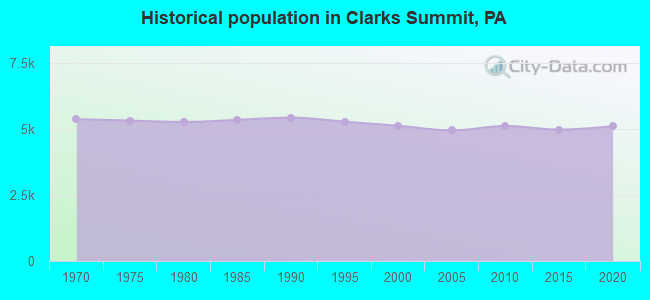
Population change since 2000: -1.2%
 |
| Males: 2,417 | |
| Females: 2,648 |
| Median resident age: | 44.4 years |
| Pennsylvania median age: | 40.9 years |
Zip codes: 18411.
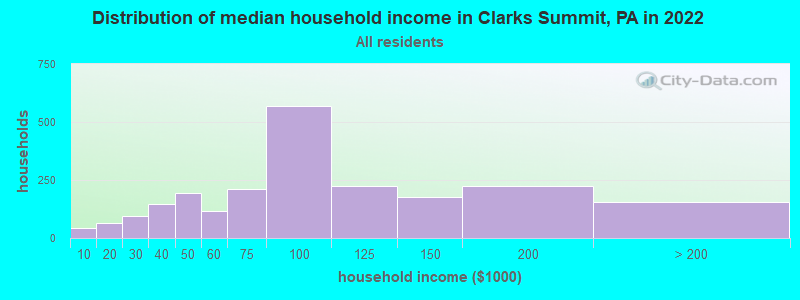
| Clarks Summit: | $83,867 |
| PA: | $71,798 |
Estimated per capita income in 2022: $49,985 (it was $25,080 in 2000)
Clarks Summit borough income, earnings, and wages data
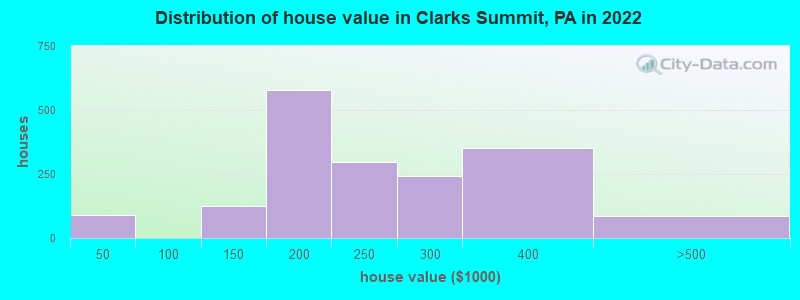
Estimated median house or condo value in 2022: $223,135 (it was $119,600 in 2000)
| Clarks Summit: | $223,135 |
| PA: | $245,500 |
Mean prices in 2022: all housing units: $283,743; detached houses: $278,648; townhouses or other attached units: $473,590; in 2-unit structures: $207,747
Median gross rent in 2022: $1,101.
Detailed information about poverty and poor residents in Clarks Summit, PA

Compare current foreclosures near Clarks Summit, PA:
| Photo | Address | Area | Beds / Baths | Price | Details |
|---|---|---|---|---|---|

|
#1
Burcher Ave
Clarks Summit, PA 18411
|
1,800 sq. feet
|
2 baths 3 beds |
$445,500
|
show details |

|
#2
Evergreen Dr
Clarks Summit, PA 18411
|
1,100 sq. feet
|
1 baths 3 beds |
show details | |

|
#3
Shady Lane Rd
Clarks Summit, PA 18411
|
2,648 sq. feet
|
2 baths 5 beds |
show details | |

|
#4
Griffin Pond Rd
Clarks Summit, PA 18411
|
- sq. feet
|
2 baths 3 beds |
show details | |

|
#5
Highland Ave # 1
Clarks Summit, PA 18411
|
- sq. feet
|
- baths - beds |
show details | |

|
#6
Ransom Rd
Clarks Summit, PA 18411
|
- sq. feet
|
- baths - beds |
show details | |

|
#7
Johnson Rd
Clarks Summit, PA 18411
|
- sq. feet
|
- baths - beds |
show details | |

|
#8
S Lakeview Dr
Clarks Summit, PA 18411
|
- sq. feet
|
- baths - beds |
show details | |

|
#9
Nichols St
Clarks Summit, PA 18411
|
- sq. feet
|
- baths - beds |
show details | |

|
#10
909 Walnut Street
Clarks Summit, PA 18411
|
- sq. feet
|
- baths - beds |
show details |
| Photo | Address | Area | Beds / Baths | Price | Details |
|---|---|---|---|---|---|

|
#11
Fairview Ave
Clarks Summit, PA 18411
|
- sq. feet
|
- baths - beds |
show details | |

|
#12
Linden St Apt 115
Clarks Summit, PA 18411
|
- sq. feet
|
- baths - beds |
show details | |

|
#13
Allen St
Scranton, PA 18512
|
1,045 sq. feet
|
1 baths 2 beds |
$231,000
|
show details |

|
#14
W Harrison St
Tunkhannock, PA 18657
|
1,710 sq. feet
|
1 baths 3 beds |
$228,900
|
show details |

|
#15
Maple St
Scranton, PA 18505
|
1,500 sq. feet
|
1 baths 3 beds |
$195,500
|
show details |

|
#16
Dymond Hollow Rd
Falls, PA 18615
|
1,358 sq. feet
|
1 baths 3 beds |
$295,500
|
show details |

|
#17
Searle St
Pittston, PA 18640
|
1,176 sq. feet
|
1 baths 2 beds |
$169,900
|
show details |

|
#18
Liberty St
Pittston, PA 18641
|
960 sq. feet
|
1 baths 2 beds |
$152,500
|
show details |

|
#19
Cedar Ave
Scranton, PA 18505
|
1,500 sq. feet
|
1 baths 3 beds |
$26,900
|
show details |

|
#20
Carpenter Hill Rd
Clarks Summit, PA 18411
|
- sq. feet
|
- baths - beds |
show details |
| Photo | Address | Area | Beds / Baths | Price | Details |
|---|---|---|---|---|---|

|
#21
Skyline Dr N
Clarks Summit, PA 18411
|
- sq. feet
|
- baths - beds |
show details | |

|
#22
Sunset St
Clarks Summit, PA 18411
|
- sq. feet
|
- baths - beds |
show details | |

|
#23
Dragon Rd
Clarks Summit, PA 18411
|
- sq. feet
|
- baths - beds |
show details | |

|
#24
Maple Ave
Clarks Summit, PA 18411
|
- sq. feet
|
- baths - beds |
show details | |

|
#25
Raquels Way
Clarks Summit, PA 18411
|
- sq. feet
|
- baths - beds |
show details | |

|
#26
1/2 Tulip Cir
Clarks Summit, PA 18411
|
- sq. feet
|
- baths - beds |
show details | |

|
#27
E Grove St
Clarks Summit, PA 18411
|
- sq. feet
|
- baths - beds |
show details | |

|
#28
Parkland Dr
Clarks Summit, PA 18411
|
- sq. feet
|
- baths - beds |
show details | |

|
#29
Woodside Dr
Clarks Summit, PA 18411
|
- sq. feet
|
- baths - beds |
show details | |

|
#30
440
Clarks Summit, PA 18411
|
- sq. feet
|
- baths - beds |
show details |
| Photo | Address | Area | Beds / Baths | Price | Details |
|---|---|---|---|---|---|

|
#31
Summit Lake Rd
Clarks Summit, PA 18411
|
- sq. feet
|
- baths - beds |
show details | |

|
#32
Sunset St
Clarks Summit, PA 18411
|
- sq. feet
|
- baths - beds |
show details | |

|
#33
Cherry Hill Rd
Clarks Summit, PA 18411
|
- sq. feet
|
- baths - beds |
show details | |

|
#34
Shady Lane Rd
Clarks Summit, PA 18411
|
- sq. feet
|
- baths - beds |
show details | |

|
#35
Appletree Ln
Clarks Summit, PA 18411
|
- sq. feet
|
- baths - beds |
show details | |

|
#36
Chestnut St
Factoryville, PA 18419
|
- sq. feet
|
2 baths 2 beds |
$98,800
|
show details |

|
#37
Old Mill Rd
Dalton, PA 18414
|
- sq. feet
|
1 baths 2 beds |
$114,400
|
show details |

|
#38
2nd St
Wyoming, PA 18644
|
1,496 sq. feet
|
1 baths 3 beds |
show details | |

|
#39
Dixon Ave
Carbondale, PA 18407
|
1,616 sq. feet
|
2 baths 3 beds |
show details | |

|
#40
Anthracite St
Pittston, PA 18643
|
1,144 sq. feet
|
1 baths 3 beds |
show details |
| Photo | Address | Area | Beds / Baths | Price | Details |
|---|---|---|---|---|---|

|
#41
Van Leuven Rd
Lake Ariel, PA 18436
|
- sq. feet
|
2 baths 3 beds |
show details | |

|
#42
Salem Rd
Archbald, PA 18403
|
996 sq. feet
|
2 baths 2 beds |
show details | |

|
#43
N Sumner Ave
Scranton, PA 18508
|
1,025 sq. feet
|
1 baths 2 beds |
show details | |

|
#44
Sr 92 N
Tunkhannock, PA 18657
|
1 sq. feet
|
2 baths 2 beds |
show details | |

|
#45
Grace St
Scranton, PA 18509
|
1,220 sq. feet
|
2 baths 4 beds |
show details | |

|
#46
Circle Dr
Pittston, PA 18643
|
- sq. feet
|
1 baths 3 beds |
show details | |

|
#47
N Main Ave
Scranton, PA 18508
|
1,400 sq. feet
|
1 baths 3 beds |
show details | |

|
#48
Hamlin Hwy
Hamlin, PA 18427
|
1,180 sq. feet
|
1 baths 3 beds |
show details | |

|
#49
Main St
Peckville, PA 18452
|
1,768 sq. feet
|
1 baths 4 beds |
show details | |

|
Check over 1 million property listings on Foreclosure.com!
|
browse all offers | |||


- 4,33785.2%White alone
- 3757.4%Hispanic
- 2084.1%Two or more races
- 1783.5%Other race alone
- 120.2%Asian alone
- 30.06%American Indian alone
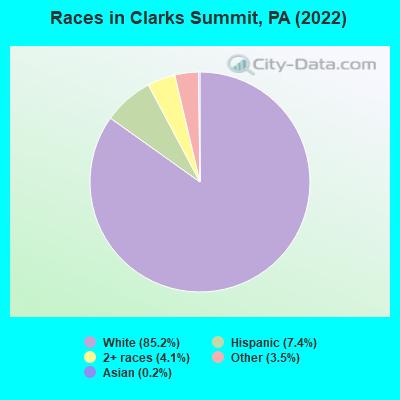
Races in Clarks Summit detailed stats: ancestries, foreign born residents, place of birth
According to our research of Pennsylvania and other state lists, there were 11 registered sex offenders living in Clarks Summit, Pennsylvania as of June 07, 2024.
The ratio of all residents to sex offenders in Clarks Summit is 458 to 1.
Type |
2009 |
2010 |
2011 |
2012 |
2013 |
2014 |
2015 |
2016 |
2017 |
2018 |
2019 |
2020 |
2022 |
|---|---|---|---|---|---|---|---|---|---|---|---|---|---|
| Murders (per 100,000) | 0 (0.0) | 0 (0.0) | 0 (0.0) | 0 (0.0) | 0 (0.0) | 0 (0.0) | 0 (0.0) | 0 (0.0) | 0 (0.0) | 0 (0.0) | 0 (0.0) | 0 (0.0) | 0 (0.0) |
| Rapes (per 100,000) | 0 (0.0) | 0 (0.0) | 0 (0.0) | 0 (0.0) | 0 (0.0) | 0 (0.0) | 1 (15.4) | 0 (0.0) | 1 (15.9) | 0 (0.0) | 1 (16.1) | 2 (32.2) | 0 (0.0) |
| Robberies (per 100,000) | 1 (15.4) | 0 (0.0) | 0 (0.0) | 0 (0.0) | 0 (0.0) | 0 (0.0) | 0 (0.0) | 3 (47.3) | 0 (0.0) | 0 (0.0) | 0 (0.0) | 0 (0.0) | 0 (0.0) |
| Assaults (per 100,000) | 2 (30.8) | 4 (60.7) | 8 (121.0) | 1 (15.2) | 7 (106.3) | 1 (15.2) | 7 (107.6) | 3 (47.3) | 2 (31.8) | 3 (48.3) | 4 (64.4) | 1 (16.1) | 0 (0.0) |
| Burglaries (per 100,000) | 12 (184.9) | 2 (30.3) | 10 (151.2) | 10 (151.7) | 9 (136.6) | 8 (122.0) | 1 (15.4) | 2 (31.6) | 6 (95.3) | 14 (225.4) | 3 (48.3) | 1 (16.1) | 1 (15.1) |
| Thefts (per 100,000) | 42 (647.1) | 17 (257.9) | 31 (468.8) | 31 (470.1) | 29 (440.2) | 11 (167.7) | 18 (276.7) | 20 (315.7) | 24 (381.3) | 33 (531.4) | 23 (370.1) | 13 (209.1) | 9 (135.8) |
| Auto thefts (per 100,000) | 1 (15.4) | 0 (0.0) | 5 (75.6) | 1 (15.2) | 0 (0.0) | 1 (15.2) | 0 (0.0) | 0 (0.0) | 1 (15.9) | 0 (0.0) | 1 (16.1) | 0 (0.0) | 0 (0.0) |
| Arson (per 100,000) | 0 (0.0) | 0 (0.0) | 0 (0.0) | 0 (0.0) | 0 (0.0) | 0 (0.0) | 0 (0.0) | 0 (0.0) | 0 (0.0) | 0 (0.0) | 0 (0.0) | 0 (0.0) | 0 (0.0) |
| City-Data.com crime index | 50.8 | 24.6 | 59.6 | 33.7 | 48.4 | 19.5 | 46.0 | 38.5 | 42.3 | 46.7 | 45.2 | 38.4 | 6.5 |
The City-Data.com crime index weighs serious crimes and violent crimes more heavily. Higher means more crime, U.S. average is 246.1. It adjusts for the number of visitors and daily workers commuting into cities.
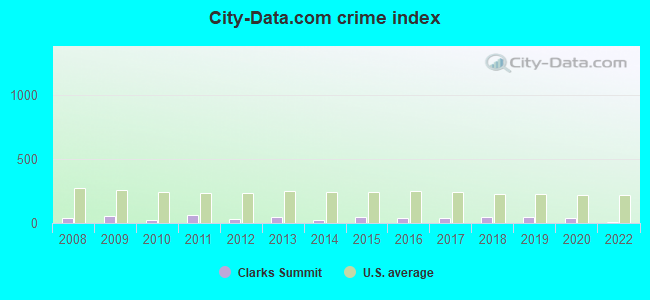
Crime rate in Clarks Summit detailed stats: murders, rapes, robberies, assaults, burglaries, thefts, arson
Full-time law enforcement employees in 2021, including police officers: 5 (5 officers - 5 male; 0 female).
| Officers per 1,000 residents here: | 0.81 |
| Pennsylvania average: | 2.55 |
 Recent articles from our blog. Our writers, many of them Ph.D. graduates or candidates, create easy-to-read articles on a wide variety of topics.

 | Best communities outside of Scranton? (3 replies) |
| Clarks Summit a good place for seniors? (13 replies) |
| Future NE Penn. residents looking for personal opinions and experiences! (273 replies) |
| Moved to NEPA transplants and opinions (137 replies) |
| Clarks Summit area housing market (4 replies) |
| Moving to NEPA (6 replies) |
Latest news from Clarks Summit, PA collected exclusively by city-data.com from local newspapers, TV, and radio stations
Ancestries: Irish (23.2%), American (22.6%), German (12.8%), Italian (8.7%), Polish (6.1%), Eastern European (2.4%).
Current Local Time: EST time zone
Incorporated on 08/30/1911
Elevation: 1460 feet
Land area: 1.60 square miles.
Population density: 3,169 people per square mile (average).
168 residents are foreign born (1.8% Europe, 1.1% Latin America).
| This borough: | 3.3% |
| Pennsylvania: | 7.3% |
Median real estate property taxes paid for housing units with mortgages in 2022: $3,903 (1.8%)
Median real estate property taxes paid for housing units with no mortgage in 2022: $4,180 (1.8%)
Nearest city with pop. 50,000+: Scranton, PA  (6.0 miles , pop. 76,415).
Nearest city with pop. 200,000+: Newark, NJ (95.0 miles , pop. 273,546).
Nearest city with pop. 1,000,000+: Manhattan, NY (103.1 miles , pop. 1,537,195).
Nearest cities:
), ), ), ), ), ), )Latitude: 41.49 N, Longitude: 75.70 W
Daytime population change due to commuting: +760 (+14.9%)
Workers who live and work in this borough: 803 (28.7%)
Area code: 570
Property values in Clarks Summit, PA
| Here: | 3.1% |
| Pennsylvania: | 2.9% |
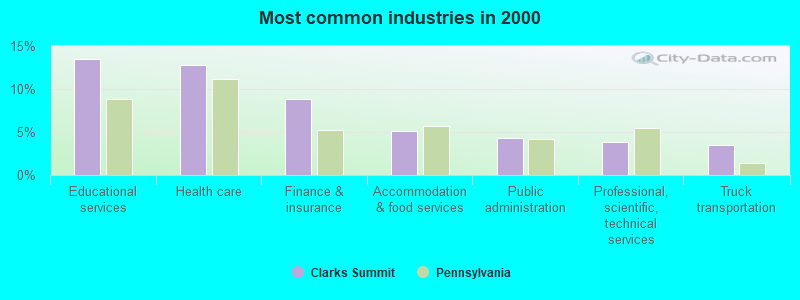
- Educational services (13.4%)
- Health care (12.8%)
- Finance & insurance (8.8%)
- Accommodation & food services (5.1%)
- Public administration (4.4%)
- Professional, scientific, technical services (3.9%)
- Truck transportation (3.5%)
- Educational services (12.9%)
- Truck transportation (6.6%)
- Public administration (6.1%)
- Finance & insurance (5.9%)
- Health care (5.6%)
- Construction (5.6%)
- Accommodation & food services (4.7%)
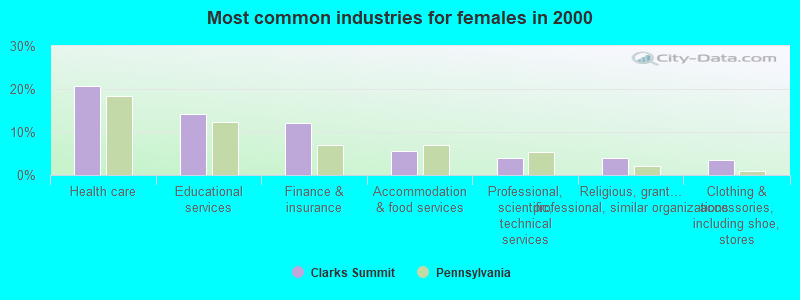
- Health care (20.8%)
- Educational services (14.1%)
- Finance & insurance (12.1%)
- Accommodation & food services (5.6%)
- Professional, scientific, technical services (4.0%)
- Religious, grantmaking, civic, professional, similar organizations (4.0%)
- Clothing & accessories, including shoe, stores (3.5%)
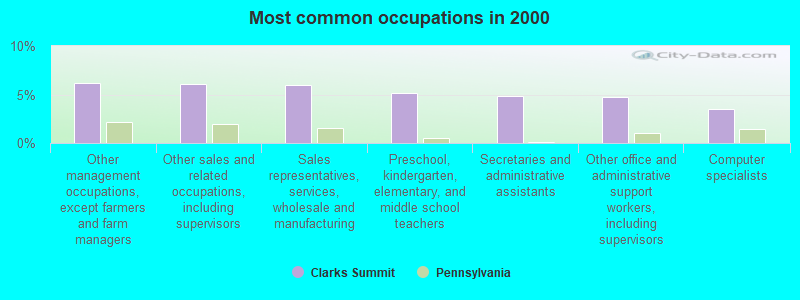
- Other management occupations, except farmers and farm managers (6.2%)
- Other sales and related occupations, including supervisors (6.1%)
- Sales representatives, services, wholesale and manufacturing (6.0%)
- Preschool, kindergarten, elementary, and middle school teachers (5.1%)
- Secretaries and administrative assistants (4.8%)
- Other office and administrative support workers, including supervisors (4.8%)
- Computer specialists (3.5%)
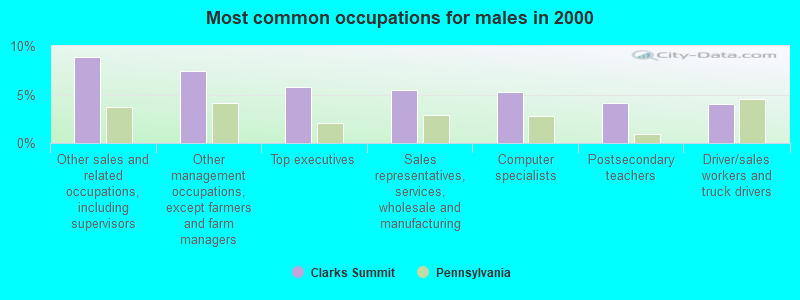
- Other sales and related occupations, including supervisors (8.8%)
- Other management occupations, except farmers and farm managers (7.4%)
- Top executives (5.7%)
- Sales representatives, services, wholesale and manufacturing (5.5%)
- Computer specialists (5.2%)
- Postsecondary teachers (4.1%)
- Driver/sales workers and truck drivers (4.1%)
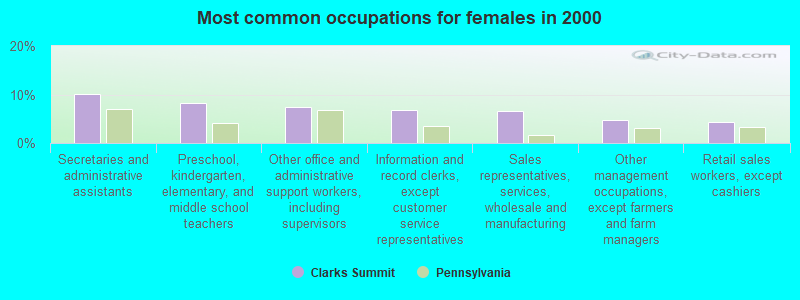
- Secretaries and administrative assistants (10.2%)
- Preschool, kindergarten, elementary, and middle school teachers (8.3%)
- Other office and administrative support workers, including supervisors (7.4%)
- Information and record clerks, except customer service representatives (6.8%)
- Sales representatives, services, wholesale and manufacturing (6.5%)
- Other management occupations, except farmers and farm managers (4.8%)
- Retail sales workers, except cashiers (4.2%)
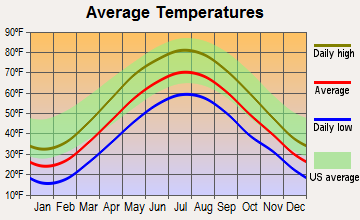
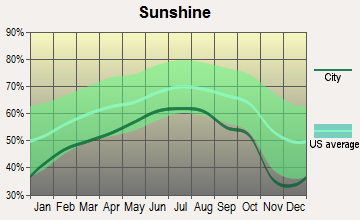
Average climate in Clarks Summit, Pennsylvania
Based on data reported by over 4,000 weather stations


|
|

(lower is better)
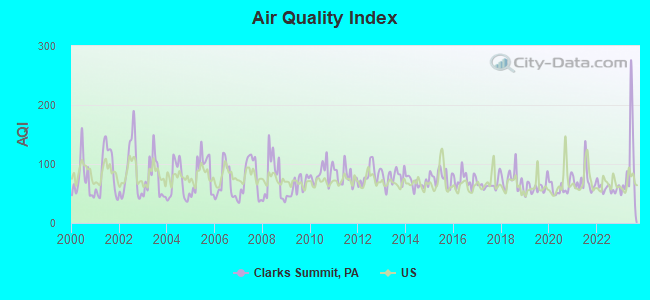
Air Quality Index (AQI) level in 2023 was 96.5. This is worse than average.
| City: | 96.5 |
| U.S.: | 72.6 |
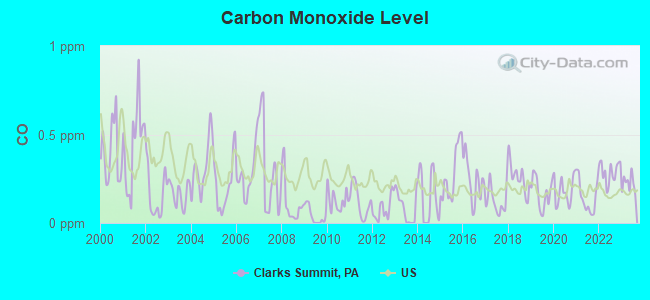
Carbon Monoxide (CO) [ppm] level in 2023 was 0.223. This is about average. Closest monitor was 5.5 miles away from the city center.
| City: | 0.223 |
| U.S.: | 0.251 |
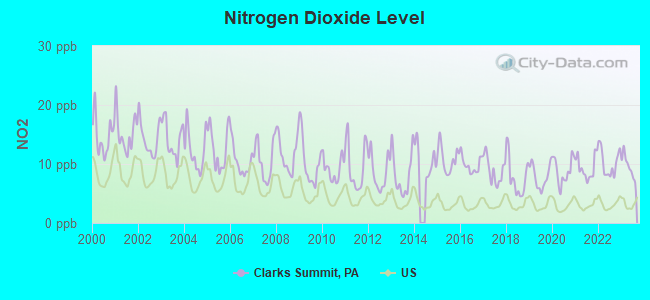
Nitrogen Dioxide (NO2) [ppb] level in 2023 was 9.63. This is significantly worse than average. Closest monitor was 5.5 miles away from the city center.
| City: | 9.63 |
| U.S.: | 5.11 |
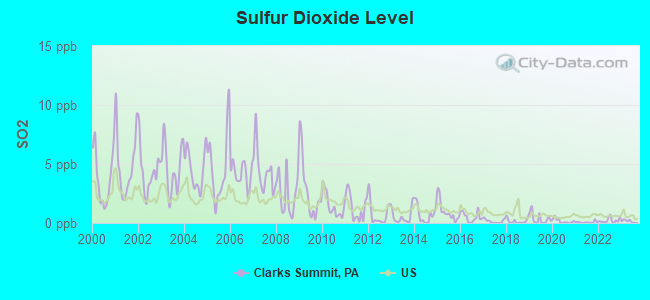
Sulfur Dioxide (SO2) [ppb] level in 2023 was 0.157. This is significantly better than average. Closest monitor was 5.5 miles away from the city center.
| City: | 0.157 |
| U.S.: | 1.515 |
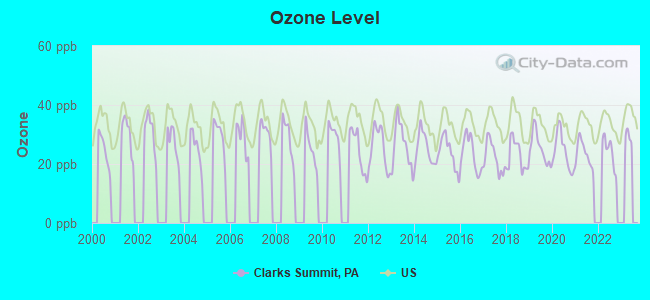
Ozone [ppb] level in 2022 was 24.3. This is better than average. Closest monitor was 5.5 miles away from the city center.
| City: | 24.3 |
| U.S.: | 33.3 |
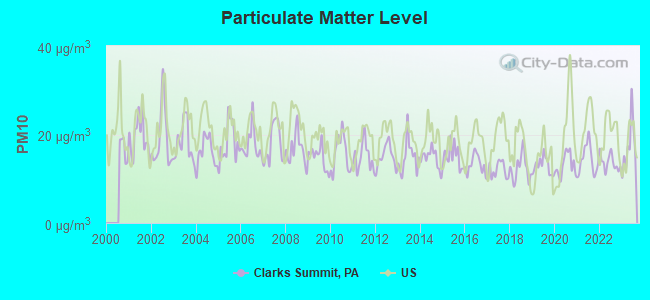
Particulate Matter (PM10) [µg/m3] level in 2023 was 17.3. This is about average. Closest monitor was 5.5 miles away from the city center.
| City: | 17.3 |
| U.S.: | 19.2 |
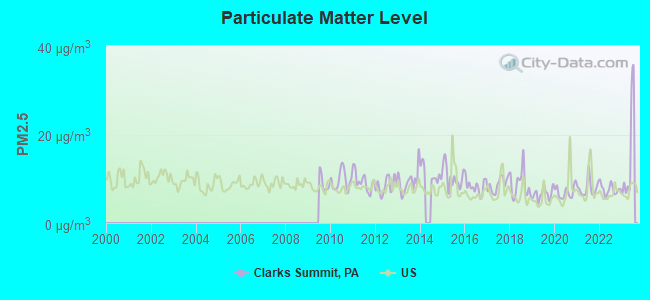
Particulate Matter (PM2.5) [µg/m3] level in 2023 was 15.0. This is significantly worse than average. Closest monitor was 5.5 miles away from the city center.
| City: | 15.0 |
| U.S.: | 8.1 |
Tornado activity:
Clarks Summit-area historical tornado activity is slightly below Pennsylvania state average. It is 40% smaller than the overall U.S. average.
On 6/2/1998, a category F3 (max. wind speeds 158-206 mph) tornado 7.3 miles away from the Clarks Summit borough center killed 2 people and injured 15 people and caused $2 million in damages.
On 5/31/1998, a category F3 tornado 34.1 miles away from the borough center injured 2 people and caused $1 million in damages.
Earthquake activity:
Clarks Summit-area historical earthquake activity is significantly above Pennsylvania state average. It is 66% smaller than the overall U.S. average.On 8/23/2011 at 17:51:04, a magnitude 5.8 (5.8 MW, Depth: 3.7 mi, Class: Moderate, Intensity: VI - VII) earthquake occurred 274.8 miles away from the city center
On 10/7/1983 at 10:18:46, a magnitude 5.3 (5.1 MB, 5.3 LG, 5.1 ML) earthquake occurred 183.7 miles away from the city center
On 1/16/1994 at 01:49:16, a magnitude 4.6 (4.6 MB, 4.6 LG, Depth: 3.1 mi, Class: Light, Intensity: IV - V) earthquake occurred 82.3 miles away from the city center
On 4/20/2002 at 10:50:47, a magnitude 5.3 (5.3 ML, Depth: 3.0 mi) earthquake occurred 232.2 miles away from Clarks Summit center
On 4/20/2002 at 10:50:47, a magnitude 5.2 (5.2 MB, 4.2 MS, 5.2 MW, 5.0 MW) earthquake occurred 230.2 miles away from the city center
On 9/25/1998 at 19:52:52, a magnitude 5.2 (4.8 MB, 4.3 MS, 5.2 LG, 4.5 MW, Depth: 3.1 mi) earthquake occurred 243.0 miles away from Clarks Summit center
Magnitude types: regional Lg-wave magnitude (LG), body-wave magnitude (MB), local magnitude (ML), surface-wave magnitude (MS), moment magnitude (MW)
Natural disasters:
The number of natural disasters in Lackawanna County (20) is greater than the US average (15).Major Disasters (Presidential) Declared: 16
Emergencies Declared: 3
Causes of natural disasters: Floods: 8, Storms: 8, Hurricanes: 3, Tropical Storms: 3, Winter Storms: 2, Blizzard: 1, Flash Flood: 1, Heavy Rain: 1, Mudslide: 1, Snowfall: 1, Tornado: 1, Tropical Depression: 1, Wind: 1, Other: 1 (Note: some incidents may be assigned to more than one category).
Main business address for: COMM BANCORP INC (STATE COMMERCIAL BANKS).
Hospitals and medical centers in Clarks Summit:
- CLARKS SUMMIT STATE HOSP (provides emergency services, 1451 HILLSIDE DR)
- ALLIED SERVICES HOME HEALTH (100 ABINGTON EXECUTIVE PARK)
- ASERACARE HOME HEALTH (749 NORTHERN BOULEVARD)
- BAYADA NURSES, INC (233 NORTHERN BOULEVARD SUITE 5)
- CAREGIVERS AMERICA HOME HEALTH SERVICES (718 SOUTH STATE STREET)
- CLINICAL HM HLTH CARE INC (301 WEST GROVE STREET)
- ABINGTON MANOR (100 EDELLA ROAD)
College/University in Clarks Summit:
Colleges/universities with over 2000 students nearest to Clarks Summit:
- Marywood University (about 6 miles; Scranton, PA; Full-time enrollment: 2,959)
- University of Scranton (about 7 miles; Scranton, PA; FT enrollment: 5,488)
- Misericordia University (about 18 miles; Dallas, PA; FT enrollment: 2,554)
- King's College (about 20 miles; Wilkes-Barre, PA; FT enrollment: 2,392)
- Wilkes University (about 20 miles; Wilkes-Barre, PA; FT enrollment: 3,912)
- Luzerne County Community College (about 26 miles; Nanticoke, PA; FT enrollment: 4,724)
- SUNY at Binghamton (about 44 miles; Vestal, NY; FT enrollment: 15,096)
Public high school in Clarks Summit:
- ABINGTON HEIGHTS HS (Students: 1,149, Location: 222 NOBLE ROAD, Grades: 9-12)
Public elementary/middle schools in Clarks Summit:
- ABINGTON HEIGHTS MS (Students: 1,284, Location: 1555 NEWTON RANSOM BLVD, Grades: 5-8)
- NEWTON-RANSOM SCH (Students: 267, Location: 1549 NEWTON RANSOM BOULEVARD, Grades: KG-4)
- CLARKS SUMMIT EL SCH (Location: 401 W GROVE ST, Grades: KG-4)
User-submitted facts and corrections:
- In 2005, The Baptist High School and Summit Baptist Academy merged to form Summit Christian Academy providing a pre-school through twelfth grade educational program for 175 students.
Points of interest:
Notable location: Clarks Summit Fire Company 1 (A). Display/hide its location on the map
Shopping Center: Insalaco Shopping Center (1). Display/hide its location on the map
Main business address in Clarks Summit: COMM BANCORP INC (A). Display/hide its location on the map
Hotels: Beechwood Residential Suites (1101 Northern Boulevard Uppr), Hampton Inn (890 Northern Boulevard), Comfort Inn Clarks Summit (811 Northern Boulevard), Four Winds Lodge (200 Johnson Road), Hampton Inn Clarks Summit-Scranton (890 Northern Boulevard), Cristallo Cafe (Routes 6 & 11).
Drinking water stations with addresses in Clarks Summit and their reported violations in the past:
CLARKS SUMMIT STATE HOSPITAL (Population served: 747, Groundwater):Past monitoring violations:LAHEY FAMILY FUN PARK (Population served: 100, Groundwater):
- Monitoring and Reporting (DBP) - Between JUL-2013 and SEP-2013, Contaminant: Chlorine. Follow-up actions: St Violation/Reminder Notice (JAN-10-2014), St Compliance achieved (APR-22-2014)
- Monitoring of Treatment (SWTR-Unfilt/GWR) - In APR-2013, Contaminant: GROUNDWATER RULE. Follow-up actions: St Violation/Reminder Notice (MAY-31-2013), St Compliance achieved (MAY-31-2013)
- Monitoring of Treatment (SWTR-Unfilt/GWR) - In MAR-2013, Contaminant: GROUNDWATER RULE. Follow-up actions: St Formal NOV issued (MAY-10-2013), St Public Notif requested (MAY-10-2013), St Violation/Reminder Notice (JUN-05-2013), St Compliance achieved (JUN-05-2013)
- Monitoring and Reporting (DBP) - Between JAN-2011 and MAR-2011, Contaminant: Chlorine. Follow-up actions: St Violation/Reminder Notice (JAN-30-2012), St Compliance achieved (JAN-30-2012)
- Monitoring and Reporting (DBP) - Between JUL-2010 and SEP-2010, Contaminant: Total Haloacetic Acids (HAA5). Follow-up actions: St Violation/Reminder Notice (NOV-22-2010), St Compliance achieved (NOV-22-2010)
- One routine major monitoring violation
- One regular monitoring violation
- 4 other older monitoring violations
Past monitoring violations:SCHULTZVILLE DELI (Population served: 100, Groundwater):
- One routine major monitoring violation
Past monitoring violations:ROSSIS MARKET (Population served: 50, Groundwater):
- 2 regular monitoring violations
Past monitoring violations:OLD MILWAUKIE CAFE AND BAKERY (Population served: 30, Groundwater):
- 5 routine major monitoring violations
- 2 regular monitoring violations
Past monitoring violations:VILLAGE GROCERY (Population served: 30, Groundwater):
- Monitoring, Repeat Major (TCR) - Between APR-2006 and JUN-2006, Contaminant: Coliform (TCR). Follow-up actions: St Violation/Reminder Notice (AUG-01-2006), St Boil Water Order (AUG-01-2006), St Public Notif requested (AUG-16-2006), St Compliance achieved (AUG-16-2006), St Public Notif received (AUG-16-2006), St Site Visit (enforcement) (AUG-16-2006)
- 10 routine major monitoring violations
- One minor monitoring violation
- 10 regular monitoring violations
Past monitoring violations:LENOX CONVENIENT SUNOCO (Population served: 25, Groundwater):
- One routine major monitoring violation
Past monitoring violations:
- One routine major monitoring violation
Drinking water stations with addresses in Clarks Summit that have no violations reported:
- SUMMIT HILLS GOLF CLUB (Population served: 120, Primary Water Source Type: Groundwater)
- SCRANTON CANOE CLUB (Population served: 40, Primary Water Source Type: Groundwater)
- TERRACE GARDEN CAFE (Population served: 25, Primary Water Source Type: Groundwater)
| This borough: | 2.3 people |
| Pennsylvania: | 2.5 people |
| This borough: | 63.5% |
| Whole state: | 65.0% |
| This borough: | 4.2% |
| Whole state: | 6.6% |
Likely homosexual households (counted as self-reported same-sex unmarried-partner households)
- Lesbian couples: 0.4% of all households
- Gay men: 0.2% of all households
2 people in religious group quarters in 2000
Banks with most branches in Clarks Summit (2011 data):
- The Fidelity Deposit and Discount Bank: Morgan Highway Branch at Morgan Highway, State Route 307, branch established on 1995/12/04; Clarks Summit State Hospital Branch at 1451 Hillside Drive, branch established on 1998/03/02. Info updated 2011/01/21: Bank assets: $606.3 mil, Deposits: $515.8 mil, headquarters in Dunmore, PA, positive income, Commercial Lending Specialization, 14 total offices, Holding Company: Fidelity D&D Bancorp, Inc.
- Citizens Savings Bank: at 500 South State Street, branch established on 1902/01/01. Info updated 2011/07/21: Bank assets: $329.7 mil, Deposits: $279.6 mil, local headquarters, positive income, Mortgage Lending Specialization, 7 total offices
- Wells Fargo Bank, National Association: Clarks Summit Branch at 915 Northern Blvd, branch established on 1998/04/01. Info updated 2011/04/05: Bank assets: $1,161,490.0 mil, Deposits: $905,653.0 mil, headquarters in Sioux Falls, SD, positive income, 6395 total offices, Holding Company: Wells Fargo & Company
- Penn Security Bank and Trust Company: Clarks Summit Branch at Us Routes 6 & 11 & Sumner Ave, branch established on 1984/12/17. Info updated 2009/05/19: Bank assets: $921.0 mil, Deposits: $720.5 mil, headquarters in Scranton, PA, positive income, Commercial Lending Specialization, 12 total offices, Holding Company: Penseco Financial Services Corporation
- PNC Bank, National Association: Abington Branch at 207 South State Street, branch established on 1949/03/31. Info updated 2012/03/20: Bank assets: $263,309.6 mil, Deposits: $197,343.0 mil, headquarters in Wilmington, DE, positive income, Commercial Lending Specialization, 3085 total offices, Holding Company: Pnc Financial Services Group, Inc., The
- Wayne Bank: Clarks Summit Branch at 651 Northern Boulevard, branch established on 1989/11/20. Info updated 2011/06/09: Bank assets: $667.4 mil, Deposits: $527.0 mil, headquarters in Honesdale, PA, positive income, Commercial Lending Specialization, 16 total offices, Holding Company: Norwood Financial Corp.
- Community Bank, National Association: Clarks Summitt - S. State Street Bra at 931 South State Street, branch established on 2005/05/16. Info updated 2011/06/13: Bank assets: $6,460.6 mil, Deposits: $4,840.4 mil, headquarters in Canton, NY, positive income, 175 total offices, Holding Company: Community Bank System, Inc.
- Peoples Neighborhood Bank: Glenburn Branch at 1105 Gravel Pond Road, branch established on 2008/10/02. Info updated 2011/01/20: Bank assets: $620.8 mil, Deposits: $494.3 mil, headquarters in Hallstead, PA, positive income, Commercial Lending Specialization, 12 total offices, Holding Company: Peoples Financial Services Corp.
- First National Bank of Pennsylvania: Community Bank & Trust Company Bank at 125 North State Street, branch established on 1934/01/01. Info updated 2012/01/10: Bank assets: $9,581.0 mil, Deposits: $7,462.2 mil, headquarters in Greenville, PA, positive income, Commercial Lending Specialization, 291 total offices, Holding Company: F.N.b. Corporation
For population 15 years and over in Clarks Summit:
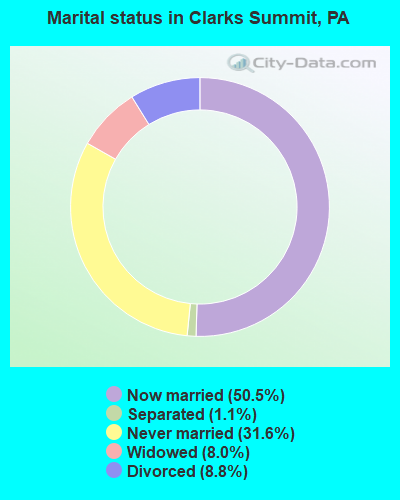
- Never married: 31.6%
- Now married: 50.5%
- Separated: 1.1%
- Widowed: 8.0%
- Divorced: 8.8%
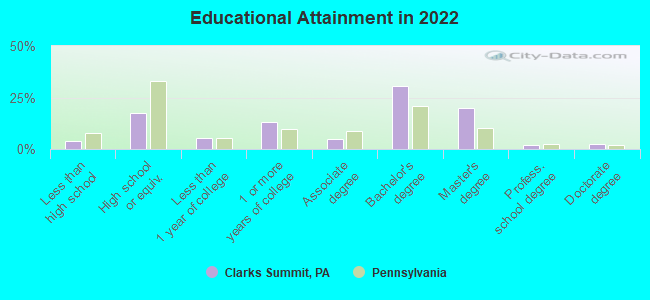
For population 25 years and over in Clarks Summit:
- High school or higher: 95.6%
- Bachelor's degree or higher: 54.3%
- Graduate or professional degree: 23.8%
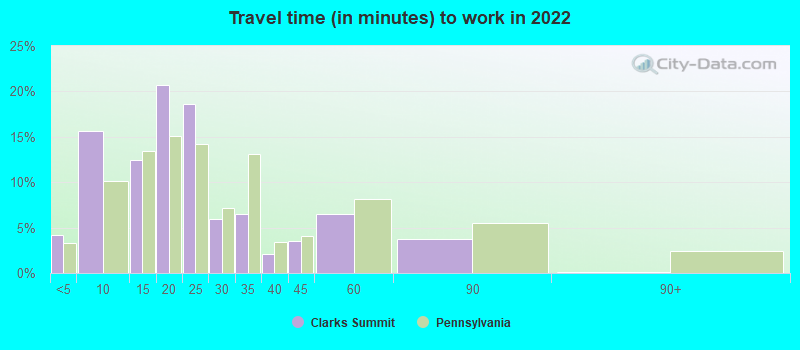
- Unemployed: 2.7%
- Mean travel time to work (commute): 21.7 minutes
| Here: | 9.5 |
| Pennsylvania average: | 11.4 |
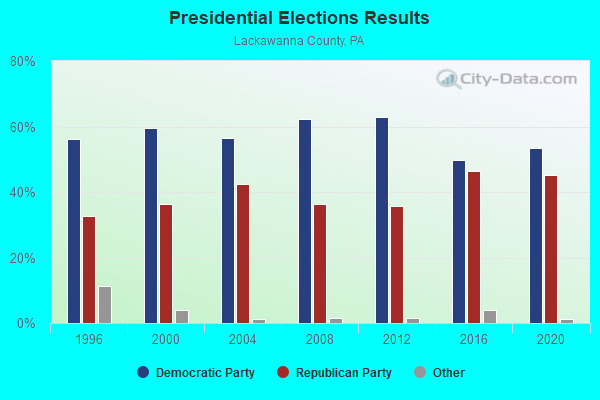
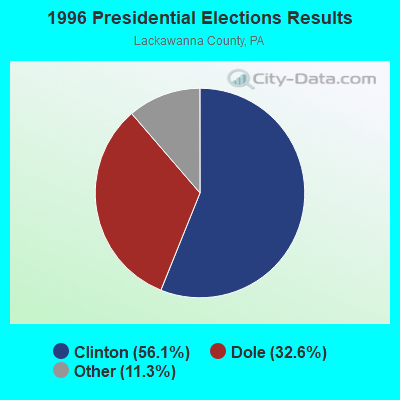
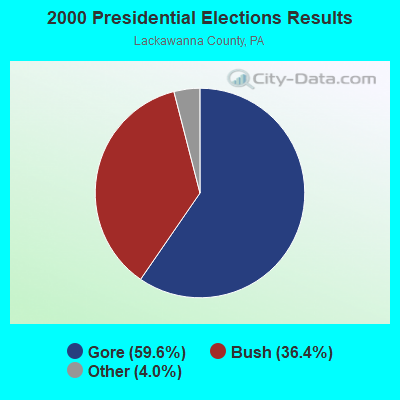
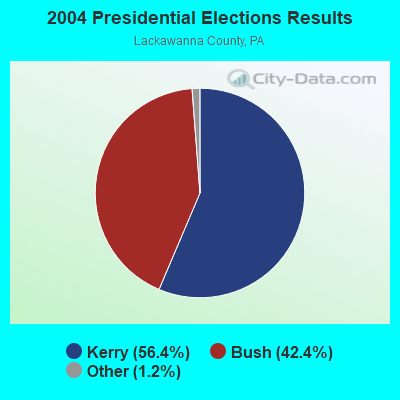
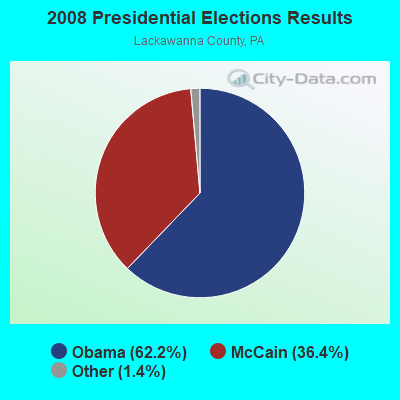
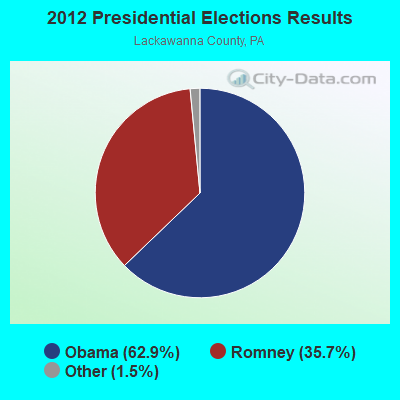
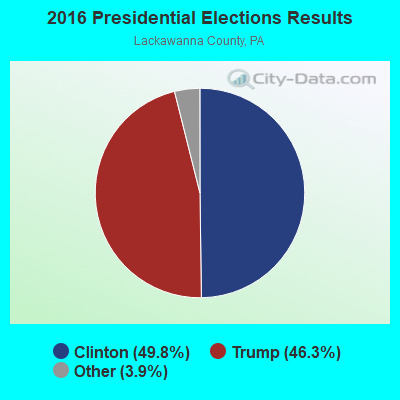
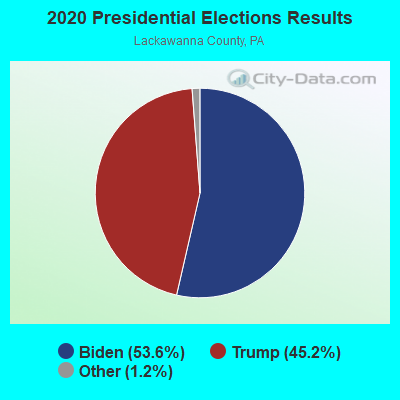
Graphs represent county-level data. Detailed 2008 Election Results
Religion statistics for Clarks Summit, PA (based on Lackawanna County data)
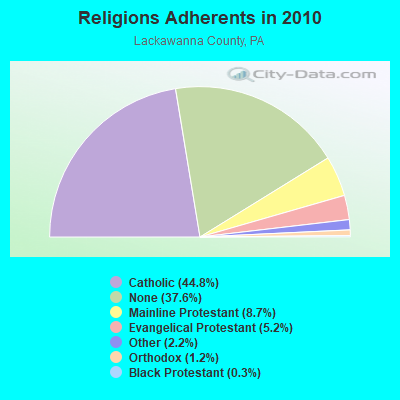
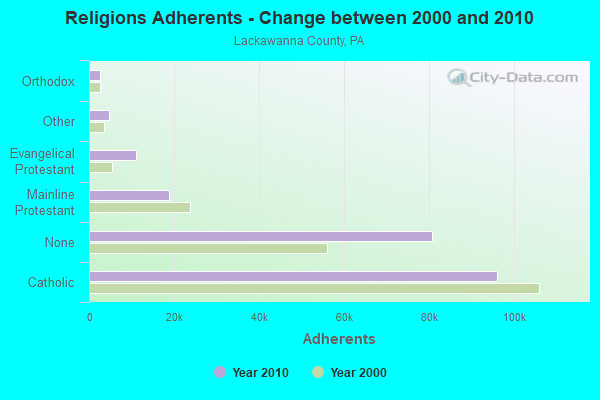
| Religion | Adherents | Congregations |
|---|---|---|
| Catholic | 96,140 | 58 |
| Mainline Protestant | 18,728 | 72 |
| Evangelical Protestant | 11,047 | 58 |
| Other | 4,710 | 13 |
| Orthodox | 2,526 | 15 |
| Black Protestant | 569 | 2 |
| None | 80,717 | - |
Food Environment Statistics:
| Here: | 2.01 / 10,000 pop. |
| Pennsylvania: | 2.04 / 10,000 pop. |
| Here: | 0.10 / 10,000 pop. |
| Pennsylvania: | 0.09 / 10,000 pop. |
| Lackawanna County: | 1.39 / 10,000 pop. |
| Pennsylvania: | 0.88 / 10,000 pop. |
| Lackawanna County: | 2.72 / 10,000 pop. |
| Pennsylvania: | 2.52 / 10,000 pop. |
| This county: | 9.32 / 10,000 pop. |
| Pennsylvania: | 7.12 / 10,000 pop. |
| This county: | 9.2% |
| Pennsylvania: | 9.1% |
| Lackawanna County: | 25.3% |
| State: | 27.2% |
| Lackawanna County: | 9.7% |
| Pennsylvania: | 11.5% |
Health and Nutrition:
| Here: | 59.7% |
| Pennsylvania: | 50.2% |
| Here: | 60.5% |
| State: | 47.1% |
| Here: | 27.8 |
| State: | 28.7 |
| Clarks Summit: | 17.8% |
| Pennsylvania: | 20.8% |
| Here: | 7.6% |
| Pennsylvania: | 10.9% |
| This city: | 7.1 |
| State: | 6.8 |
| Clarks Summit: | 35.2% |
| Pennsylvania: | 34.3% |
| Clarks Summit: | 64.6% |
| Pennsylvania: | 56.2% |
| Clarks Summit: | 80.2% |
| State: | 78.3% |
More about Health and Nutrition of Clarks Summit, PA Residents
| Local government employment and payroll (March 2022) | |||||
| Function | Full-time employees | Monthly full-time payroll | Average yearly full-time wage | Part-time employees | Monthly part-time payroll |
|---|---|---|---|---|---|
| Streets and Highways | 6 | $31,784 | $63,568 | 0 | $0 |
| Police Protection - Officers | 5 | $33,101 | $79,442 | 6 | $17,514 |
| Other Government Administration | 1 | $5,805 | $69,660 | 8 | $4,613 |
| Financial Administration | 0 | $0 | 2 | $1,836 | |
| Police - Other | 0 | $0 | 1 | $1,987 | |
| Totals for Government | 12 | $70,690 | $70,690 | 17 | $25,949 |
Clarks Summit government finances - Expenditure in 2017 (per resident):
- Current Operations - Sewerage: $1,525,000 ($301.09)
Regular Highways: $912,000 ($180.06)
Police Protection: $695,000 ($137.22)
Solid Waste Management: $432,000 ($85.29)
Central Staff Services: $194,000 ($38.30)
Local Fire Protection: $117,000 ($23.10)
General Public Buildings: $79,000 ($15.60)
Financial Administration: $68,000 ($13.43)
Parks and Recreation: $41,000 ($8.09)
Protective Inspection and Regulation - Other: $28,000 ($5.53)
General - Other: $26,000 ($5.13)
Judicial and Legal Services: $23,000 ($4.54)
Libraries: $15,000 ($2.96)
Health - Other: $3,000 ($0.59)
- General - Interest on Debt: $49,000 ($9.67)
- Other Capital Outlay - Police Protection: $95,000 ($18.76)
Regular Highways: $51,000 ($10.07)
Parks and Recreation: $5,000 ($0.99)
- Total Salaries and Wages: $946,000 ($186.77)
Clarks Summit government finances - Revenue in 2017 (per resident):
- Charges - Sewerage: $1,712,000 ($338.01)
Regular Highways: $36,000 ($7.11)
Other: $30,000 ($5.92)
- Local Intergovernmental - Other: $22,000 ($4.34)
- Miscellaneous - General Revenue - Other: $99,000 ($19.55)
Fines and Forfeits: $27,000 ($5.33)
Rents: $25,000 ($4.94)
Donations From Private Sources: $22,000 ($4.34)
Interest Earnings: $1,000 ($0.20)
Sale of Property: $1,000 ($0.20)
- State Intergovernmental - Other: $220,000 ($43.44)
Highways: $165,000 ($32.58)
General Local Government Support: $4,000 ($0.79)
- Tax - Property: $1,452,000 ($286.67)
Individual Income: $691,000 ($136.43)
Occupation and Business License - Other: $134,000 ($26.46)
Public Utility License: $108,000 ($21.32)
Documentary and Stock Transfer: $97,000 ($19.15)
Clarks Summit government finances - Debt in 2017 (per resident):
- Long Term Debt - Beginning Outstanding - Unspecified Public Purpose: $1,226,000 ($242.05)
Outstanding Unspecified Public Purpose: $905,000 ($178.68)
Retired Unspecified Public Purpose: $621,000 ($122.61)
Issue, Unspecified Public Purpose: $300,000 ($59.23)
Clarks Summit government finances - Cash and Securities in 2017 (per resident):
- Bond Funds - Cash and Securities: $323,000 ($63.77)
- Other Funds - Cash and Securities: $632,000 ($124.78)
- Sinking Funds - Cash and Securities: $95,000 ($18.76)
| Businesses in Clarks Summit, PA | ||||
| Name | Count | Name | Count | |
|---|---|---|---|---|
| Ace Hardware | 1 | Nike | 1 | |
| Advance Auto Parts | 1 | Pizza Hut | 1 | |
| Blockbuster | 1 | RadioShack | 1 | |
| Burger King | 1 | Ramada | 1 | |
| CVS | 1 | Rite Aid | 1 | |
| Comfort Inn | 1 | Subway | 1 | |
| Domino's Pizza | 1 | T-Mobile | 1 | |
| Dunkin Donuts | 1 | Taco Bell | 1 | |
| Econo Lodge | 1 | Talbots | 1 | |
| FedEx | 4 | True Value | 1 | |
| H&R Block | 1 | UPS | 2 | |
| Hilton | 1 | Waffle House | 1 | |
| McDonald's | 1 | Wendy's | 1 | |
Strongest AM radio stations in Clarks Summit:
- WARM (590 AM; 5 kW; SCRANTON, PA; Owner: CITADEL BROADCASTING COMPANY)
- WEJL (630 AM; 2 kW; SCRANTON, PA)
- WITK (1550 AM; 10 kW; PITTSTON, PA; Owner: ROBERT C. CORDARO, INC.)
- WKJN (1440 AM; 5 kW; CARBONDALE, PA; Owner: CITADEL BROADCASTING COMPANY)
- WICK (1400 AM; 1 kW; SCRANTON, PA; Owner: LANCOM, INC.)
- WGBI (910 AM; 1 kW; SCRANTON, PA; Owner: ENTERCOM WILKES-BARRE SCRANTON, LLC)
- WQOR (750 AM; daytime; 2 kW; OLYPHANT, PA; Owner: HOLY FAMILY COMMUNICATIONS)
- WEMR (1460 AM; 5 kW; TUNKHANNOCK, PA; Owner: CITADEL BROADCASTING COMPANY)
- WWJZ (640 AM; 50 kW; MOUNT HOLLY, NJ; Owner: ABC, INC.)
- WILK (980 AM; 5 kW; WILKES-BARRE, PA; Owner: ENTERCOM WILKES-BARRE SCRANTON, LLC)
- WMCA (570 AM; 50 kW; NEW YORK, NY; Owner: SALEM MEDIA OF NEW YORK, LLC)
- WOR (710 AM; 50 kW; NEW YORK, NY; Owner: BUCKLEY BROADCASTING CORPORATION)
- WABC (770 AM; 50 kW; NEW YORK, NY; Owner: WABC-AM RADIO, INC.)
Strongest FM radio stations in Clarks Summit:
- W212AT (90.3 FM; CLARKS SUMMIT, PA; Owner: NORTHEASTERN PA. EDUCTNL TV ASSOC.)
- WWDL-FM (104.9 FM; SCRANTON, PA; Owner: LANE BROADCASTING CORPORATION)
- WUSR (99.5 FM; SCRANTON, PA; Owner: UNIVERSITY OF SCRANTON)
- WBHD (95.7 FM; OLYPHANT, PA; Owner: CITADEL BROADCASTING COMPANY)
- WEZX (106.9 FM; SCRANTON, PA; Owner: THE SCRANTON TIMES, L.P.)
- WGGY (101.3 FM; SCRANTON, PA; Owner: ENTERCOM WILKES-BARRE SCRANTON, LLC)
- WCWI (94.3 FM; CARBONDALE, PA; Owner: CITADEL BROADCASTING COMPANY)
- WPGP (88.3 FM; TAFTON, PA; Owner: SOUND OF LIFE, INC.)
- WQFN (100.1 FM; FOREST CITY, PA; Owner: THE SCRANTON TIMES, L.P.)
- WCWY (107.7 FM; TUNKHANNOCK, PA; Owner: CITADEL BROADCASTING COMPANY)
- WMGS (92.9 FM; WILKES-BARRE, PA; Owner: CITADEL BROADCASTING COMPANY)
- WKRZ (98.5 FM; WILKES-BARRE, PA; Owner: ENTERCOM WILKES-BARRE SCRANTON, LLC)
- WVIA-FM (89.9 FM; SCRANTON, PA; Owner: NORTHEASTERN PENNSYLVANIA EDUCATIONAL TV ASSN.)
- WBHT (97.1 FM; MOUNTAIN TOP, PA; Owner: CITADEL BROADCASTING COMPANY)
- WQFM (92.1 FM; NANTICOKE, PA; Owner: THE SCRANTON TIMES, L.P.)
- WCLH (90.7 FM; WILKES-BARRE, PA; Owner: WILKES COLLEGE)
- W219CG (91.7 FM; WILKER-BARRE, PA; Owner: PENSACOLA CHRISTIAN COLLEGE, INC.)
- WBSX (97.9 FM; HAZLETON, PA; Owner: CITADEL BROADCASTING COMPANY)
- WCWQ (93.7 FM; DALLAS, PA; Owner: CITADEL BROADCASTING COMPANY)
- WHWK (98.1 FM; BINGHAMTON, NY; Owner: CITADEL BROADCASTING COMPANY)
TV broadcast stations around Clarks Summit:
- WQPX (Channel 64; SCRANTON, PA; Owner: PAXSON SCRANTON LICENSE, INC.)
- WSWB (Channel 38; SCRANTON, PA; Owner: KB PRIME MEDIA LLC)
- W26CD (Channel 26; SCRANTON, PA; Owner: NATIONAL MINORITY T.V., INC.)
- W51BP (Channel 51; CLARKS SUMMIT, ETC., PA; Owner: NEXSTAR BROADCASTING OF NORTHEASTERN PENNSYLVANIA, L.L.C.)
- W19AR (Channel 19; CLARKS SUMMIT, PA; Owner: MISSION BROADCASTING, INC.)
- W48AQ (Channel 48; CLARKS SUMMIT, ETC., PA; Owner: NORTHEASTERN PA EDUC'L. TV ASSN.)
- W14CO (Channel 14; CLARKS SUMMIT, ETC., PA; Owner: NEW YORK TIMES MANAGEMENT SERVICES)
- WNEP-TV (Channel 16; SCRANTON, PA; Owner: NEW YORK TIMES MANAGEMENT SERVICES)
- WOLF-TV (Channel 56; HAZLETON, PA; Owner: WOLF LICENSE CORP.)
- WVIA-TV (Channel 44; SCRANTON, PA; Owner: NE PA ED TV ASSOCIATION)
- WBRE-TV (Channel 28; WILKES-BARRE, PA; Owner: NEXSTAR BROADCASTING OF NORTHEASTERN PENNSYLVANIA, L.L.C.)
- WYOU (Channel 22; SCRANTON, PA; Owner: MISSION BROADCASTING, INC.)
- W07BV (Channel 7; WILKES-BARRE, ETC., PA; Owner: CATHOLIC BROADCASTING OF SCRANTON, INC.)
- WSKG-TV (Channel 46; BINGHAMTON, NY; Owner: WSKG PUBLIC TELECOMMUNICATIONS COUNCIL)
- WICZ-TV (Channel 40; BINGHAMTON, NY; Owner: STAINLESS BROADCASTING, L.P.)
- W18BN (Channel 18; SCRANTON, PA; Owner: COMMONWEALTH TELECASTERS)
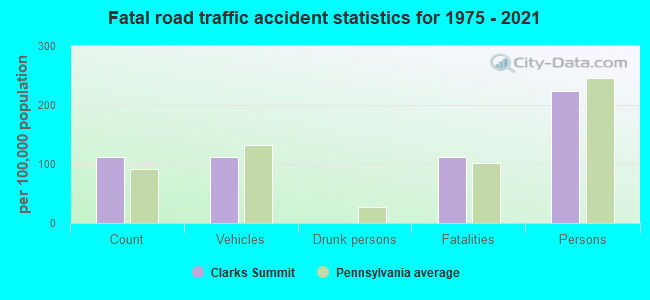
Clarks Summit fatal accident list:
May 30, 1987 08:42 PM, Sr40240020, Vehicles: 1, Persons: 3, Fatalities: 1
Mar 12, 1978 08:00 PM, Vehicles: 1, Persons: 1, Fatalities: 1
Nov 15, 1977 11:35 AM, Vehicles: 1, Persons: 2, Fatalities: 1
Jun 6, 1976 05:00 PM, Vehicles: 1, Persons: 2, Fatalities: 1
Jun 6, 1975 05:00 PM, Vehicles: 1, Persons: 2, Fatalities: 1
- National Bridge Inventory (NBI) Statistics
- 12Number of bridges
- 256ft / 78.0mTotal length
- $25,560,000Total costs
- 81,833Total average daily traffic
- 4,887Total average daily truck traffic
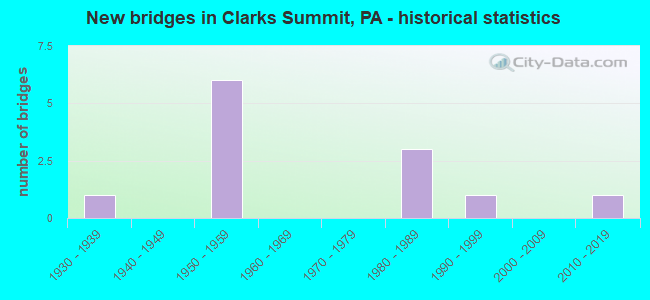
- New bridges - historical statistics
- 11930-1939
- 61950-1959
- 31980-1989
- 11990-1999
- 12010-2019
FCC Registered Antenna Towers:
34 (See the full list of FCC Registered Antenna Towers in Clarks Summit)FCC Registered Broadcast Land Mobile Towers:
11 (See the full list of FCC Registered Broadcast Land Mobile Towers in Clarks Summit, PA)FCC Registered Microwave Towers:
9 (See the full list of FCC Registered Microwave Towers in this town)FCC Registered Amateur Radio Licenses:
96 (See the full list of FCC Registered Amateur Radio Licenses in Clarks Summit)FAA Registered Aircraft:
5- Aircraft: CESSNA 150H (Category: Land, Seats: 2, Weight: Up to 12,499 Pounds, Speed: 90 mph), Engine: CONT MOTOR 0-200 SERIES (100 HP) (Reciprocating)
N-Number: 23367, N23367, N-23367, Serial Number: 15068907, Year manufactured: 1968, Airworthiness Date: 06/28/1968, Certificate Issue Date: 05/28/1997
Registrant (Individual): Eliot W Sturdevant, 2604 Bald Mountain Rd, Clarks Summit, PA 18411 - Aircraft: PIPER PA-22-160 (Category: Land, Seats: 4, Weight: Up to 12,499 Pounds, Speed: 94 mph), Engine: LYCOMING 0-320 SERIES (180 HP) (Reciprocating)
N-Number: 3110Z, N3110Z, N-3110Z, Serial Number: 22-7049, Year manufactured: 1959, Airworthiness Date: 10/20/1959, Certificate Issue Date: 08/23/2007
Registrant (Individual): Robert C Lombardo, 520 Waverly Ave, Clarks Summit, PA 18411 - Aircraft: PIPER PA-28-181 (Category: Land, Seats: 4, Weight: Up to 12,499 Pounds, Speed: 105 mph), Engine: LYCOMING O&VO-360 SER (180 HP) (Reciprocating)
N-Number: 3918F, N3918F, N-3918F, Serial Number: 28-7690460, Year manufactured: 1976, Airworthiness Date: 07/26/1976, Certificate Issue Date: 11/10/2020
Registrant (LLC): Summit Air LLC, 1005 Fairfield Cir, Clarks Summit, PA 18411 - Aircraft: CESSNA 150J (Category: Land, Seats: 2, Weight: Up to 12,499 Pounds, Speed: 90 mph), Engine: CONT MOTOR 0-200 SERIES (100 HP) (Reciprocating)
N-Number: 50816, N50816, N-50816, Serial Number: 15069571, Year manufactured: 1968, Airworthiness Date: 09/23/1968, Certificate Issue Date: 09/22/2005
Registrant (Individual): Robert G Dingee, 428 Simerell Rd, Clarks Summit, PA 18411 - Aircraft: QUAD CITY ULTRALIGHT CORP CHALLENGER II (Category: Land, Seats: 2, Weight: Up to 12,499 Pounds), Engine: BOMBARDIER ROTAX (ALL) (Reciprocating)
N-Number: 6613Z, N6613Z, N-6613Z, Serial Number: CH206900535, Year manufactured: 1992, Airworthiness Date: 01/06/1992, Certificate Issue Date: 10/21/2009
Registrant (Individual): William Spear, 2487 Ransom Rd, Clarks Summit, PA 18411
Deregistered: Cancel Date: 01/25/2018
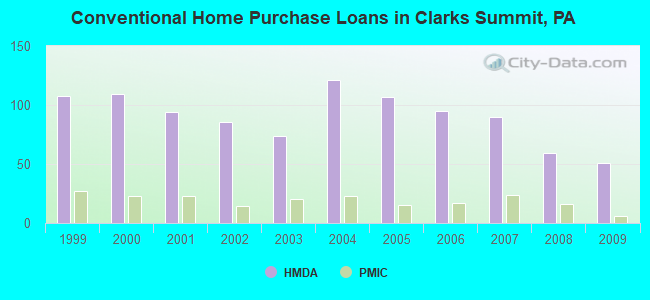
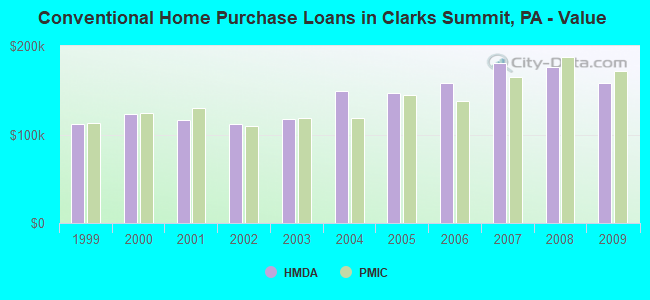
| Home Mortgage Disclosure Act Aggregated Statistics For Year 2009 (Based on 1 full tract) | ||||||||||||||
| A) FHA, FSA/RHS & VA Home Purchase Loans | B) Conventional Home Purchase Loans | C) Refinancings | D) Home Improvement Loans | E) Loans on Dwellings For 5+ Families | F) Non-occupant Loans on < 5 Family Dwellings (A B C & D) | G) Loans On Manufactured Home Dwelling (A B C & D) | ||||||||
|---|---|---|---|---|---|---|---|---|---|---|---|---|---|---|
| Number | Average Value | Number | Average Value | Number | Average Value | Number | Average Value | Number | Average Value | Number | Average Value | Number | Average Value | |
| LOANS ORIGINATED | 23 | $156,521 | 51 | $158,434 | 179 | $175,741 | 22 | $77,922 | 2 | $246,130 | 10 | $89,449 | 1 | $182,920 |
| APPLICATIONS APPROVED, NOT ACCEPTED | 2 | $131,685 | 3 | $243,893 | 9 | $120,244 | 0 | $0 | 0 | $0 | 1 | $116,840 | 0 | $0 |
| APPLICATIONS DENIED | 4 | $149,162 | 5 | $216,248 | 45 | $173,748 | 7 | $84,824 | 0 | $0 | 2 | $239,905 | 0 | $0 |
| APPLICATIONS WITHDRAWN | 3 | $138,867 | 6 | $122,427 | 39 | $176,978 | 8 | $96,369 | 0 | $0 | 3 | $131,523 | 0 | $0 |
| FILES CLOSED FOR INCOMPLETENESS | 0 | $0 | 1 | $399,360 | 9 | $158,233 | 1 | $74,700 | 0 | $0 | 1 | $94,810 | 0 | $0 |
Detailed HMDA statistics for the following Tracts: 1105.00
| Private Mortgage Insurance Companies Aggregated Statistics For Year 2009 (Based on 1 full tract) | ||||||
| A) Conventional Home Purchase Loans | B) Refinancings | C) Non-occupant Loans on < 5 Family Dwellings (A & B) | ||||
|---|---|---|---|---|---|---|
| Number | Average Value | Number | Average Value | Number | Average Value | |
| LOANS ORIGINATED | 6 | $171,268 | 7 | $192,634 | 1 | $173,340 |
| APPLICATIONS APPROVED, NOT ACCEPTED | 0 | $0 | 3 | $159,937 | 0 | $0 |
| APPLICATIONS DENIED | 1 | $104,390 | 2 | $156,105 | 0 | $0 |
| APPLICATIONS WITHDRAWN | 1 | $96,730 | 0 | $0 | 0 | $0 |
| FILES CLOSED FOR INCOMPLETENESS | 0 | $0 | 0 | $0 | 0 | $0 |
Detailed PMIC statistics for the following Tracts: 1105.00
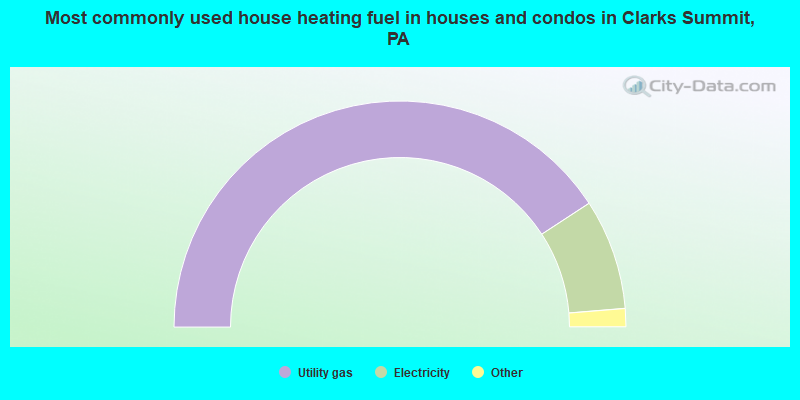
- 81.5%Utility gas
- 15.8%Electricity
- 1.8%Fuel oil, kerosene, etc.
- 0.8%Bottled, tank, or LP gas
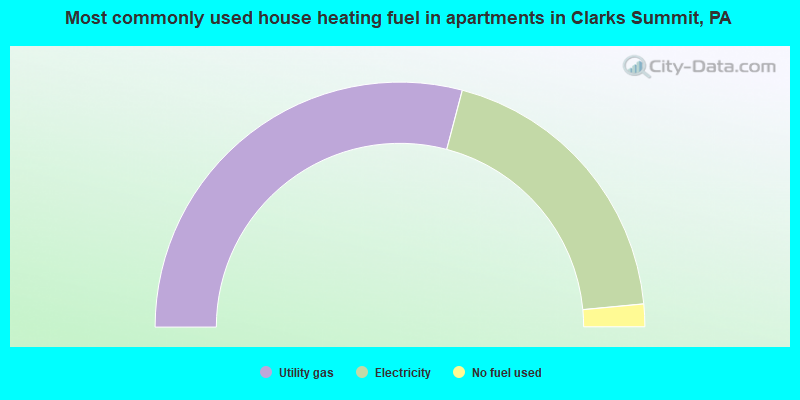
- 58.2%Utility gas
- 38.8%Electricity
- 3.0%No fuel used
Clarks Summit compared to Pennsylvania state average:
- Unemployed percentage significantly below state average.
- Black race population percentage significantly below state average.
- Median age above state average.
- Foreign-born population percentage below state average.
- Length of stay since moving in above state average.
- Number of college students below state average.
- Percentage of population with a bachelor's degree or higher above state average.
Clarks Summit on our top lists:
- #32 on the list of "Top 101 cities with the lowest number of police officers per 1000 residents (population 5,000+)"
- #50 on the list of "Top 101 cities with largest percentage of females in occupations: education, training, and library occupations (population 5,000+)"
- #74 on the list of "Top 101 cities with the lowest city-data.com crime index (population 5,000+)"
- #77 on the list of "Top 101 cities with largest percentage of females in occupations: health technologists and technicians (population 5,000+)"
- #81 on the list of "Top 101 cities with largest percentage of females in occupations: computer and mathematical occupations (population 5,000+)"
- #85 on the list of "Top 101 cities with largest percentage of females in occupations: community and social service occupations (population 5,000+)"
- #24 (18411) on the list of "Top 101 zip codes with the largest percentage of Welsh first ancestries (pop 5,000+)"
- #23 on the list of "Top 101 counties with the lowest percentage of residents relocating to foreign countries in 2011"
- #28 on the list of "Top 101 counties with the highest number of deaths per 1000 residents 2007-2013 (pop. 50,000+)"
- #29 on the list of "Top 101 counties with the most Orthodox congregations"
- #41 on the list of "Top 101 counties with the lowest percentage of residents relocating to other counties in 2011"
- #43 on the list of "Top 101 counties with the most Catholic congregations"

|
|
Total of 83 patent applications in 2008-2024.