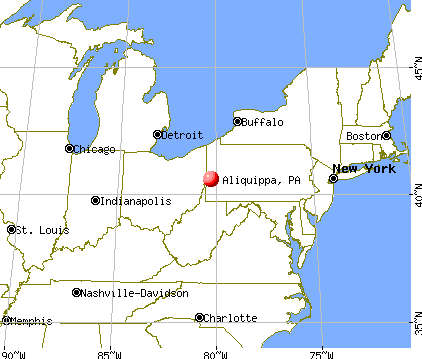
Aliquippa, Pennsylvania
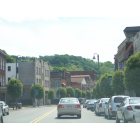
Submit your own pictures of this city and show them to the world
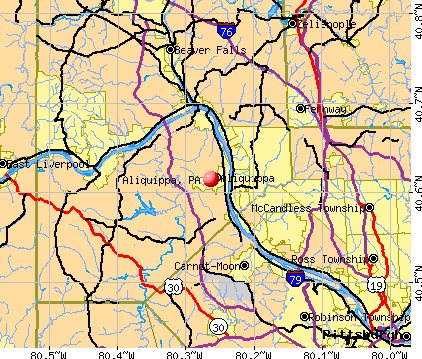
- OSM Map
- General Map
- Google Map
- MSN Map
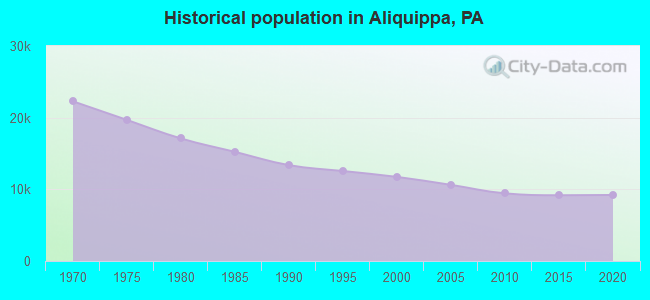
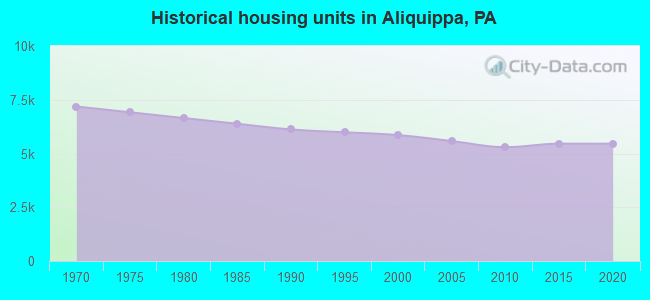
Population change since 2000: -22.8%
 |
| Males: 4,198 | |
| Females: 4,856 |
| Median resident age: | 49.1 years |
| Pennsylvania median age: | 40.9 years |
Zip codes: 15001.
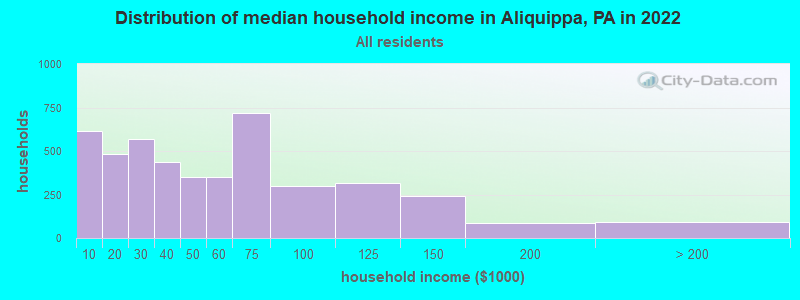
| Aliquippa: | $42,700 |
| PA: | $71,798 |
Estimated per capita income in 2022: $27,284 (it was $13,718 in 2000)
Aliquippa city income, earnings, and wages data
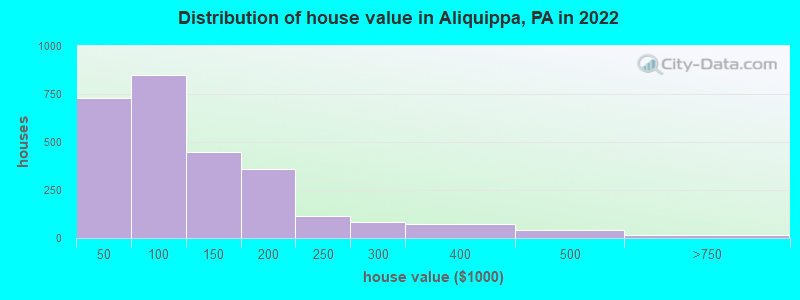
Estimated median house or condo value in 2022: $94,055 (it was $53,100 in 2000)
| Aliquippa: | $94,055 |
| PA: | $245,500 |
Mean prices in 2022: all housing units: $114,424; detached houses: $112,655; townhouses or other attached units: $119,460; in 2-unit structures: $163,332; in 5-or-more-unit structures: $156,794; mobile homes: $30,353
Median gross rent in 2022: $716.
(10.4% for White Non-Hispanic residents, 40.3% for Black residents, 15.5% for Hispanic or Latino residents, 100.0% for American Indian residents, 20.9% for other race residents, 49.6% for two or more races residents)
Detailed information about poverty and poor residents in Aliquippa, PA

Compare current foreclosures in Aliquippa, PA:
| Photo | Address | Area | Beds / Baths | Price | Details |
|---|---|---|---|---|---|

|
#1
Shady Ln
Aliquippa, PA 15001
|
1,440 sq. feet
|
2 baths 3 beds |
$169,900
|
show details |

|
#2
Westfield Dr
Aliquippa, PA 15001
|
1,338 sq. feet
|
1 baths 3 beds |
show details | |

|
#3
Christy Dr
Aliquippa, PA 15001
|
7,524 sq. feet
|
3 baths 7 beds |
show details | |

|
#4
Sunset Boulavard
Aliquippa, PA 15001
|
- sq. feet
|
1 baths 3 beds |
show details | |

|
#5
Washington St
Aliquippa, PA 15001
|
1,800 sq. feet
|
1 baths 3 beds |
show details | |

|
#6
Glenwall Dr
Aliquippa, PA 15001
|
932 sq. feet
|
1 baths 4 beds |
show details | |

|
#7
Riverview Ct
Aliquippa, PA 15001
|
2,389 sq. feet
|
2 baths 3 beds |
show details | |

|
#8
Lafayette Sq
Aliquippa, PA 15001
|
992 sq. feet
|
1 baths 2 beds |
show details | |

|
#9
Patterson Rd
Aliquippa, PA 15001
|
1,560 sq. feet
|
1 baths 2 beds |
show details | |

|
#10
Princeton Dr
Aliquippa, PA 15001
|
1,028 sq. feet
|
1 baths 3 beds |
show details |
| Photo | Address | Area | Beds / Baths | Price | Details |
|---|---|---|---|---|---|

|
#11
Linden Ave
Aliquippa, PA 15001
|
1,281 sq. feet
|
1 baths 2 beds |
show details | |

|
#12
Agnew Ave
Aliquippa, PA 15001
|
528 sq. feet
|
1 baths 1 beds |
show details | |

|
#13
Olszanski Dr
Aliquippa, PA 15001
|
1,282 sq. feet
|
1 baths 3 beds |
show details | |

|
#14
Patterson Rd
Aliquippa, PA 15001
|
1,560 sq. feet
|
1 baths 2 beds |
show details | |

|
#15
Route 151
Aliquippa, PA 15001
|
1,152 sq. feet
|
1 baths 3 beds |
show details | |

|
#16
Webb St
Aliquippa, PA 15001
|
1,353 sq. feet
|
1 baths 4 beds |
show details | |

|
#17
Tyler St # 2
Aliquippa, PA 15001
|
2,792 sq. feet
|
2 baths 4 beds |
show details | |

|
#18
Lexington Dr
Aliquippa, PA 15001
|
928 sq. feet
|
2 baths 2 beds |
show details | |

|
#19
Lewis Dr
Aliquippa, PA 15001
|
804 sq. feet
|
1 baths 3 beds |
show details | |

|
#20
Patterson Rd
Aliquippa, PA 15001
|
1,214 sq. feet
|
1 baths 3 beds |
show details |
| Photo | Address | Area | Beds / Baths | Price | Details |
|---|---|---|---|---|---|

|
#21
Chatham Dr
Aliquippa, PA 15001
|
1,040 sq. feet
|
1 baths 3 beds |
show details | |

|
#22
Admiral St
Aliquippa, PA 15001
|
1,268 sq. feet
|
1 baths 3 beds |
show details | |

|
#23
21st St
Aliquippa, PA 15001
|
1,463 sq. feet
|
1 baths 2 beds |
show details | |

|
#24
Blueberry Dr
Aliquippa, PA 15001
|
1,891 sq. feet
|
2 baths 3 beds |
show details | |

|
#25
Maine Ave
Aliquippa, PA 15001
|
2,512 sq. feet
|
1 baths 3 beds |
show details | |

|
#26
Sharon Grange Rd
Aliquippa, PA 15001
|
1,158 sq. feet
|
1 baths 3 beds |
show details | |

|
#27
Martha St
Aliquippa, PA 15001
|
1,069 sq. feet
|
2 baths 4 beds |
show details | |

|
#28
Mcgee Ave
Aliquippa, PA 15001
|
976 sq. feet
|
1 baths 3 beds |
show details | |

|
#29
Heights Rd
Aliquippa, PA 15001
|
1,162 sq. feet
|
1 baths 3 beds |
show details | |

|
#30
Maratta Rd
Aliquippa, PA 15001
|
1,367 sq. feet
|
1 baths 4 beds |
show details |
| Photo | Address | Area | Beds / Baths | Price | Details |
|---|---|---|---|---|---|

|
#31
Webb St
Aliquippa, PA 15001
|
1,500 sq. feet
|
2 baths 4 beds |
show details | |

|
#32
Columbia Dr
Aliquippa, PA 15001
|
1,844 sq. feet
|
1 baths 3 beds |
show details | |

|
#33
Woodcock Dr
Aliquippa, PA 15001
|
1,190 sq. feet
|
2 baths 3 beds |
show details | |

|
#34
Linden St
Aliquippa, PA 15001
|
1,041 sq. feet
|
1 baths 2 beds |
show details | |

|
#35
Filmore St
Aliquippa, PA 15001
|
1,196 sq. feet
|
2 baths 3 beds |
show details | |

|
#36
S Beverly Dr
Aliquippa, PA 15001
|
1,440 sq. feet
|
2 baths 4 beds |
show details | |

|
#37
Lafayette Sq
Aliquippa, PA 15001
|
992 sq. feet
|
1 baths 2 beds |
show details | |

|
#38
Davidson St
Aliquippa, PA 15001
|
960 sq. feet
|
1 baths 2 beds |
show details | |

|
#39
Eldorado Dr
Aliquippa, PA 15001
|
2,510 sq. feet
|
2 baths 3 beds |
show details | |

|
#40
Highland Ave
Aliquippa, PA 15001
|
1,440 sq. feet
|
1 baths 3 beds |
show details |
| Photo | Address | Area | Beds / Baths | Price | Details |
|---|---|---|---|---|---|

|
#41
Morningside Dr
Aliquippa, PA 15001
|
1,388 sq. feet
|
1 baths 4 beds |
show details | |

|
#42
Mckinley Ave
Aliquippa, PA 15001
|
1,615 sq. feet
|
1 baths 3 beds |
show details | |

|
#43
Tee Line Dr
Aliquippa, PA 15001
|
- sq. feet
|
- baths 4 beds |
show details | |

|
#44
Ridgeway Ave
Aliquippa, PA 15001
|
- sq. feet
|
- baths - beds |
show details | |

|
#45
Vermont Ave
Aliquippa, PA 15001
|
- sq. feet
|
- baths - beds |
show details | |

|
#46
Tee Line Dr
Aliquippa, PA 15001
|
- sq. feet
|
- baths - beds |
show details | |

|
#47
Scott Ave
Aliquippa, PA 15001
|
- sq. feet
|
- baths - beds |
show details | |

|
#48
Jack St
Aliquippa, PA 15001
|
- sq. feet
|
- baths - beds |
show details | |

|
#49
Green Garden Rd
Aliquippa, PA 15001
|
1,008 sq. feet
|
- baths - beds |
show details | |

|
Check over 1 million property listings on Foreclosure.com!
|
browse all offers | |||


- 5,04755.5%White alone
- 2,84631.3%Black alone
- 5846.4%Two or more races
- 2472.7%Hispanic
- 430.5%Asian alone
- 230.3%American Indian alone
- 230.3%Other race alone
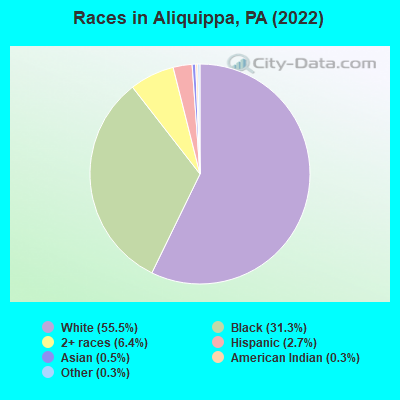
Races in Aliquippa detailed stats: ancestries, foreign born residents, place of birth
According to our research of Pennsylvania and other state lists, there were 45 registered sex offenders living in Aliquippa, Pennsylvania as of May 21, 2024.
The ratio of all residents to sex offenders in Aliquippa is 206 to 1.
Type |
2009 |
2010 |
2011 |
2012 |
2013 |
2014 |
2015 |
2016 |
2017 |
2018 |
2019 |
2020 |
2022 |
|---|---|---|---|---|---|---|---|---|---|---|---|---|---|
| Murders (per 100,000) | 5 (47.5) | 5 (53.0) | 0 (0.0) | 2 (21.2) | 1 (10.7) | 1 (10.8) | 0 (0.0) | 4 (43.7) | 2 (22.1) | 1 (11.2) | 1 (11.3) | 2 (22.8) | 1 (11.1) |
| Rapes (per 100,000) | 5 (47.5) | 3 (31.8) | 1 (10.6) | 0 (0.0) | 1 (10.7) | 2 (21.5) | 4 (43.5) | 2 (21.9) | 1 (11.1) | 1 (11.2) | 2 (22.6) | 4 (45.6) | 0 (0.0) |
| Robberies (per 100,000) | 12 (114.0) | 14 (148.3) | 8 (84.5) | 9 (95.4) | 8 (85.8) | 8 (86.1) | 15 (163.1) | 5 (54.6) | 8 (88.4) | 5 (55.9) | 4 (45.2) | 8 (91.1) | 1 (11.1) |
| Assaults (per 100,000) | 43 (408.6) | 62 (656.9) | 32 (338.0) | 35 (370.9) | 39 (418.3) | 48 (516.8) | 53 (576.3) | 42 (459.0) | 46 (508.4) | 43 (480.7) | 42 (474.9) | 24 (273.3) | 6 (66.4) |
| Burglaries (per 100,000) | 38 (361.0) | 63 (667.5) | 67 (707.6) | 48 (508.6) | 43 (461.2) | 52 (559.9) | 84 (913.3) | 62 (677.6) | 54 (596.8) | 25 (279.5) | 16 (180.9) | 23 (262.0) | 4 (44.2) |
| Thefts (per 100,000) | 113 (1,074) | 89 (943.0) | 103 (1,088) | 95 (1,007) | 83 (890.3) | 94 (1,012) | 81 (880.7) | 103 (1,126) | 97 (1,072) | 45 (503.0) | 48 (542.7) | 64 (728.9) | 11 (121.7) |
| Auto thefts (per 100,000) | 19 (180.5) | 16 (169.5) | 18 (190.1) | 14 (148.4) | 10 (107.3) | 9 (96.9) | 17 (184.8) | 18 (196.7) | 13 (143.7) | 11 (123.0) | 12 (135.7) | 14 (159.5) | 4 (44.2) |
| Arson (per 100,000) | 0 (0.0) | 0 (0.0) | 1 (10.6) | 0 (0.0) | 0 (0.0) | 0 (0.0) | 0 (0.0) | 1 (10.9) | 0 (0.0) | 0 (0.0) | 0 (0.0) | 1 (11.4) | 0 (0.0) |
| City-Data.com crime index | 331.6 | 405.3 | 209.7 | 232.9 | 215.9 | 255.4 | 312.9 | 321.3 | 277.4 | 193.7 | 194.5 | 224.3 | 50.2 |
The City-Data.com crime index weighs serious crimes and violent crimes more heavily. Higher means more crime, U.S. average is 246.1. It adjusts for the number of visitors and daily workers commuting into cities.
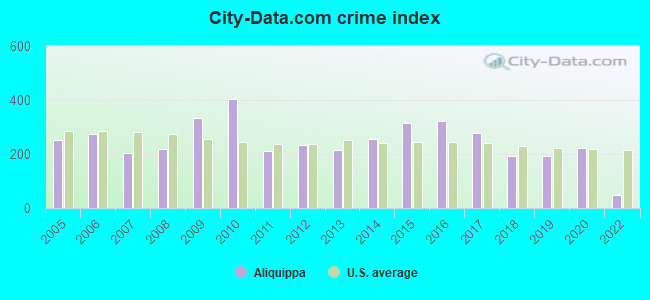
Crime rate in Aliquippa detailed stats: murders, rapes, robberies, assaults, burglaries, thefts, arson
Full-time law enforcement employees in 2021, including police officers: 13 (12 officers - 12 male; 0 female).
| Officers per 1,000 residents here: | 1.38 |
| Pennsylvania average: | 2.55 |
 Recent articles from our blog. Our writers, many of them Ph.D. graduates or candidates, create easy-to-read articles on a wide variety of topics.


 | Pittsburgh business update (401 replies) |
| Living in Center Township/Aliquippa (33 replies) |
| Exurb of the Week: Aliquippa (18 replies) |
| 5 People Shot Within 24 Hours In Allegheny County (3431 replies) |
| Moving to Hopewell Area - Crime/Advice/Concerns (5 replies) |
| Why are Pittsburghers so rude? (179 replies) |
Latest news from Aliquippa, PA collected exclusively by city-data.com from local newspapers, TV, and radio stations
Ancestries: Italian (17.3%), German (4.9%), Serbian (4.4%), English (4.1%), Irish (3.1%), Ukrainian (1.9%).
Current Local Time: EST time zone
Incorporated on 01/22/1894
Elevation: 700 feet
Land area: 4.09 square miles.
Population density: 2,213 people per square mile (low).
449 residents are foreign born (2.8% Europe, 1.3% Latin America, 0.6% Asia).
| This city: | 4.9% |
| Pennsylvania: | 7.3% |
Median real estate property taxes paid for housing units with mortgages in 2022: $1,656 (1.8%)
Median real estate property taxes paid for housing units with no mortgage in 2022: $1,664 (1.8%)
Nearest city with pop. 50,000+: Pittsburgh, PA  (19.2 miles , pop. 334,563).
Nearest city with pop. 1,000,000+: Philadelphia, PA (273.3 miles , pop. 1,517,550).
Nearest cities:
), ), ), Latitude: 40.62 N, Longitude: 80.26 W
Daytime population change due to commuting: -1,541 (-17.0%)
Workers who live and work in this city: 968 (24.6%)
Area code: 724

Aliquippa, Pennsylvania accommodation & food services, waste management - Economy and Business Data
Single-family new house construction building permits:
- 2001: 1 building, cost: $119,800
| Here: | 3.2% |
| Pennsylvania: | 2.9% |
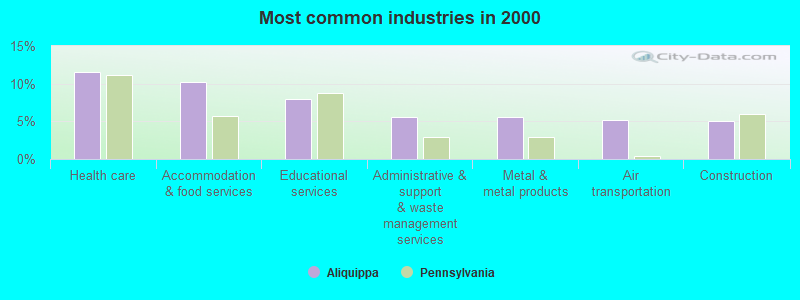
- Health care (11.6%)
- Accommodation & food services (10.2%)
- Educational services (8.0%)
- Administrative & support & waste management services (5.6%)
- Metal & metal products (5.5%)
- Air transportation (5.1%)
- Construction (5.0%)
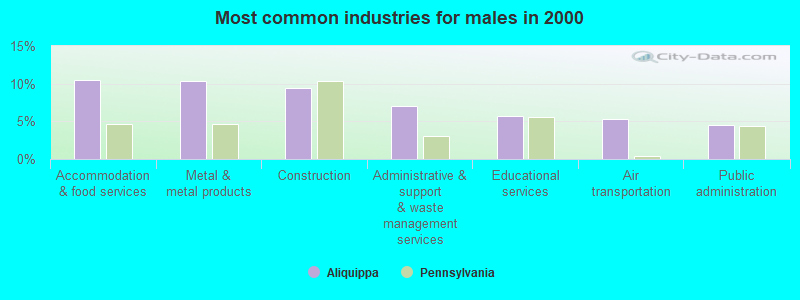
- Accommodation & food services (10.5%)
- Metal & metal products (10.3%)
- Construction (9.5%)
- Administrative & support & waste management services (7.1%)
- Educational services (5.7%)
- Air transportation (5.3%)
- Public administration (4.5%)
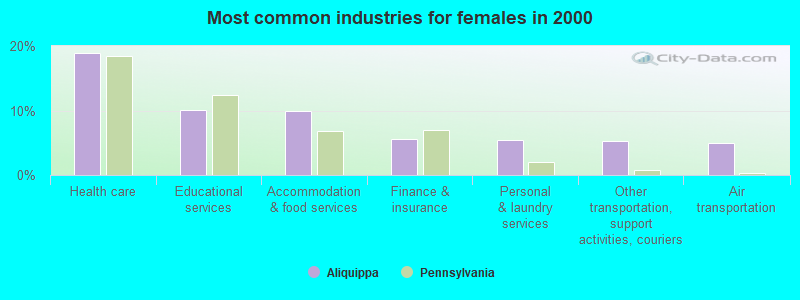
- Health care (19.0%)
- Educational services (10.1%)
- Accommodation & food services (9.9%)
- Finance & insurance (5.6%)
- Personal & laundry services (5.5%)
- Other transportation, support activities, couriers (5.3%)
- Air transportation (4.9%)
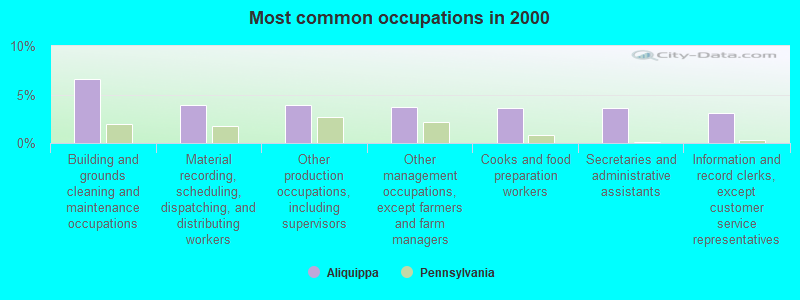
- Building and grounds cleaning and maintenance occupations (6.6%)
- Material recording, scheduling, dispatching, and distributing workers (3.9%)
- Other production occupations, including supervisors (3.9%)
- Other management occupations, except farmers and farm managers (3.7%)
- Cooks and food preparation workers (3.6%)
- Secretaries and administrative assistants (3.6%)
- Information and record clerks, except customer service representatives (3.1%)
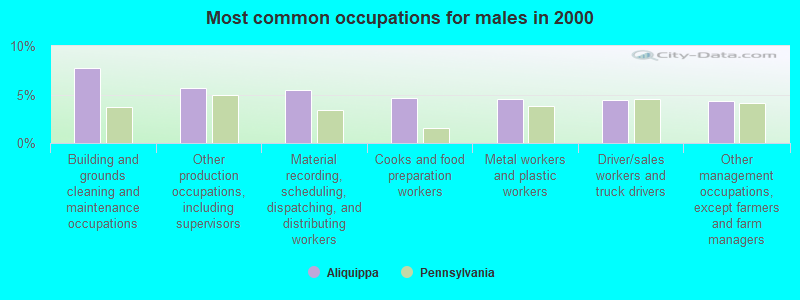
- Building and grounds cleaning and maintenance occupations (7.8%)
- Other production occupations, including supervisors (5.7%)
- Material recording, scheduling, dispatching, and distributing workers (5.5%)
- Cooks and food preparation workers (4.7%)
- Metal workers and plastic workers (4.5%)
- Driver/sales workers and truck drivers (4.4%)
- Other management occupations, except farmers and farm managers (4.4%)
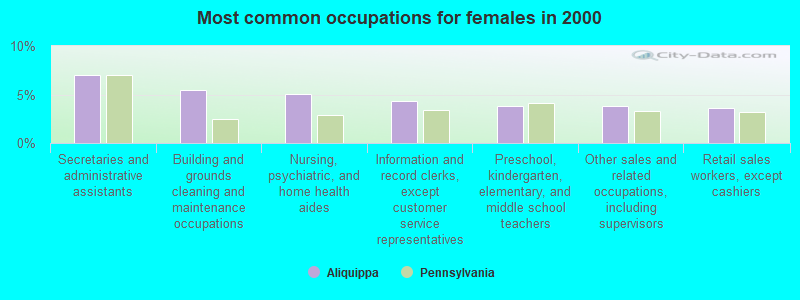
- Secretaries and administrative assistants (7.0%)
- Building and grounds cleaning and maintenance occupations (5.4%)
- Nursing, psychiatric, and home health aides (5.1%)
- Information and record clerks, except customer service representatives (4.3%)
- Preschool, kindergarten, elementary, and middle school teachers (3.9%)
- Other sales and related occupations, including supervisors (3.9%)
- Retail sales workers, except cashiers (3.6%)
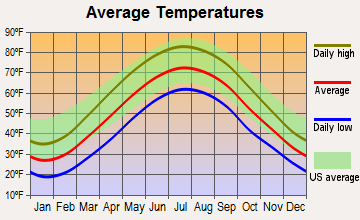
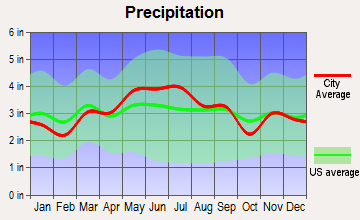
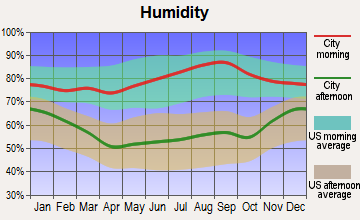
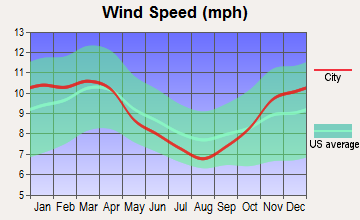
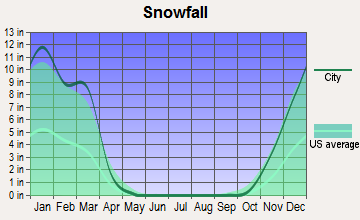
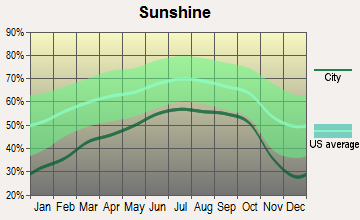
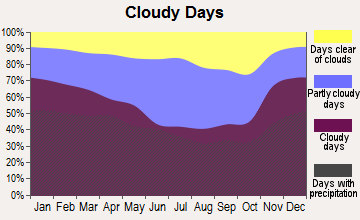
Average climate in Aliquippa, Pennsylvania
Based on data reported by over 4,000 weather stations
|
|


(lower is better)
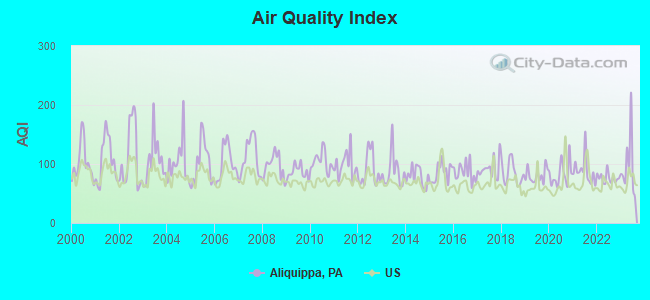
Air Quality Index (AQI) level in 2023 was 96.2. This is worse than average.
| City: | 96.2 |
| U.S.: | 72.6 |
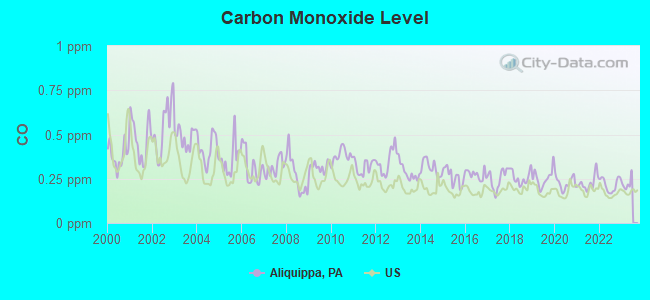
Carbon Monoxide (CO) [ppm] level in 2022 was 0.217. This is about average. Closest monitor was 2.2 miles away from the city center.
| City: | 0.217 |
| U.S.: | 0.251 |
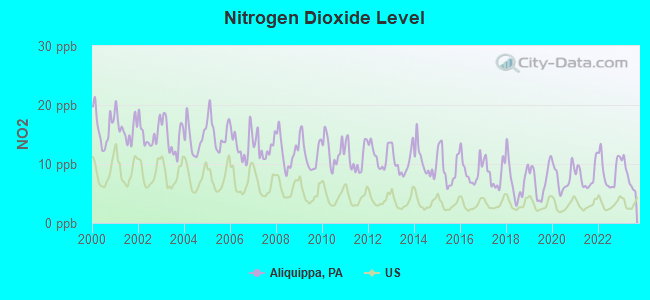
Nitrogen Dioxide (NO2) [ppb] level in 2023 was 7.99. This is significantly worse than average. Closest monitor was 2.2 miles away from the city center.
| City: | 7.99 |
| U.S.: | 5.11 |
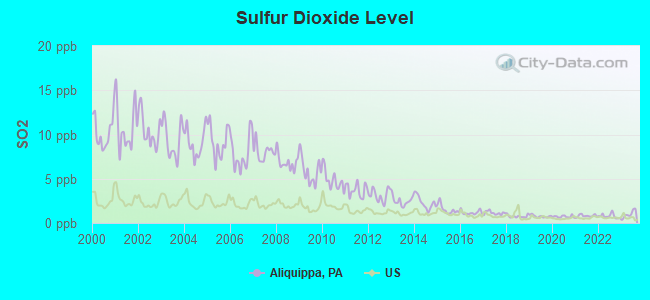
Sulfur Dioxide (SO2) [ppb] level in 2023 was 0.971. This is significantly better than average. Closest monitor was 2.2 miles away from the city center.
| City: | 0.971 |
| U.S.: | 1.515 |
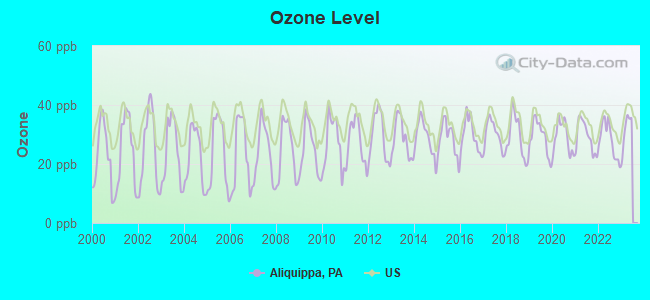
Ozone [ppb] level in 2022 was 28.1. This is about average. Closest monitor was 2.2 miles away from the city center.
| City: | 28.1 |
| U.S.: | 33.3 |
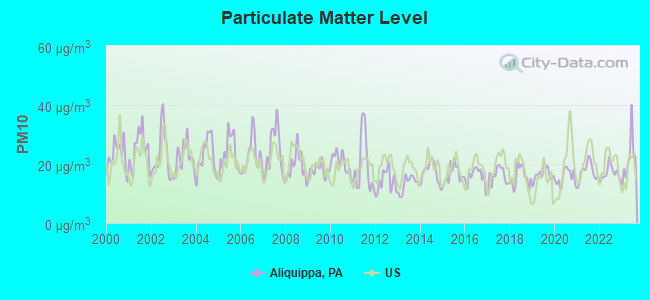
Particulate Matter (PM10) [µg/m3] level in 2023 was 21.9. This is about average. Closest monitor was 2.2 miles away from the city center.
| City: | 21.9 |
| U.S.: | 19.2 |
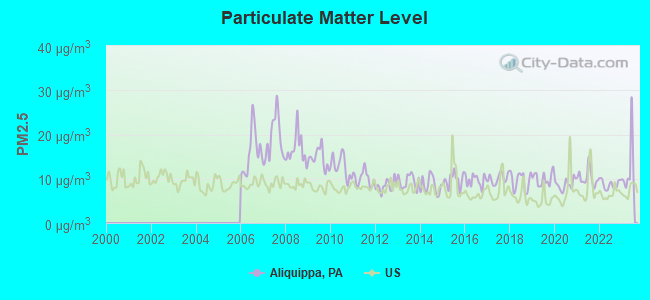
Particulate Matter (PM2.5) [µg/m3] level in 2023 was 12.3. This is significantly worse than average. Closest monitor was 5.3 miles away from the city center.
| City: | 12.3 |
| U.S.: | 8.1 |
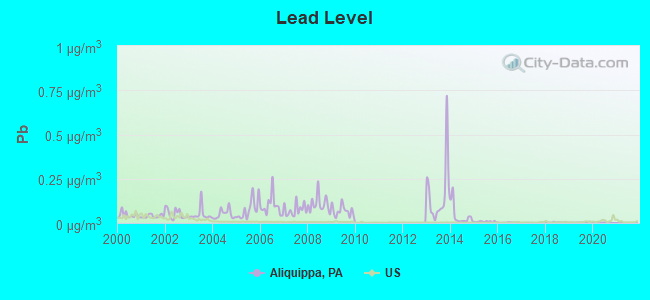
Lead (Pb) [µg/m3] level in 2020 was 0.00256. This is significantly better than average. Closest monitor was 2.1 miles away from the city center.
| City: | 0.00256 |
| U.S.: | 0.00931 |
Tornado activity:
Aliquippa-area historical tornado activity is near Pennsylvania state average. It is 10% smaller than the overall U.S. average.
On 5/31/1985, a category F5 (max. wind speeds 261-318 mph) tornado 41.8 miles away from the Aliquippa city center killed 18 people and injured 310 people and caused between $50,000,000 and $500,000,000 in damages.
On 6/3/1980, a category F4 (max. wind speeds 207-260 mph) tornado 28.1 miles away from the city center injured 140 people and caused between $50,000,000 and $500,000,000 in damages.
Earthquake activity:
Aliquippa-area historical earthquake activity is significantly above Pennsylvania state average. It is 54% smaller than the overall U.S. average.On 9/25/1998 at 19:52:52, a magnitude 5.2 (4.8 MB, 4.3 MS, 5.2 LG, 4.5 MW, Depth: 3.1 mi, Class: Moderate, Intensity: VI - VII) earthquake occurred 61.0 miles away from the city center
On 8/23/2011 at 17:51:04, a magnitude 5.8 (5.8 MW, Depth: 3.7 mi) earthquake occurred 224.8 miles away from Aliquippa center
On 1/31/1986 at 16:46:43, a magnitude 5.0 (5.0 MB) earthquake occurred 82.7 miles away from the city center
On 7/27/1980 at 18:52:21, a magnitude 5.2 (5.1 MB, 4.7 MS, 5.0 UK, 5.2 UK) earthquake occurred 257.8 miles away from the city center
On 12/31/2011 at 20:05:01, a magnitude 4.0 (4.0 ML, Depth: 3.1 mi, Class: Light, Intensity: IV - V) earthquake occurred 41.4 miles away from Aliquippa center
On 8/9/2020 at 12:07:37, a magnitude 5.1 (5.1 MW, Depth: 4.7 mi) earthquake occurred 289.8 miles away from the city center
Magnitude types: regional Lg-wave magnitude (LG), body-wave magnitude (MB), local magnitude (ML), surface-wave magnitude (MS), moment magnitude (MW)
Natural disasters:
The number of natural disasters in Beaver County (14) is near the US average (15).Major Disasters (Presidential) Declared: 10
Emergencies Declared: 4
Causes of natural disasters: Floods: 4, Storms: 4, Winter Storms: 3, Hurricanes: 2, Snowstorms: 2, Tornadoes: 2, Tropical Depressions: 2, Snowfall: 1, Tropical Storm: 1, Wind: 1, Other: 1 (Note: some incidents may be assigned to more than one category).

Hospitals and medical centers in Aliquippa:
- ALIQUIPPA COMMUNITY HOSPITAL (provides emergency services, 2500 HOSPITAL DRIVE)
- ALLEGHENY VALLEY SCHOOL (3941 PATTERSON ROAD)
- ALLEGHENY VALLEY SCHOOL (155 CLEARVIEW ROAD)
- ALLEGHENY VALLEY SCHOOL (1925 MARATTA RD)
- ALLEGHENY VALLEY SCHOOL (3949 GREEN GARDEN RD BOX 379A RD1)
- ALLEGHENY VALLEY SCHOOL (BROADHEAD ROAD) (1899 BROADHEAD ROAD)
- ALLEGHENY VALLEY SCHOOL/MAYHUE (101 MAYHUE DRIVE)
- MOTHER TERESA HOSPICE INC (400 WOODLAWN ROAD)
- BEAVER ELDER CARE AND REHAB (616 GOLF COURSE ROAD)
- LIBERTY DIALYSIS - HOPEWELL (400 CORPORATION DRIVE)
Heliports located in Aliquippa:
Amtrak station near Aliquippa:
- 19 miles: PITTSBURGH (1100 LIBERTY AVE.) . Services: ticket office, fully wheelchair accessible, enclosed waiting area, public restrooms, public payphones, vending machines, ATM, free short-term parking, paid long-term parking, call for car rental service, call for taxi service, intercity bus service, public transit connection.
Operable nuclear power plants near Aliquippa:
- 9 miles: Beaver Valley 1 and 2 in Shippingport, PA.
Colleges/universities with over 2000 students nearest to Aliquippa:
- Robert Morris University (about 8 miles; Moon Township, PA; Full-time enrollment: 4,823)
- Pittsburgh Technical Institute (about 14 miles; Oakdale, PA; FT enrollment: 2,805)
- Community College of Allegheny County (about 18 miles; Pittsburgh, PA; FT enrollment: 13,486)
- Point Park University (about 19 miles; Pittsburgh, PA; FT enrollment: 3,525)
- The Art Institute of Pittsburgh-Online Division (about 19 miles; Pittsburgh, PA; FT enrollment: 11,040)
- Duquesne University (about 19 miles; Pittsburgh, PA; FT enrollment: 8,211)
- University of Pittsburgh-Pittsburgh Campus (about 21 miles; Pittsburgh, PA; FT enrollment: 27,137)
Public high schools in Aliquippa:
- HOPEWELL SHS (Students: 538, Location: 1215 LONGVUE AVE, Grades: 9-12)
- ALIQUIPPA JSHS (Students: 386, Location: 800 21ST STREET, Grades: 7-12)
Private high schools in Aliquippa:
- BETHEL CHRISTIAN SCHOOL (Students: 39, Location: 4549 STATE ROUTE 151, Grades: KG-12)
- DELIVERANCE TEMPLE MINISTRIES ROOTS CHRISTIAN ACAD (Students: 12, Location: 392 FRANKLIN AVE, Grades: 8-11)
- GATEWAY LICENSED PRIVATE ACADEMIC SCHOOL (Students: 9, Location: 100 MOFFETT RUN RD, Grades: 8-11, Boys only)
- THE HOPE CHRISTIAN ACADEMY (Students: 7, Location: 434 FRANKLIN AVE, Grades: 1-10)
Public elementary/middle schools in Aliquippa:
- HOPEWELL EL SCH (Students: 973, Location: 3000 KANE ROAD, Grades: KG-4)
- HOPEWELL JHS (Students: 850, Location: 2354 BRODHEAD RD, Grades: 5-8)
- ALIQUIPPA EL SCH (Students: 368, Location: 800 TWENTY-FIRST STREET, Grades: KG-6)
- INDEPENDENCE EL SCH (Students: 195, Location: RR 1 BOX 103, Grades: KG-4)
- MARGARET ROSS EL SCH (Students: 181, Location: 1955 MARATTA RD, Grades: KG-4)
- CENTER GRANGE PRIMARY SCHOOL (Location: 225 CENTER GRANGE RD, Grades: PK-2)
Private elementary/middle school in Aliquippa:
Points of interest:
Notable locations in Aliquippa: B F Jones Memorial Library (A), Civic Senior Citizens Club (B), Rhyming Thyme Day Care Center (C), Aliquippa Bureau of Fire (D). Display/hide their locations on the map
Shopping Center: Aliquippa Shopping Center (1). Display/hide its location on the map
Church in Aliquippa: Mount Carmel United Presbyterian Church (A). Display/hide its location on the map
Cemetery: Woodlawn Cemetery (1). Display/hide its location on the map
Streams, rivers, and creeks: Logtown Run (A). Display/hide its location on the map
Park in Aliquippa: Moree Field (1). Display/hide its location on the map
Birthplace of: Darrelle Revis - Football cornerback, Pete Maravich - Serb- basketball player, Bob Babich (American football coach) - Football coach, Damon Denson - Football player, Doc Medich - Baseball player, Sean Gilbert - Football player, Ty Law - 2005 NFL player (New York Jets, born: Feb 10, 1974), Charles Fisher (American football) - Football player, Jonathan Baldwin - Football wide receiver, Nick Colafella - Politician.
Drinking water stations with addresses in Aliquippa and their reported violations in the past:
ALIQUIPPA MUNI WATER AUTH (Population served: 14,250, Groundwater):Past health violations:CENTER TWP WATER AUTH (Population served: 12,500, Groundwater):Past monitoring violations:
- Treatment Technique (SWTR and GWR) - In FEB-2014, Contaminant: GROUNDWATER RULE. Follow-up actions: St Violation/Reminder Notice (MAR-25-2014), St Compliance achieved (APR-01-2014)
- Treatment Technique (SWTR and GWR) - In OCT-2013, Contaminant: GROUNDWATER RULE. Follow-up actions: St Violation/Reminder Notice (DEC-02-2013), St Compliance achieved (DEC-09-2013)
- Monitoring of Treatment (SWTR-Unfilt/GWR) - In JAN-2014, Contaminant: GROUNDWATER RULE. Follow-up actions: St Violation/Reminder Notice (FEB-26-2014), St Compliance achieved (MAR-17-2014)
- Monitoring, Routine (IDSE) - In OCT-01-2007, Contaminant: DBP STAGE 2. Follow-up actions: Fed FAO issued (DEC-26-2007), Fed Compliance achieved (FEB-11-2008)
- Monitoring and Reporting (DBP) - Between JUL-2007 and SEP-2007, Contaminant: TTHM. Follow-up actions: St Public Notif requested (OCT-24-2007), St Violation/Reminder Notice (OCT-24-2007), St Compliance achieved (DEC-12-2007), St Public Notif received (DEC-12-2007)
- Monitoring and Reporting (DBP) - Between JUL-2007 and SEP-2007, Contaminant: Total Haloacetic Acids (HAA5). Follow-up actions: St Public Notif requested (OCT-24-2007), St Violation/Reminder Notice (OCT-24-2007), St Compliance achieved (DEC-12-2007), St Public Notif received (DEC-12-2007)
- Monitoring and Reporting (DBP) - Between JAN-2006 and MAR-2006, Contaminant: Chlorine. Follow-up actions: St Consent Decree/Judgement (MAR-30-2006), St Compliance achieved (MAR-30-2006), St Violation/Reminder Notice (MAR-30-2006)
Past health violations:R W YOUNG V F W POST 8805 (Population served: 80, Groundwater):Past monitoring violations:
- Treatment Technique (SWTR and GWR) - In JAN-2014, Contaminant: GROUNDWATER RULE. Follow-up actions: St Site Visit (enforcement) (MAR-17-2014), St Compliance achieved (MAR-17-2014)
- Monitoring and Reporting (DBP) - Between APR-2014 and JUN-2014, Contaminant: TTHM. Follow-up actions: St Site Visit (enforcement) (AUG-18-2014), St Public Notif requested (AUG-18-2014)
- Monitoring and Reporting (DBP) - Between APR-2014 and JUN-2014, Contaminant: Total Haloacetic Acids (HAA5). Follow-up actions: St Site Visit (enforcement) (AUG-18-2014), St Public Notif requested (AUG-18-2014)
- Monitoring and Reporting (DBP) - Between APR-2011 and JUN-2011, Contaminant: Chlorine. Follow-up actions: St Violation/Reminder Notice (JUN-07-2011), St Compliance achieved (JUN-15-2011)
- 4 regular monitoring violations
Past monitoring violations:INDEPENDENCE VOL FIRE DEPT (Population served: 25, Groundwater):
- 2 regular monitoring violations
Past monitoring violations:HOPEWELL TWP COMMUNITY PARK (Population served: 25, Groundwater):
- 4 routine major monitoring violations
- 16 regular monitoring violations
Past monitoring violations:
- One routine major monitoring violation
- 2 regular monitoring violations
| This city: | 2.1 people |
| Pennsylvania: | 2.5 people |
| This city: | 56.6% |
| Whole state: | 65.0% |
| This city: | 7.1% |
| Whole state: | 6.6% |
Likely homosexual households (counted as self-reported same-sex unmarried-partner households)
- Lesbian couples: 0.3% of all households
- Gay men: 0.2% of all households
People in group quarters in Aliquippa in 2010:
- 21 people in emergency and transitional shelters (with sleeping facilities) for people experiencing homelessness
- 16 people in nursing facilities/skilled-nursing facilities
- 15 people in correctional residential facilities
- 11 people in other noninstitutional facilities
- 4 people in residential treatment centers for adults
- 2 people in group homes intended for adults
People in group quarters in Aliquippa in 2000:
- 31 people in other noninstitutional group quarters
- 24 people in homes for the mentally retarded
- 20 people in mental (psychiatric) hospitals or wards
- 16 people in nursing homes
- 9 people in homes or halfway houses for drug/alcohol abuse
- 9 people in religious group quarters
Banks with branches in Aliquippa (2011 data):
- Citizens Bank of Pennsylvania: Hopewell Branch, Aliquippa Giant Eagle Branch, New Sheffield Branch. Info updated 2010/09/24: Bank assets: $32,316.9 mil, Deposits: $25,297.1 mil, headquarters in Philadelphia, PA, positive income, 396 total offices, Holding Company: Uk Financial Investments Limited
- ESB Bank: Hopewell Branch at 2293 Broadhead Road, branch established on 1888/01/01; Economy Branch at 2301 Sheffield Road, branch established on 1904/01/01. Info updated 2006/11/03: Bank assets: $1,923.4 mil, Deposits: $1,159.8 mil, headquarters in Ellwood City, PA, positive income, Mortgage Lending Specialization, 24 total offices
- First National Bank of Pennsylvania: Aliquippa Branch at 2719 Brodhead Road, branch established on 1923/01/01. Info updated 2012/01/10: Bank assets: $9,581.0 mil, Deposits: $7,462.2 mil, headquarters in Greenville, PA, positive income, Commercial Lending Specialization, 291 total offices, Holding Company: F.N.b. Corporation
- The Huntington National Bank: New Sheffield Branch at 2706 Brodhead Road, branch established on 1970/11/23. Info updated 2012/04/02: Bank assets: $54,183.4 mil, Deposits: $44,300.3 mil, headquarters in Columbus, OH, positive income, Commercial Lending Specialization, 878 total offices, Holding Company: Huntington Bancshares Incorporated
- PNC Bank, National Association: New Sheffield Branch at 2676 Brodhead Road, branch established on 1964/11/23. Info updated 2012/03/20: Bank assets: $263,309.6 mil, Deposits: $197,343.0 mil, headquarters in Wilmington, DE, positive income, Commercial Lending Specialization, 3085 total offices, Holding Company: Pnc Financial Services Group, Inc., The
For population 15 years and over in Aliquippa:

- Never married: 42.7%
- Now married: 37.7%
- Separated: 1.7%
- Widowed: 6.4%
- Divorced: 11.6%
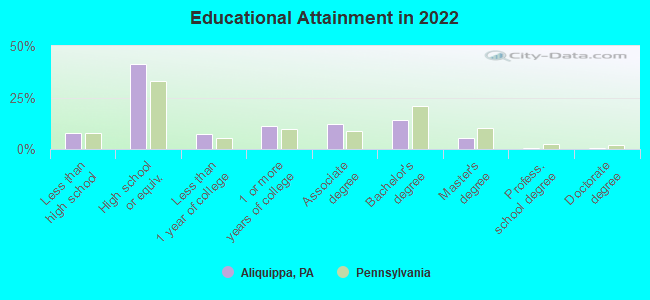
For population 25 years and over in Aliquippa:
- High school or higher: 91.6%
- Bachelor's degree or higher: 19.2%
- Graduate or professional degree: 6.2%
- Unemployed: 8.4%
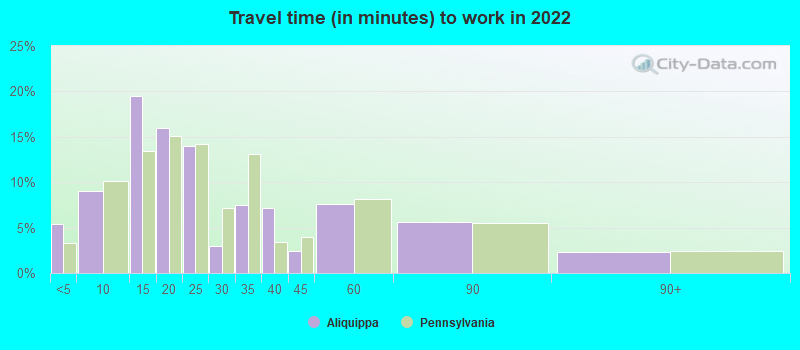
- Mean travel time to work (commute): 21.9 minutes
| Here: | 10.1 |
| Pennsylvania average: | 11.4 |
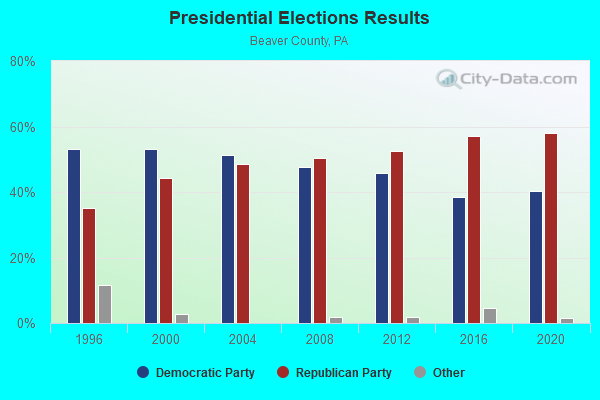
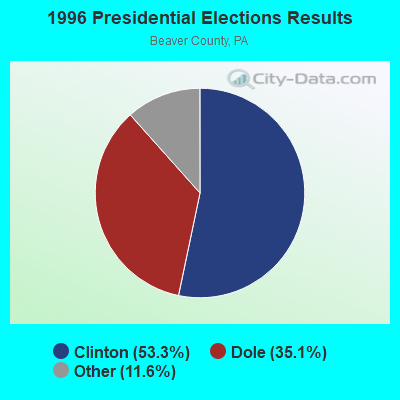
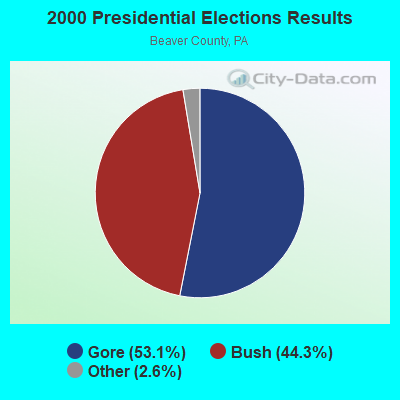


Graphs represent county-level data. Detailed 2008 Election Results
Religion statistics for Aliquippa, PA (based on Beaver County data)
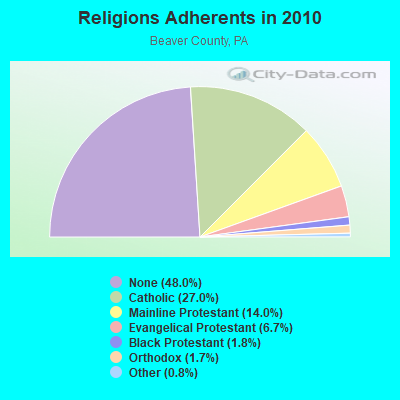
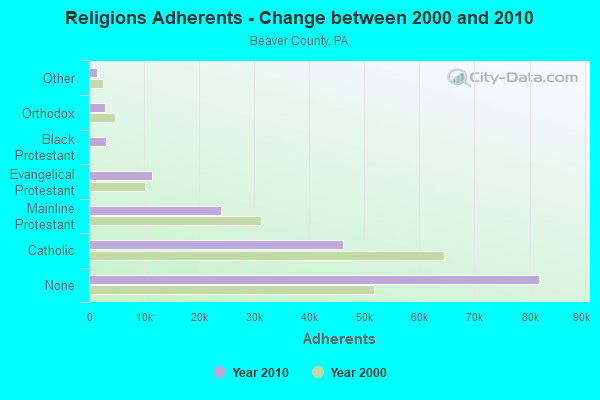
| Religion | Adherents | Congregations |
|---|---|---|
| Catholic | 46,096 | 22 |
| Mainline Protestant | 23,930 | 86 |
| Evangelical Protestant | 11,390 | 92 |
| Black Protestant | 3,117 | 15 |
| Orthodox | 2,834 | 9 |
| Other | 1,367 | 8 |
| None | 81,805 | - |
Food Environment Statistics:
| Beaver County: | 2.02 / 10,000 pop. |
| Pennsylvania: | 2.04 / 10,000 pop. |
| This county: | 0.12 / 10,000 pop. |
| State: | 0.09 / 10,000 pop. |
| Beaver County: | 0.87 / 10,000 pop. |
| Pennsylvania: | 0.88 / 10,000 pop. |
| Beaver County: | 2.54 / 10,000 pop. |
| State: | 2.52 / 10,000 pop. |
| Here: | 4.91 / 10,000 pop. |
| State: | 7.12 / 10,000 pop. |
| This county: | 10.0% |
| Pennsylvania: | 9.1% |
| Beaver County: | 29.3% |
| Pennsylvania: | 27.2% |
| This county: | 11.1% |
| State: | 11.5% |
Health and Nutrition:
| Aliquippa: | 54.8% |
| Pennsylvania: | 50.2% |
| This city: | 53.0% |
| Pennsylvania: | 47.1% |
| Aliquippa: | 28.6 |
| Pennsylvania: | 28.7 |
| Aliquippa: | 16.9% |
| Pennsylvania: | 20.8% |
| Aliquippa: | 10.2% |
| Pennsylvania: | 10.9% |
| Aliquippa: | 6.9 |
| Pennsylvania: | 6.8 |
| This city: | 34.9% |
| Pennsylvania: | 34.3% |
| Here: | 59.9% |
| Pennsylvania: | 56.2% |
| Aliquippa: | 80.0% |
| Pennsylvania: | 78.3% |
More about Health and Nutrition of Aliquippa, PA Residents
| Local government employment and payroll (March 2022) | |||||
| Function | Full-time employees | Monthly full-time payroll | Average yearly full-time wage | Part-time employees | Monthly part-time payroll |
|---|---|---|---|---|---|
| Police Protection - Officers | 16 | $110,347 | $82,760 | 74 | $140,567 |
| Solid Waste Management | 13 | $56,688 | $52,327 | 14 | $27,408 |
| Other Government Administration | 7 | $30,638 | $52,522 | 54 | $30,100 |
| Streets and Highways | 7 | $36,743 | $62,988 | 0 | $0 |
| Parks and Recreation | 3 | $13,429 | $53,716 | 79 | $31,125 |
| Other and Unallocable | 3 | $13,605 | $54,420 | 20 | $13,867 |
| Financial Administration | 0 | $0 | 7 | $5,368 | |
| Totals for Government | 49 | $261,450 | $64,029 | 248 | $248,435 |
Aliquippa government finances - Expenditure in 2017 (per resident):
- Current Operations - Police Protection: $2,466,000 ($272.37)
Local Fire Protection: $1,140,000 ($125.91)
Regular Highways: $1,071,000 ($118.29)
Solid Waste Management: $465,000 ($51.36)
General - Other: $407,000 ($44.95)
Central Staff Services: $211,000 ($23.30)
Financial Administration: $93,000 ($10.27)
General Public Buildings: $60,000 ($6.63)
Judicial and Legal Services: $49,000 ($5.41)
Parks and Recreation: $11,000 ($1.21)
Libraries: $10,000 ($1.10)
- General - Interest on Debt: $3,000 ($0.33)
- Other Capital Outlay - Police Protection: $120,000 ($13.25)
Central Staff Services: $80,000 ($8.84)
- Total Salaries and Wages: $2,158,000 ($238.35)
Aliquippa government finances - Revenue in 2017 (per resident):
- Charges - Solid Waste Management: $592,000 ($65.39)
Other: $261,000 ($28.83)
Regular Highways: $5,000 ($0.55)
- Local Intergovernmental - General Local Government Support: $46,000 ($5.08)
- Miscellaneous - Fines and Forfeits: $45,000 ($4.97)
Donations From Private Sources: $32,000 ($3.53)
General Revenue - Other: $5,000 ($0.55)
- State Intergovernmental - Other: $378,000 ($41.75)
Highways: $292,000 ($32.25)
General Local Government Support: $9,000 ($0.99)
- Tax - Property: $2,308,000 ($254.91)
Individual Income: $1,720,000 ($189.97)
Occupation and Business License - Other: $239,000 ($26.40)
Public Utility License: $143,000 ($15.79)
Documentary and Stock Transfer: $45,000 ($4.97)
Aliquippa government finances - Debt in 2017 (per resident):
- Long Term Debt - Retired Unspecified Public Purpose: $109,000 ($12.04)
Beginning Outstanding - Unspecified Public Purpose: $66,000 ($7.29)
Issue, Unspecified Public Purpose: $52,000 ($5.74)
Outstanding Unspecified Public Purpose: $10,000 ($1.10)
Aliquippa government finances - Cash and Securities in 2017 (per resident):
- Bond Funds - Cash and Securities: $5,000 ($0.55)
- Other Funds - Cash and Securities: $65,000 ($7.18)
| Businesses in Aliquippa, PA | ||||
| Name | Count | Name | Count | |
|---|---|---|---|---|
| Ace Hardware | 1 | MasterBrand Cabinets | 6 | |
| Advance Auto Parts | 1 | McDonald's | 2 | |
| Arby's | 1 | New Balance | 2 | |
| AutoZone | 1 | Nike | 1 | |
| CVS | 2 | Papa John's Pizza | 1 | |
| Chevrolet | 1 | Payless | 1 | |
| Circle K | 2 | Pizza Hut | 1 | |
| Cricket Wireless | 2 | Rite Aid | 1 | |
| Curves | 1 | SAS Shoes | 1 | |
| Dairy Queen | 1 | Subway | 2 | |
| Decora Cabinetry | 2 | True Value | 1 | |
| FedEx | 3 | U-Haul | 2 | |
| GNC | 1 | UPS | 2 | |
| H&R Block | 1 | Wendy's | 1 | |
| KFC | 1 | |||
Strongest AM radio stations in Aliquippa:
- KDKA (1020 AM; 50 kW; PITTSBURGH, PA; Owner: INFINITY BROADCASTING OPERATIONS, INC.)
- WMBA (1460 AM; 0 kW; AMBRIDGE, PA; Owner: IORIO BROADCASTING, INC.)
- WPIT (730 AM; 5 kW; PITTSBURGH, PA; Owner: PENNSYLVANIA MEDIA ASSOCIATES, INC.)
- WBGG (970 AM; 5 kW; PITTSBURGH, PA; Owner: AMFM RADIO LICENSES, L.L.C.)
- WWVA (1170 AM; 53 kW; WHEELING, WV; Owner: CAPSTAR TX LIMITED PARTNERSHIP)
- KQV (1410 AM; 5 kW; PITTSBURGH, PA; Owner: CALVARY, INC.)
- WWCS (540 AM; 5 kW; CANONSBURG, PA; Owner: BIRACH BROADCASTING CORPORATION)
- WZUM (1590 AM; 4 kW; CARNEGIE, PA; Owner: HORVATH BROADCASTING, L.L.C.)
- WBVP (1230 AM; 1 kW; BEAVER FALLS, PA; Owner: IORIO BROADCASTING, INC.)
- WJAS (1320 AM; 6 kW; PITTSBURGH, PA; Owner: RENDA BROADCASTING CORP. OF NEVADA)
- WEAE (1250 AM; 5 kW; PITTSBURGH, PA; Owner: ABC, INC.)
- WKBN (570 AM; 5 kW; YOUNGSTOWN, OH; Owner: CITICASTERS LICENSES, L.P.)
- WKST (1200 AM; 5 kW; NEW CASTLE, PA; Owner: CITICASTERS LICENSES, L.P.)
Strongest FM radio stations in Aliquippa:
- WOGF (104.3 FM; EAST LIVERPOOL, OH; Owner: KEYMARKET LICENSES, LLC)
- WAMO-FM (106.7 FM; BEAVER FALLS, PA; Owner: MCL/MCM-INC)
- WLTJ (92.9 FM; PITTSBURGH, PA; Owner: WPNT, INC.)
- WDVE (102.5 FM; PITTSBURGH, PA; Owner: CAPSTAR TX LIMITED PARTNERSHIP)
- WSHH (99.7 FM; PITTSBURGH, PA; Owner: RENDA B/CING CORP. OF NEVADA)
- WJJJ (104.7 FM; PITTSBURGH, PA; Owner: CAPSTAR TX LIMITED PARTNERSHIP)
- WDSY-FM (107.9 FM; PITTSBURGH, PA; Owner: INFINITY RADIO SUBSIDIARY OPERATIONS INC.)
- WWSW-FM (94.5 FM; PITTSBURGH, PA; Owner: AMFM RADIO LICENSES, L.L.C.)
- WZPT (100.7 FM; NEW KENSINGTON, PA; Owner: INFINITY RADIO SUBSIDIARY OPERATIONS INC.)
- WQED-FM (89.3 FM; PITTSBURGH, PA; Owner: WQED MULTIMEDIA)
- WORD-FM (101.5 FM; PITTSBURGH, PA; Owner: PENNSYLVANIA MEDIA ASSOCIATES, INC.)
- WBZZ (93.7 FM; PITTSBURGH, PA; Owner: INFINITY RADIO SUBSIDIARY OPERATIONS INC.)
- WMXY (98.9 FM; YOUNGSTOWN, OH; Owner: CITICASTERS LICENSES, L.P.)
- WOGH (103.5 FM; BURGETTSTOWN, PA; Owner: KEYMARKET LICENSES, LLC)
- WOGI (98.3 FM; DUQUESNE, PA; Owner: KEYMARKET LICENSES, LLC)
- WDUQ (90.5 FM; PITTSBURGH, PA; Owner: DUQUESNE UNIVERSITY)
- WXDX-FM (105.9 FM; PITTSBURGH, PA; Owner: CAPSTAR TX LIMITED PARTNERSHIP)
- WKST-FM (96.1 FM; PITTSBURGH, PA; Owner: CAPSTAR TX LIMITED PARTNERSHIP)
- WPTS-FM (92.1 FM; PITTSBURGH, PA; Owner: UNIV. OF PITTSBURGH COMMONWEALTH SYS)
- WRRK (96.9 FM; BRADDOCK, PA; Owner: WPNT INC)
TV broadcast stations around Aliquippa:
- W66BQ (Channel 66; BEAVER, PA; Owner: BRUNO-GOODWORTH NETWORK, INC.)
- WPXI (Channel 11; PITTSBURGH, PA; Owner: WPXI-TV HOLDINGS, INC.)
- KDKA-TV (Channel 2; PITTSBURGH, PA; Owner: CBS BROADCASTING INC.)
- WTOV-TV (Channel 9; STEUBENVILLE, OH; Owner: WTOV-TV HOLDINGS, INC.)
- WWBP-LP (Channel 25; FREEDOM, PA; Owner: ABACUS TELEVISION)
- WPGH-TV (Channel 53; PITTSBURGH, PA; Owner: WPGH LICENSEE, LLC)
- WBGN-LP (Channel 59; PITTSBURGH, PA; Owner: BRUNO GOODWORTH NETWORK, INC.)
- WPTG-LP (Channel 69; PITTSBURGH, PA; Owner: ABACUS TELEVISION)
- WQEX (Channel 16; PITTSBURGH, PA; Owner: WQED MULTIMEDIA)
- WBPA-LP (Channel 29; PITTSBURGH, PA; Owner: VENTURE TECHNOLOGIES GROUP, LLC)
- W65CG (Channel 65; PITTSBURGH, PA; Owner: TRINITY BROADCASTING NETWORK)
- WKBN-TV (Channel 27; YOUNGSTOWN, OH; Owner: PIEDMONT TELEVISION OF YOUNGSTOWN LICENSE LLC)
- WQED (Channel 13; PITTSBURGH, PA; Owner: WQED MULTIMEDIA)
- W61CC (Channel 61; PITTSBURGH, PA; Owner: THE VIDEOHOUSE, INC.)
- WTAE-TV (Channel 4; PITTSBURGH, PA; Owner: WTAE HEARST-ARGYLE TV, INC. (CA CORP.))
- WIIC-LP (Channel 29; PITTSBURGH, PA; Owner: ABACUS TELEVISION)
- WPCB-TV (Channel 40; GREENSBURG, PA; Owner: CORNERSTONE TELEVISION, INC.)
- W25CI (Channel 25; STEUBENVILLE, OH; Owner: ABACUS TELEVISION)
- W57BH (Channel 57; WEIRTON, WV; Owner: TURNPIKE TELEVISION)
- WCWB (Channel 22; PITTSBURGH, PA; Owner: WCWB LICENSEE, LLC)
- WFMJ-TV (Channel 21; YOUNGSTOWN, OH; Owner: WFMJ TELEVISION, INC.)
- W63AU (Channel 63; PITTSBURGH, PA; Owner: THE BON-TELE NETWORK, INC.)
- WBYD-CA (Channel 35; JOHNSTOWN, PA; Owner: BENJAMIN PEREZ)
- WYFX-LP (Channel 62; YOUNGSTOWN, OH; Owner: PIEDMONT TELEVISION OF YOUNGSTOWN LICENSE LLC)
- W56CL (Channel 56; NEW CASTLE, PA; Owner: BRUNO-GOODWORTH NETWORK, INC.)
- National Bridge Inventory (NBI) Statistics
- 42Number of bridges
- 358ft / 109mTotal length
- $6,596,000Total costs
- 293,183Total average daily traffic
- 26,498Total average daily truck traffic
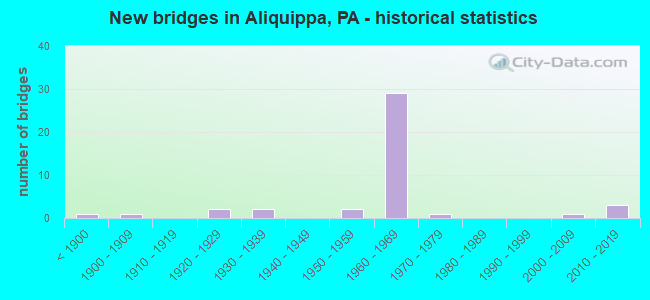
- New bridges - historical statistics
- 1Before 1900
- 11900-1909
- 21920-1929
- 21930-1939
- 21950-1959
- 291960-1969
- 11970-1979
- 12000-2009
- 32010-2019
FCC Registered Private Land Mobile Towers: 3 (See the full list of FCC Registered Private Land Mobile Towers in Aliquippa, PA)
FCC Registered Broadcast Land Mobile Towers: 25 (See the full list of FCC Registered Broadcast Land Mobile Towers)
FCC Registered Microwave Towers: 13 (See the full list of FCC Registered Microwave Towers in this town)
FCC Registered Paging Towers: 3 (See the full list of FCC Registered Paging Towers)
FCC Registered Maritime Coast & Aviation Ground Towers: 1 (See the full list of FCC Registered Maritime Coast & Aviation Ground Towers)
FCC Registered Amateur Radio Licenses: 116 (See the full list of FCC Registered Amateur Radio Licenses in Aliquippa)
FAA Registered Aircraft: 19 (See the full list of FAA Registered Aircraft in Aliquippa)
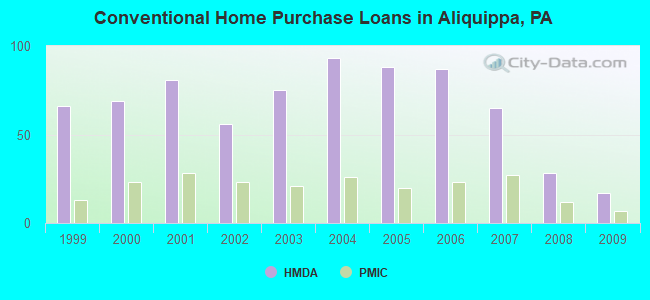
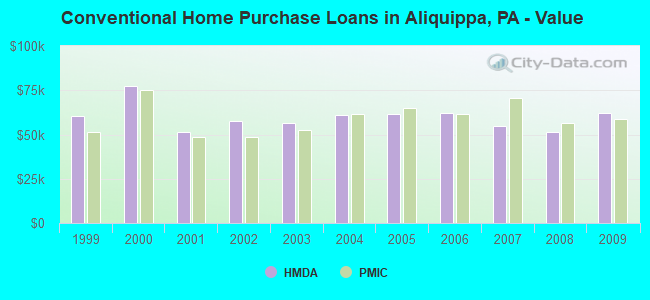
| Home Mortgage Disclosure Act Aggregated Statistics For Year 2009 (Based on 5 full tracts) | ||||||||||||
| A) FHA, FSA/RHS & VA Home Purchase Loans | B) Conventional Home Purchase Loans | C) Refinancings | D) Home Improvement Loans | E) Loans on Dwellings For 5+ Families | F) Non-occupant Loans on < 5 Family Dwellings (A B C & D) | |||||||
|---|---|---|---|---|---|---|---|---|---|---|---|---|
| Number | Average Value | Number | Average Value | Number | Average Value | Number | Average Value | Number | Average Value | Number | Average Value | |
| LOANS ORIGINATED | 33 | $77,152 | 17 | $62,118 | 42 | $72,810 | 17 | $25,059 | 1 | $180,000 | 5 | $32,200 |
| APPLICATIONS APPROVED, NOT ACCEPTED | 1 | $86,000 | 4 | $89,250 | 10 | $74,400 | 2 | $16,500 | 0 | $0 | 1 | $28,000 |
| APPLICATIONS DENIED | 4 | $125,250 | 6 | $31,000 | 53 | $71,528 | 24 | $17,750 | 0 | $0 | 5 | $45,800 |
| APPLICATIONS WITHDRAWN | 3 | $108,000 | 3 | $28,333 | 30 | $77,200 | 3 | $37,000 | 0 | $0 | 2 | $30,500 |
| FILES CLOSED FOR INCOMPLETENESS | 1 | $57,000 | 1 | $100,000 | 3 | $52,000 | 0 | $0 | 0 | $0 | 0 | $0 |
Detailed HMDA statistics for the following Tracts: 6043.00 , 6044.00, 6045.00, 6046.00, 6047.00
| Private Mortgage Insurance Companies Aggregated Statistics For Year 2009 (Based on 3 full tracts) | ||
| A) Conventional Home Purchase Loans | ||
|---|---|---|
| Number | Average Value | |
| LOANS ORIGINATED | 7 | $58,857 |
| APPLICATIONS APPROVED, NOT ACCEPTED | 0 | $0 |
| APPLICATIONS DENIED | 1 | $35,000 |
| APPLICATIONS WITHDRAWN | 1 | $35,000 |
| FILES CLOSED FOR INCOMPLETENESS | 1 | $44,000 |
Detailed PMIC statistics for the following Tracts: 6043.00 , 6044.00, 6045.00, 6046.00, 6047.00
2004 - 2018 National Fire Incident Reporting System (NFIRS) incidents
- Fire incident types reported to NFIRS in Aliquippa, PA
- 47461.3%Structure Fires
- 14618.9%Outside Fires
- 8511.0%Mobile Property/Vehicle Fires
- 688.8%Other
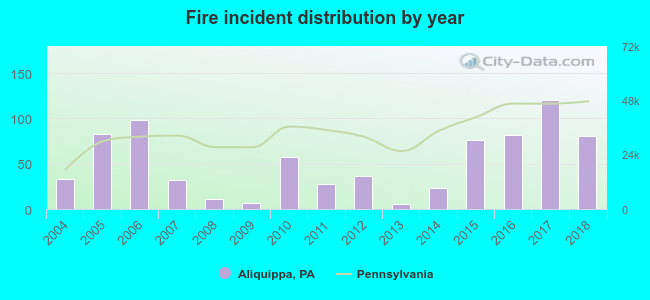 According to the data from the years 2004 - 2018 the average number of fire incidents per year is 52. The highest number of fires - 120 took place in 2017, and the least - 6 in 2013. The data has an increasing trend.
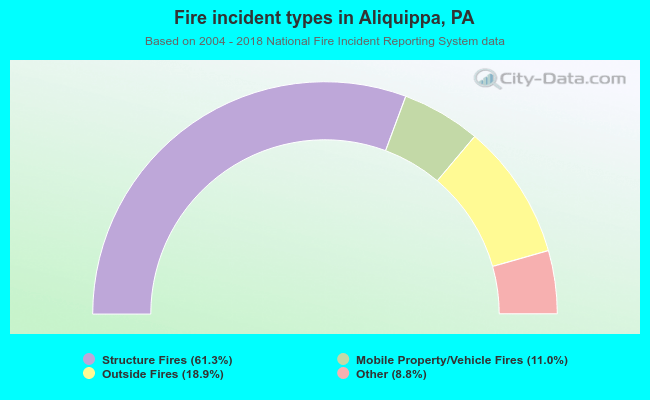 When looking into fire subcategories, the most incidents belonged to: Structure Fires (61.3%), and Outside Fires (18.9%).
| Most common first names in Aliquippa, PA among deceased individuals | ||
| Name | Count | Lived (average) |
|---|---|---|
| John | 611 | 74.0 years |
| Mary | 493 | 79.3 years |
| Joseph | 306 | 73.7 years |
| William | 284 | 71.4 years |
| George | 279 | 74.3 years |
| James | 251 | 69.8 years |
| Anna | 245 | 80.9 years |
| Robert | 177 | 68.7 years |
| Helen | 171 | 77.5 years |
| Frank | 171 | 74.7 years |
| Most common last names in Aliquippa, PA among deceased individuals | ||
| Last name | Count | Lived (average) |
|---|---|---|
| Smith | 80 | 72.4 years |
| Miller | 73 | 72.2 years |
| Williams | 63 | 72.0 years |
| Thomas | 53 | 78.1 years |
| Johnson | 45 | 70.4 years |
| Jones | 44 | 75.9 years |
| Anderson | 42 | 74.3 years |
| Brown | 40 | 72.7 years |
| Ross | 38 | 75.8 years |
| Wilson | 37 | 73.6 years |
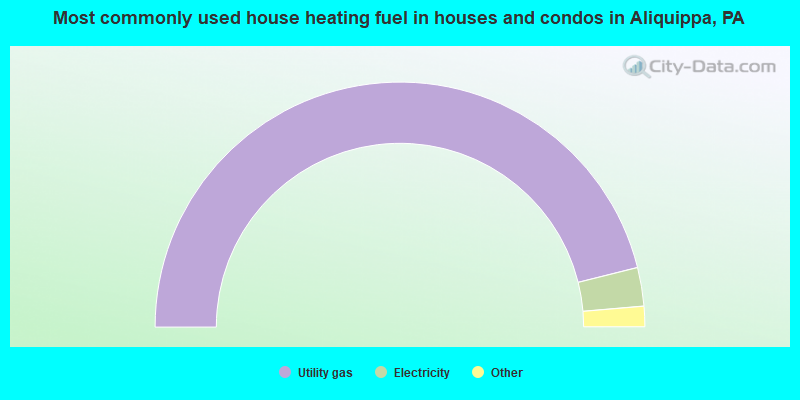
- 92.2%Utility gas
- 5.1%Electricity
- 1.8%Fuel oil, kerosene, etc.
- 0.9%Bottled, tank, or LP gas
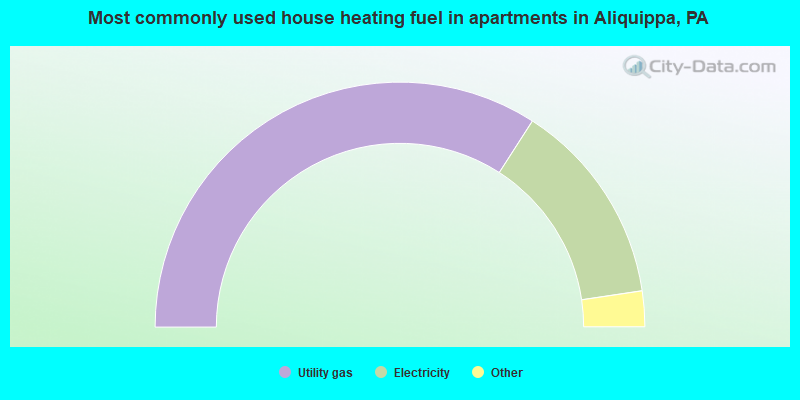
- 68.2%Utility gas
- 27.1%Electricity
- 2.1%Bottled, tank, or LP gas
- 1.4%No fuel used
- 1.1%Fuel oil, kerosene, etc.
Aliquippa compared to Pennsylvania state average:
- Median household income below state average.
- Median house value significantly below state average.
- Black race population percentage above state average.
- Hispanic race population percentage significantly below state average.
- Foreign-born population percentage below state average.
- Length of stay since moving in significantly above state average.
- House age above state average.
- Number of college students below state average.
Aliquippa on our top lists:
- #39 on the list of "Top 101 cities with the largest percentage population decrease from 2000 (population 5,000+)"
- #52 on the list of "Top 100 cities with declining populations from 2000 to 2014 (pop. 5,000+)"
- #91 on the list of "Top 101 cities with the most residents born in Italy (population 500+)"
- #81 (15001) on the list of "Top 101 zip codes with the largest percentage of Slovak first ancestries (pop 5,000+)"
- #9 on the list of "Top 101 counties with the highest Sulfur Oxides Annual air pollution readings in 2012 (µg/m3)"
- #14 on the list of "Top 101 counties with the lowest percentage of residents relocating to foreign countries in 2011"
- #18 on the list of "Top 101 counties with the lowest Particulate Matter (PM10) Annual air pollution readings in 2012 (µg/m3)"
- #36 on the list of "Top 101 counties with the lowest percentage of residents relocating to other counties in 2011"
- #37 on the list of "Top 101 counties with the largest increase in the number of births per 1000 residents 2000-2006 to 2007-2013 (pop 50,000+)"

|
|
Total of 105 patent applications in 2008-2024.