Estimated zip code population in 2022: 4,450 Zip code population in 2010: 3,806 Zip code population in 2000: 4,096
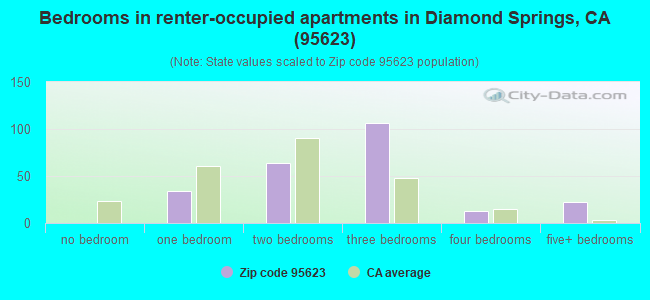
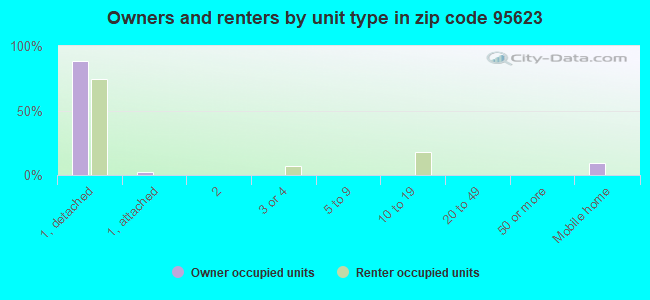
Houses and condos: 1,763 Renter-occupied apartments: 240
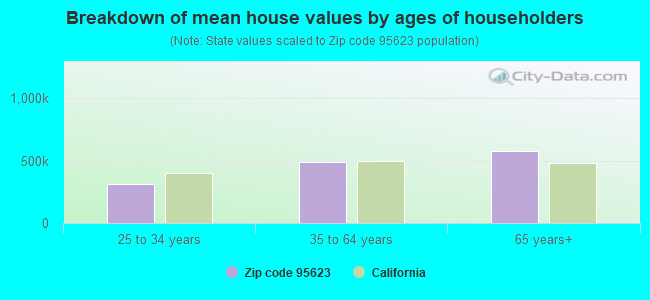
% of renters here:
14%
State:
44%
March 2022 cost of living index in zip code 95623: 97.6 (near average, U.S. average is 100)
Land area: 52.3 sq. mi. Water area: 0.0 sq. mi.
Population density: 85 people per square mile
(very low).
OSM Map
General Map
Google Map
MSN Map
OSM Map
General Map
Google Map
MSN Map
OSM Map
General Map
Google Map
MSN Map
OSM Map
General Map
Google Map
MSN Map
Please wait while loading the map...
Real estate property taxes paid for housing units in 2022:
This zip code:
0.6% ($3,151)
California:
0.7% ($4,831)
Median real estate property taxes paid for housing units with mortgages in 2022: $3,060 (0.6%) Median real estate property taxes paid for housing units with no mortgage in 2022: $3,749 (0.7%)
Business Search- 14 Million verified businesses
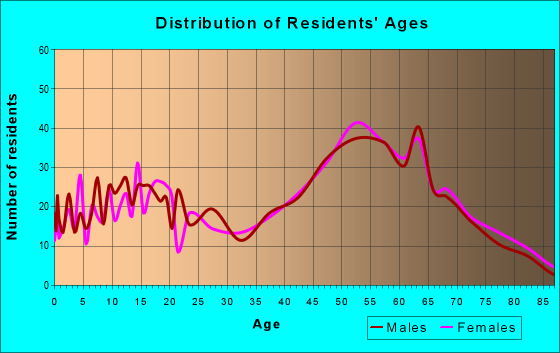
Males: 2,334
(52.5%)
Females: 2,116
(47.5%)
For population 25 years and over in 95623:
High school or higher: 96.4%
Bachelor's degree or higher: 24.0%
Graduate or professional degree: 7.6%
Unemployed: 6.4%
Mean travel time to work (commute): 34.3 minutes
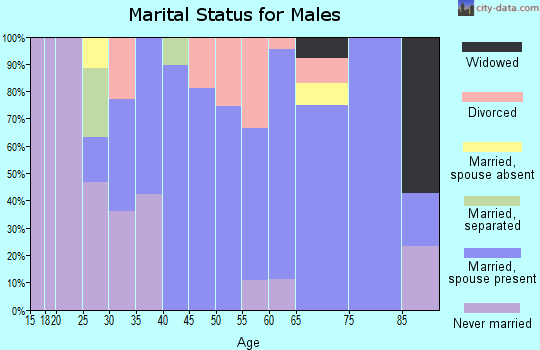
For population 15 years and over in 95623:
Never married: 31.0%
Now married: 52.5%
Separated: 0.9%
Widowed: 5.7%
Divorced: 10.0%
Zip code 95623 compared to state average:
Black race population percentage significantly below state average.
Hispanic race population percentage significantly below state average.
Median age significantly above state average.
Foreign-born population percentage significantly below state average.
Renting percentage significantly below state average.
Averages for the 2020 tax year for zip code 95623, filed in 2021:
Average Adjusted Gross Income (AGI) in 2020: $77,593 (Individual Income Tax Returns)
Here:
$77,593
State:
$95,910
Salary/wage: $66,824 (reported on 71.9% of returns)
Here:
$66,824
State:
$77,331
(% of AGI for various income ranges: 1158.4% for AGIs below $25k, 3816.6% for AGIs $25k-50k, 6289.5% for AGIs $50k-75k, 9647.3% for AGIs $75k-100k, 15909.6% for AGIs $100k-200k, 68755.0% for AGIs over 200k)
Taxable interest for individuals: $1,077 (reported on 48.9% of returns)
This zip code:
$1,077
California:
$2,294
(% of AGI for various income ranges: 27.0% for AGIs below $25k, 32.9% for AGIs $25k-50k, 87.4% for AGIs $50k-75k, 113.3% for AGIs $75k-100k, 158.8% for AGIs $100k-200k, 687.5% for AGIs over 200k)
Ordinary dividends: $4,887 (reported on 22.1% of returns)
Here:
$4,887
State:
$10,949
(% of AGI for various income ranges: 46.5% for AGIs below $25k, 52.6% for AGIs $25k-50k, 168.9% for AGIs $50k-75k, 222.0% for AGIs $75k-100k, 410.0% for AGIs $100k-200k, 1162.5% for AGIs over 200k)
Net capital gain/loss in AGI: +$14,059 (reported on 23.0% of returns)
Here:
+$14,059
State:
+$49,306
(% of AGI for various income ranges: 20.0% for AGIs below $25k, 43.7% for AGIs $25k-50k, 178.4% for AGIs $50k-75k, 243.3% for AGIs $75k-100k, 815.0% for AGIs $100k-200k, 11355.0% for AGIs over 200k)
Profit/loss from business: +$14,833 (reported on 18.3% of returns)
Here:
+$14,833
State:
+$15,671
(% of AGI for various income ranges: 94.3% for AGIs below $25k, 293.7% for AGIs $25k-50k, 636.3% for AGIs $50k-75k, 511.3% for AGIs $75k-100k, 475.8% for AGIs $100k-200k, 4470.0% for AGIs over 200k)
Taxable individual retirement arrangement distribution: $16,904 (reported on 11.9% of returns)
95623:
$16,904
California:
$23,505
(% of AGI for various income ranges: 68.1% for AGIs below $25k, 156.6% for AGIs $25k-50k, 381.6% for AGIs $50k-75k, 384.7% for AGIs $75k-100k, 634.2% for AGIs $100k-200k, 2455.0% for AGIs over 200k)
Total itemized deductions: $30,547 (reported on 16.2% of returns)
Here:
$30,547
State:
$39,517
(% of AGI for various income ranges: 196.8% for AGIs below $25k, 199.4% for AGIs $25k-50k, 749.5% for AGIs $50k-75k, 1014.0% for AGIs $75k-100k, 1828.5% for AGIs $100k-200k, 6207.5% for AGIs over 200k)
Charity contributions: $5,223 (reported on 13.2% of returns)
Here:
$5,223
State:
$12,598
(% of AGI for various income ranges: 26.0% for AGIs $25k-50k, 82.6% for AGIs $50k-75k, 138.7% for AGIs $75k-100k, 347.7% for AGIs $100k-200k, 647.5% for AGIs over 200k)
Taxes paid: $7,955 (reported on 16.2% of returns)
95623:
$7,955
State:
$8,807
(% of AGI for various income ranges: 28.1% for AGIs below $25k, 36.6% for AGIs $25k-50k, 162.6% for AGIs $50k-75k, 292.0% for AGIs $75k-100k, 549.6% for AGIs $100k-200k, 1537.5% for AGIs over 200k)
Earned income credit: $1,818 (reported on 9.4% of returns)
Here:
$1,818
State:
$2,074
(% of AGI for various income ranges: 65.4% for AGIs below $25k, 45.1% for AGIs $25k-50k)
Percentage of individuals using paid preparers for their 2020 taxes: 93.2%
Here:
93%
State:
92%
(% for various income ranges: 91.8% for AGIs below $25k, 94.3% for AGIs $25k-50k, 93.8% for AGIs $50k-75k, 92.6% for AGIs $75k-100k, 93.8% for AGIs $100k-200k, 92.9% for AGIs over 200k)
Averages for the 2012 tax year for zip code 95623, filed in 2013:
Average Adjusted Gross Income (AGI) in 2012: $60,168 (Individual Income Tax Returns)
Here:
$60,168
State:
$72,726
Salary/wage: $52,605 (reported on 76.5% of returns)
Here:
$52,605
State:
$59,079
(% of AGI for various income ranges: 62.7% for AGIs below $25k, 71.3% for AGIs $25k-50k, 63.9% for AGIs $50k-75k, 67.7% for AGIs $75k-100k, 69.7% for AGIs $100k-200k, 60.2% for AGIs over 200k)
Taxable interest for individuals: $964 (reported on 46.1% of returns)
This zip code:
$964
California:
$2,146
(% of AGI for various income ranges: 1.6% for AGIs below $25k, 0.9% for AGIs $25k-50k, 0.9% for AGIs $50k-75k, 0.7% for AGIs $75k-100k, 0.5% for AGIs $100k-200k, 0.5% for AGIs over 200k)
Ordinary dividends: $3,912 (reported on 23.0% of returns)
Here:
$3,912
State:
$9,308
(% of AGI for various income ranges: 2.2% for AGIs below $25k, 1.1% for AGIs $25k-50k, 1.4% for AGIs $50k-75k, 1.4% for AGIs $75k-100k, 1.0% for AGIs $100k-200k, 3.0% for AGIs over 200k)
Net capital gain/loss in AGI: +$2,731 (reported on 19.4% of returns)
Here:
+$2,731
State:
+$30,460
(% of AGI for various income ranges: 0.9% for AGIs $75k-100k, 1.6% for AGIs $100k-200k, 1.5% for AGIs over 200k)
Profit/loss from business: +$11,010 (reported on 18.0% of returns)
Here:
+$11,010
State:
+$17,064
(% of AGI for various income ranges: 10.6% for AGIs below $25k, 4.0% for AGIs $25k-50k, 3.2% for AGIs $50k-75k, 1.4% for AGIs $75k-100k, 3.9% for AGIs $100k-200k)
Taxable individual retirement arrangement distribution: $16,293 (reported on 12.4% of returns)
95623:
$16,293
California:
$19,557
(% of AGI for various income ranges: 2.8% for AGIs below $25k, 2.8% for AGIs $25k-50k, 3.6% for AGIs $50k-75k, 3.5% for AGIs $75k-100k, 5.0% for AGIs $100k-200k)
Total itemized deductions: $24,465 (26% of AGI, reported on 44.2% of returns)
Here:
$24,465
State:
$34,004
Here:
25.7% of AGI
State:
22.7% of AGI
(% of AGI for various income ranges: 15.6% for AGIs below $25k, 14.9% for AGIs $25k-50k, 18.4% for AGIs $50k-75k, 21.1% for AGIs $75k-100k, 19.0% for AGIs $100k-200k, 15.6% for AGIs over 200k)
Charity contributions: $2,622 (reported on 36.9% of returns)
Here:
$2,622
State:
$4,659
(% of AGI for various income ranges: 0.8% for AGIs below $25k, 1.2% for AGIs $25k-50k, 2.0% for AGIs $50k-75k, 2.0% for AGIs $75k-100k, 1.7% for AGIs $100k-200k, 1.2% for AGIs over 200k)
Taxes paid: $8,094 (reported on 44.2% of returns)
95623:
$8,094
State:
$14,448
(% of AGI for various income ranges: 3.0% for AGIs below $25k, 3.3% for AGIs $25k-50k, 4.6% for AGIs $50k-75k, 6.0% for AGIs $75k-100k, 7.3% for AGIs $100k-200k, 8.6% for AGIs over 200k)
Earned income credit: $1,928 (reported on 13.4% of returns)
Here:
$1,928
State:
$2,286
(% of AGI for various income ranges: 4.5% for AGIs below $25k, 0.9% for AGIs $25k-50k)
Percentage of individuals using paid preparers for their 2012 taxes: 55.8%
Here:
56%
State:
64%
(% for various income ranges: 47.1% for AGIs below $25k, 56.0% for AGIs $25k-50k, 58.8% for AGIs $50k-75k, 57.7% for AGIs $75k-100k, 65.6% for AGIs $100k-200k, 80.0% for AGIs over 200k)
Averages for the 2004 tax year for zip code 95623, filed in 2005:
Average Adjusted Gross Income (AGI) in 2004: $52,128 (Individual Income Tax Returns)
Here:
$52,128
State:
$58,600
Salary/wage: $46,641 (reported on 78.1% of returns)
Here:
$46,641
State:
$49,455
(% of AGI for various income ranges: 132.9% for AGIs below $10k, 64.1% for AGIs $10k-25k, 71.7% for AGIs $25k-50k, 70.3% for AGIs $50k-75k, 78.2% for AGIs $75k-100k, 64.6% for AGIs over 100k)
Taxable interest for individuals: $1,527 (reported on 57.5% of returns)
This zip code:
$1,527
California:
$2,365
(% of AGI for various income ranges: 12.6% for AGIs below $10k, 2.8% for AGIs $10k-25k, 1.9% for AGIs $25k-50k, 1.4% for AGIs $50k-75k, 1.7% for AGIs $75k-100k, 1.3% for AGIs over 100k)
Taxable dividends: $2,179 (reported on 26.1% of returns)
Here:
$2,179
State:
$4,746
(% of AGI for various income ranges: 5.2% for AGIs below $10k, 1.6% for AGIs $10k-25k, 1.4% for AGIs $25k-50k, 1.3% for AGIs $50k-75k, 0.5% for AGIs $75k-100k, 0.9% for AGIs over 100k)
Net capital gain/loss: +$5,702 (reported on 22.1% of returns)
Here:
+$5,702
State:
+$23,418
(% of AGI for various income ranges: -7.7% for AGIs below $10k, 0.7% for AGIs $10k-25k, 0.1% for AGIs $25k-50k, 0.9% for AGIs $50k-75k, 1.5% for AGIs $75k-100k, 5.0% for AGIs over 100k)
Profit/loss from business: +$13,017 (reported on 21.6% of returns)
Here:
+$13,017
State:
+$16,826
(% of AGI for various income ranges: 8.0% for AGIs below $10k, 10.4% for AGIs $10k-25k, 6.6% for AGIs $25k-50k, 5.6% for AGIs $50k-75k, 4.6% for AGIs $75k-100k, 4.3% for AGIs over 100k)
IRA payment deduction: $2,868 (reported on 3.2% of returns)
95623:
$2,868
California:
$3,192
(% of AGI for various income ranges: 0.4% for AGIs $25k-50k, 0.1% for AGIs $50k-75k, 0.2% for AGIs $75k-100k, 0.1% for AGIs over 100k)
Self-employed pension: $13,000 (reported on 1.1% of returns)
Here:
$13,000
California:
$17,688
Total itemized deductions: $21,580 (26% of AGI, reported on 49.9% of returns)
Here:
$21,580
State:
$28,113
Here:
26.4% of AGI
State:
25.3% of AGI
(% of AGI for various income ranges: 31.4% for AGIs below $10k, 19.8% for AGIs $10k-25k, 20.5% for AGIs $25k-50k, 23.2% for AGIs $50k-75k, 22.1% for AGIs $75k-100k, 18.7% for AGIs over 100k)
Charity contributions deductions: $2,271 (3% of AGI, reported on 44.4% of returns)
Here:
$2,271
State:
$3,923
Here:
2.7% of AGI
State:
3.3% of AGI
(% of AGI for various income ranges: 1.5% for AGIs below $10k, 1.6% for AGIs $10k-25k, 1.8% for AGIs $25k-50k, 2.6% for AGIs $50k-75k, 2.1% for AGIs $75k-100k, 1.7% for AGIs over 100k)
Total tax: $7,354 (reported on 81.0% of returns)
95623:
$7,354
State:
$10,761
(% of AGI for various income ranges: 6.6% for AGIs below $10k, 5.0% for AGIs $10k-25k, 7.1% for AGIs $25k-50k, 9.0% for AGIs $50k-75k, 9.7% for AGIs $75k-100k, 16.4% for AGIs over 100k)
Earned income credit: $1,512 (reported on 11.8% of returns)
Here:
$1,512
State:
$1,763
Percentage of individuals using paid preparers for their 2004 taxes: 63.1%
Here:
63%
State:
66%
(% for various income ranges: 54.4% for AGIs below $10k, 56.8% for AGIs $10k-25k, 64.6% for AGIs $25k-50k, 67.4% for AGIs $50k-75k, 72.3% for AGIs $75k-100k, 69.1% for AGIs over 100k)
Household received Food Stamps/SNAP in the past 12 months: 132 Household did not receive Food Stamps/SNAP in the past 12 months: 1,521
Women who had a birth in the past 12 months: 26 (26 now married, 0 unmarried) Women who did not have a birth in the past 12 months: 776 (403 now married, 369 unmarried)
Housing units in zip code 95623 with a mortgage: 972 (40 second mortgage, 34 both second mortgage and home equity loan) Houses without a mortgage: 49
Median monthly owner costs for units with a mortgage: $2,270 Median monthly owner costs for units without a mortgage: $763
Residents with income below the poverty level in 2022:
This zip code:
20.9%
Whole state:
12.2%
Residents with income below 50% of the poverty level in 2022:
This zip code:
15.3%
Whole state:
6.2%
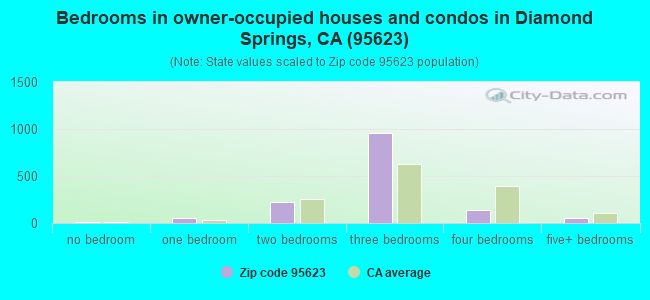
Median number of rooms in houses and condos:
Here:
5.7
State:
6.0
Median number of rooms in apartments:
Here:
5.1
State:
3.9
Notable locations in this zip code not listed on our city pages
Notable locations in zip code 95623: Miller Ranch (A), Logtown (B), Diamond Springs - El Dorado Fire Protection District Station 44 (C), Diamond Springs - El Dorado Fire Protection District Station 46 (D). Display/hide their locations on the map
Rivers and creeks: East Big Canyon Creek (A), Fanny Creek (B), Gilmore Creek (C), Martinez Creek (D), North Fork Cosumnes River (E), Stafford Creek (F), Middle Fork Cosumnes River (G), Big Indian Creek (H). Display/hide their locations on the map
In group quarters: 1 (-1 institutionalized population)
Size of family households: 599 2-persons, 275 3-persons, 143 4-persons, 151 5-persons, 19 6-persons, 6 7-or-more-persons
Size of nonfamily households: 376 1-person, 71 2-persons, 31 3-persons
635 married couples with children.
0 single-parent households ().
91.3% of residents of 95623 zip code speak English at home.
4.0% of residents speak Spanish at home (79% very well, 21% well).
0.8% of residents speak other Indo-European language at home (100% very well).
3.4% of residents speak Asian or Pacific Island language at home (22% very well, 70% well, 7% not well).
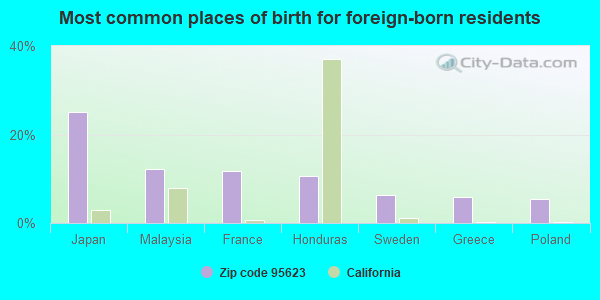
Foreign born population: 272 (6.1%) (46.6% of them are naturalized citizens)
This zip code:
6.1%
Whole state:
26.7%
25%Japan
12%Malaysia
12%France
11%Honduras
6%Sweden
6%Greece
6%Poland
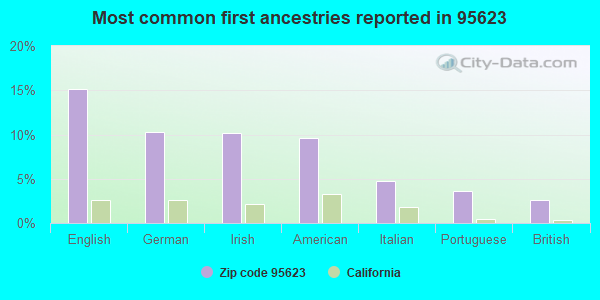
15%English
10%German
10%Irish
10%American
5%Italian
4%Portuguese
3%British
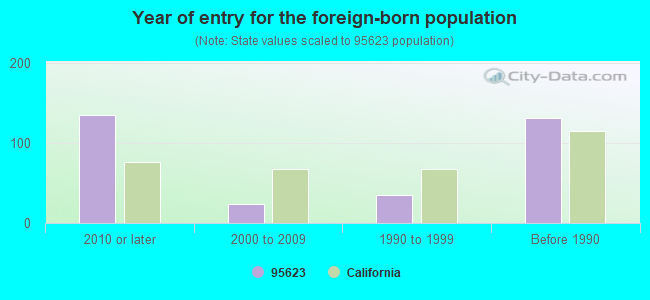
Year of entry for the foreign-born population
1352010 or later
242000 to 2009
351990 to 1999
131Before 1990
Facilities with environmental interests located in this zip code:
EL DORADO NATL FOREST (R14-T14N R10E-T13N R19E-T9N in EL DORADO, CA)
SUPERFUND (Superfund database)
CEMEX EL DORADO (5481 DAVIDSON RD in EL DORADO, CA)
TRI REPORTER (Tracking of toxic chemicals releasing facilities) Business SIC classification: READY-MIXED CONCRETE Alternative names: CEMEX CONSTRUCTION MATERIALS INC
Housing units lacking complete plumbing facilities: 0.7% Housing units lacking complete kitchen facilities: 0.7%
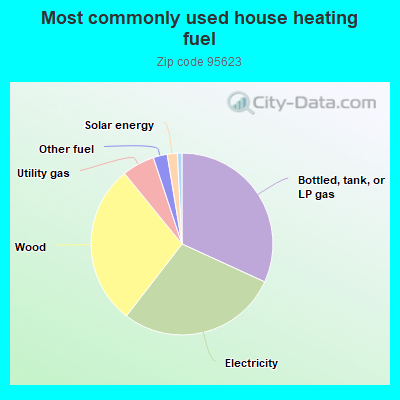
31.9%Bottled, tank, or LP gas
28.7%Electricity
28.7%Wood
5.8%Utility gas
2.5%Other fuel
1.8%Solar energy
0.8%Fuel oil, kerosene, etc.
Place of birth for U.S.-born residents:
This state: 3,396
Northeast: 75
Midwest: 234
South: 224
West: 193
60% of the 95623 zip code residents lived in the same house 5 years ago. Out of people who lived in different houses, 41% lived in this county. Out of people who lived in different counties, 50% lived in California.
91% of the 95623 zip code residents lived in the same house 1 year ago. Out of people who lived in different houses, 42% moved from this county. Out of people who lived in different houses, 50% moved from different county within same state. Out of people who lived in different houses, 10% moved from different state.
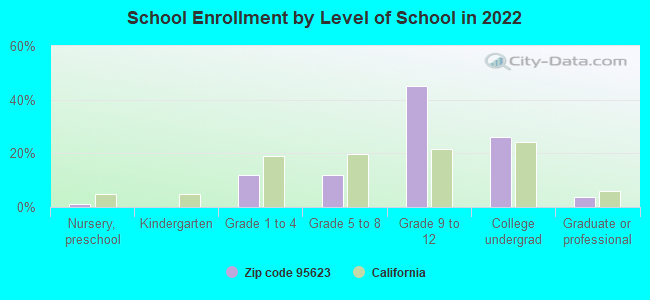
Private vs. public school enrollment:
Students in private schools in grades 1 to 8 (elementary and middle school): 51
Here:
23.5%
California:
10.5%
Students in private schools in grades 9 to 12 (high school): 24
Here:
5.9%
California:
8.5%
Students in private undergraduate colleges: 68
Here:
28.5%
California:
15.9%
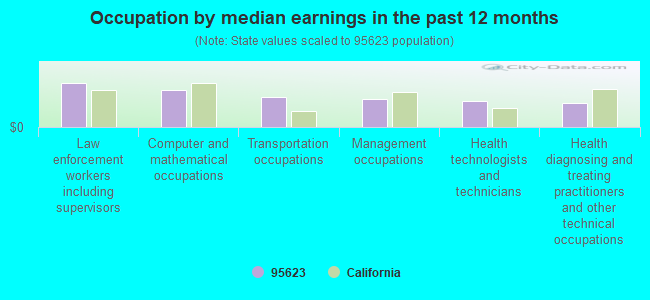
Occupation by median earnings in the past 12 months ($)
121,065Law enforcement workers including supervisors
103,909Computer and mathematical occupations
84,088Transportation occupations
76,361Management occupations
72,193Health technologists and technicians
65,757Health diagnosing and treating practitioners and other technical occupations
Top industries in this zip code by the number of employees in 2005:
Utilities: Electric Power Distribution (50-99 employees: 1 establishment)
Construction: Poured Concrete Foundation and Structure Contractors (20-49: 1)
Health Care and Social Assistance: Homes for the Elderly (20-49: 1)
Construction: New Multifamily Housing Construction (except Operative Builders) (20-49: 1)
Construction: Plumbing, Heating, and Air-Conditioning Contractors (10-19: 1, 1-4: 2)
Accommodation and Food Services: Full-Service Restaurants (10-19: 1, 1-4: 1)
People in group quarters in 2010:
40 people in other noninstitutional facilities
People in group quarters in 2000:
12 people in unknown juvenile institutions
Fatal accident statistics in 2013:
Fatal accident count: 1
Vehicles involved in fatal accidents: 1
Fatal accidents caused by drunken drivers: 0
Fatalities: 1
Persons involved in fatal accidents: 1
Pedestrians involved in fatal accidents: 0
Fatal accident statistics in 2011:
Fatal accident count: 1
Vehicles involved in fatal accidents: 1
Fatal accidents caused by drunken drivers: 1
Fatalities: 1
Persons involved in fatal accidents: 2
Pedestrians involved in fatal accidents: 0
Home Mortgage Disclosure Act Aggregated Statistics For Year 2009 (Based on 2 partial tracts)
A) FHA, FSA/RHS & VA Home Purchase Loans
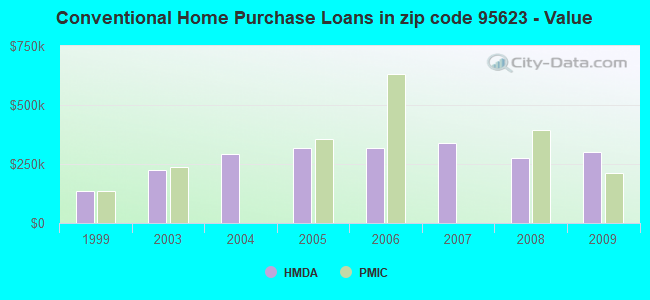
B) Conventional Home Purchase Loans
C) Refinancings
D) Home Improvement Loans
F) Non-occupant Loans on < 5 Family Dwellings (A B C & D)
G) Loans On Manufactured Home Dwelling (A B C & D)
Number
Average Value
Number
Average Value
Number
Average Value
Number
Average Value
Number
Average Value
Number
Average Value
LOANS ORIGINATED
9
$283,774
23
$301,545
134
$245,184
8
$206,479
11
$206,868
3
$165,910
APPLICATIONS APPROVED, NOT ACCEPTED
3
$276,860
0
$0
22
$307,828
2
$15,555
2
$130,655
0
$0
APPLICATIONS DENIED
0
$0
5
$271,572
44
$351,344
5
$217,444
6
$212,053
3
$260,270
APPLICATIONS WITHDRAWN
2
$272,195
0
$0
36
$345,558
0
$0
2
$244,200
0
$0
FILES CLOSED FOR INCOMPLETENESS
0
$0
0
$0
11
$364,388
0
$0
0
$0
0
$0
Aggregated Statistics For Year 2008 (Based on 2 partial tracts)
A) FHA, FSA/RHS & VA Home Purchase Loans
B) Conventional Home Purchase Loans
C) Refinancings
D) Home Improvement Loans
F) Non-occupant Loans on < 5 Family Dwellings (A B C & D)
G) Loans On Manufactured Home Dwelling (A B C & D)
Number
Average Value
Number
Average Value
Number
Average Value
Number
Average Value
Number
Average Value
Number
Average Value
LOANS ORIGINATED
6
$328,448
20
$275,150
76
$273,648
16
$83,602
8
$144,264
3
$214,647
APPLICATIONS APPROVED, NOT ACCEPTED
0
$0
3
$100,063
17
$259,752
2
$38,885
2
$116,655
0
$0
APPLICATIONS DENIED
0
$0
5
$311,392
59
$362,645
14
$162,873
0
$0
3
$280,490
APPLICATIONS WITHDRAWN
0
$0
5
$320,412
17
$294,062
2
$284,640
3
$233,310
2
$150,095
FILES CLOSED FOR INCOMPLETENESS
0
$0
0
$0
5
$279,660
0
$0
0
$0
0
$0
Aggregated Statistics For Year 2007 (Based on 2 partial tracts)
B) Conventional Home Purchase Loans
C) Refinancings
D) Home Improvement Loans
F) Non-occupant Loans on < 5 Family Dwellings (A B C & D)
G) Loans On Manufactured Home Dwelling (A B C & D)
Number
Average Value
Number
Average Value
Number
Average Value
Number
Average Value
Number
Average Value
LOANS ORIGINATED
48
$340,762
123
$292,630
14
$197,980
6
$305,377
8
$266,945
APPLICATIONS APPROVED, NOT ACCEPTED
6
$290,600
40
$375,279
5
$91,768
2
$272,195
3
$288,267
APPLICATIONS DENIED
6
$373,297
86
$419,850
20
$100,324
6
$226,828
2
$241,085
APPLICATIONS WITHDRAWN
2
$223,980
33
$308,346
3
$634,603
0
$0
0
$0
FILES CLOSED FOR INCOMPLETENESS
0
$0
14
$487,840
0
$0
0
$0
0
$0
Aggregated Statistics For Year 2006 (Based on 2 partial tracts)
A) FHA, FSA/RHS & VA Home Purchase Loans
B) Conventional Home Purchase Loans
C) Refinancings
D) Home Improvement Loans
F) Non-occupant Loans on < 5 Family Dwellings (A B C & D)
G) Loans On Manufactured Home Dwelling (A B C & D)
Number
Average Value
Number
Average Value
Number
Average Value
Number
Average Value
Number
Average Value
Number
Average Value
LOANS ORIGINATED
3
$302,267
64
$319,708
173
$304,975
30
$153,155
9
$258,369
8
$235,449
APPLICATIONS APPROVED, NOT ACCEPTED
0
$0
5
$520,748
22
$287,608
2
$160,205
2
$377,960
2
$290,080
APPLICATIONS DENIED
0
$0
20
$262,474
68
$368,287
11
$125,846
9
$430,154
6
$325,338
APPLICATIONS WITHDRAWN
0
$0
17
$304,492
50
$288,464
5
$237,976
5
$305,170
2
$240,310
FILES CLOSED FOR INCOMPLETENESS
0
$0
2
$242,640
11
$286,335
2
$77,770
0
$0
0
$0
Aggregated Statistics For Year 2005 (Based on 2 partial tracts)
B) Conventional Home Purchase Loans
C) Refinancings
D) Home Improvement Loans
F) Non-occupant Loans on < 5 Family Dwellings (A B C & D)
G) Loans On Manufactured Home Dwelling (A B C & D)
Number
Average Value
Number
Average Value
Number
Average Value
Number
Average Value
Number
Average Value
LOANS ORIGINATED
79
$318,759
202
$296,696
31
$147,763
25
$283,394
11
$235,996
APPLICATIONS APPROVED, NOT ACCEPTED
16
$329,842
16
$291,638
3
$324,560
5
$273,128
0
$0
APPLICATIONS DENIED
34
$318,903
59
$286,694
30
$101,982
2
$59,885
6
$152,948
APPLICATIONS WITHDRAWN
19
$273,996
70
$283,149
8
$69,021
0
$0
3
$261,827
FILES CLOSED FOR INCOMPLETENESS
5
$228,644
14
$266,751
2
$238,755
3
$186,130
0
$0
Aggregated Statistics For Year 2004 (Based on 2 partial tracts)
A) FHA, FSA/RHS & VA Home Purchase Loans
B) Conventional Home Purchase Loans
C) Refinancings
D) Home Improvement Loans
F) Non-occupant Loans on < 5 Family Dwellings (A B C & D)
G) Loans On Manufactured Home Dwelling (A B C & D)
Number
Average Value
Number
Average Value
Number
Average Value
Number
Average Value
Number
Average Value
Number
Average Value
LOANS ORIGINATED
2
$181,980
103
$292,294
193
$254,924
33
$120,332
22
$199,233
11
$215,494
APPLICATIONS APPROVED, NOT ACCEPTED
0
$0
14
$244,531
25
$217,320
3
$267,530
3
$301,747
5
$139,986
APPLICATIONS DENIED
0
$0
19
$381,237
76
$294,012
28
$130,542
5
$266,596
5
$122,876
APPLICATIONS WITHDRAWN
0
$0
12
$428,902
67
$244,407
12
$152,559
0
$0
0
$0
FILES CLOSED FOR INCOMPLETENESS
0
$0
5
$317,302
25
$223,169
2
$38,885
0
$0
2
$349,965
Aggregated Statistics For Year 2003 (Based on 2 partial tracts)
B) Conventional Home Purchase Loans
C) Refinancings
D) Home Improvement Loans
F) Non-occupant Loans on < 5 Family Dwellings (A B C & D)
Number
Average Value
Number
Average Value
Number
Average Value
Number
Average Value
LOANS ORIGINATED
75
$225,699
513
$192,548
16
$54,050
26
$162,778
APPLICATIONS APPROVED, NOT ACCEPTED
5
$262,552
50
$199,122
6
$27,478
11
$205,737
APPLICATIONS DENIED
22
$230,058
79
$221,418
11
$66,316
8
$195,398
APPLICATIONS WITHDRAWN
3
$260,270
75
$206,910
6
$56,513
5
$112,922
FILES CLOSED FOR INCOMPLETENESS
0
$0
16
$208,132
2
$23,330
2
$186,650
Aggregated Statistics For Year 1999 (Based on 1 partial tract)
A) FHA, FSA/RHS & VA Home Purchase Loans
B) Conventional Home Purchase Loans
C) Refinancings
D) Home Improvement Loans
E) Loans on Dwellings For 5+ Families
F) Non-occupant Loans on < 5 Family Dwellings (A B C & D)
Detailed PMIC statistics for the following Tracts:0315.03
2005 - 2018 National Fire Incident Reporting System (NFIRS) incidents
Based on the data from the years 2005 - 2018 the average number of fires per year is 15. The highest number of reported fire incidents - 23 took place in 2018, and the least - 6 in 2010. The data has a rising trend.
When looking into fire subcategories, the most incidents belonged to: Outside Fires (73.7%), and Structure Fires (17.7%).
Fire incident types reported to NFIRS in Zip Code 95623
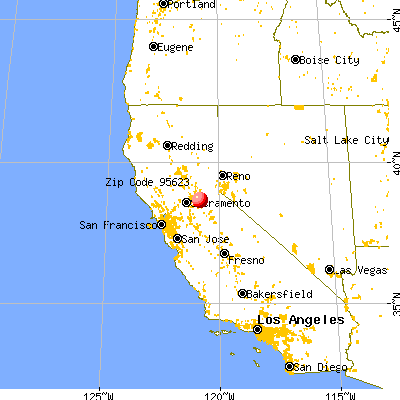


 Nearest zip codes: 95619, 95682, 95669, 95675, 95667, 95699.


 Based on the data from the years 2005 - 2018 the average number of fires per year is 15. The highest number of reported fire incidents - 23 took place in 2018, and the least - 6 in 2010. The data has a rising trend.
 When looking into fire subcategories, the most incidents belonged to: Outside Fires (73.7%), and Structure Fires (17.7%).