Estimated zip code population in 2022: 20,061 Zip code population in 2010: 19,383 Zip code population in 2000: 18,869
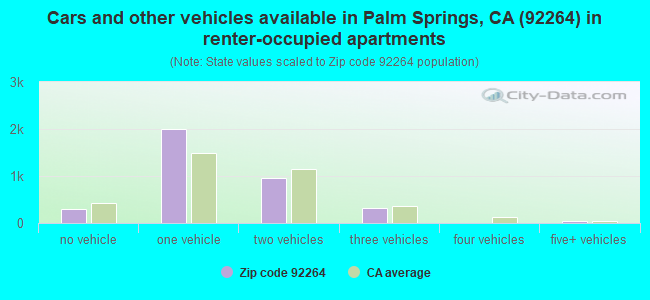
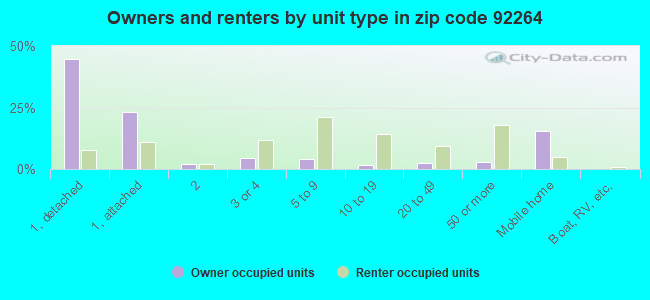
Houses and condos: 17,694 Renter-occupied apartments: 3,582
% of renters here:
31%
State:
44%
March 2022 cost of living index in zip code 92264: 82.6 (low, U.S. average is 100)
Land area: 52.3 sq. mi. Water area: 0.2 sq. mi.
Population density: 384 people per square mile
(very low).
OSM Map
General Map
Google Map
MSN Map
OSM Map
General Map
Google Map
MSN Map
OSM Map
General Map
Google Map
MSN Map
OSM Map
General Map
Google Map
MSN Map
Please wait while loading the map...
Real estate property taxes paid for housing units in 2022:
This zip code:
0.8% ($4,044)
California:
0.7% ($4,831)
Median real estate property taxes paid for housing units with mortgages in 2022: $4,701 (0.7%) Median real estate property taxes paid for housing units with no mortgage in 2022: $3,518 (0.9%)
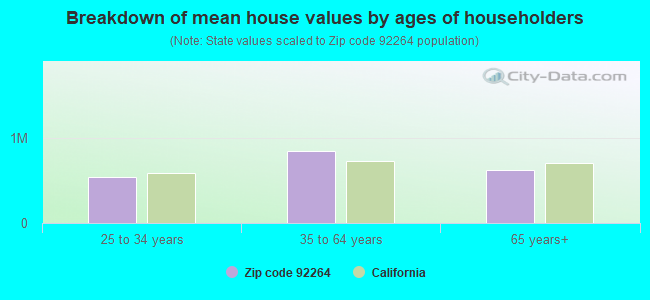
Estimated median house/condo value in 2022: $495,256
92264:
$495,256
California:
$715,900
According to our research of California and other state lists, there were 20 registered sex offenders living in 92264 zip code as of June 09, 2024. The ratio of all residents to sex offenders in zip code 92264 is 1,003 to 1. The ratio of registered sex offenders to all residents in this zip code is lower than the state average.
Median resident age:
This zip code:
60.8 years
California median age:
37.9 years
Average household size:
This zip code:
1.7 people
California:
2.8 people
Averages for the 2020 tax year for zip code 92264, filed in 2021:
Average Adjusted Gross Income (AGI) in 2020: $94,954 (Individual Income Tax Returns)
Here:
$94,954
State:
$95,910
Salary/wage: $74,198 (reported on 59.2% of returns)
Here:
$74,198
State:
$77,331
(% of AGI for various income ranges: 934.6% for AGIs below $25k, 3386.4% for AGIs $25k-50k, 6012.7% for AGIs $50k-75k, 8038.2% for AGIs $75k-100k, 14878.7% for AGIs $100k-200k, 115896.3% for AGIs over 200k)
Taxable interest for individuals: $2,615 (reported on 45.7% of returns)
This zip code:
$2,615
California:
$2,294
(% of AGI for various income ranges: 65.5% for AGIs below $25k, 67.3% for AGIs $25k-50k, 191.3% for AGIs $50k-75k, 251.3% for AGIs $75k-100k, 481.7% for AGIs $100k-200k, 2563.7% for AGIs over 200k)
Ordinary dividends: $12,921 (reported on 31.9% of returns)
Here:
$12,921
State:
$10,949
(% of AGI for various income ranges: 126.5% for AGIs below $25k, 186.9% for AGIs $25k-50k, 399.3% for AGIs $50k-75k, 735.5% for AGIs $75k-100k, 1524.3% for AGIs $100k-200k, 11648.9% for AGIs over 200k)
Net capital gain/loss in AGI: +$37,143 (reported on 31.6% of returns)
Here:
+$37,143
State:
+$49,306
(% of AGI for various income ranges: 40.4% for AGIs below $25k, 127.6% for AGIs $25k-50k, 375.7% for AGIs $50k-75k, 685.8% for AGIs $75k-100k, 2292.8% for AGIs $100k-200k, 50915.3% for AGIs over 200k)
Profit/loss from business: +$18,483 (reported on 21.7% of returns)
Here:
+$18,483
State:
+$15,671
(% of AGI for various income ranges: 223.5% for AGIs below $25k, 405.4% for AGIs $25k-50k, 448.4% for AGIs $50k-75k, 839.8% for AGIs $75k-100k, 1685.0% for AGIs $100k-200k, 7755.3% for AGIs over 200k)
Taxable individual retirement arrangement distribution: $26,517 (reported on 17.1% of returns)
92264:
$26,517
California:
$23,505
(% of AGI for various income ranges: 151.7% for AGIs below $25k, 274.6% for AGIs $25k-50k, 821.2% for AGIs $50k-75k, 1280.2% for AGIs $75k-100k, 2518.5% for AGIs $100k-200k, 7219.5% for AGIs over 200k)
Self-employed (Keogh) retirement plans: $20,975 (reported on 1.6% of returns)
92264:
$20,975
California:
$30,163
(% of AGI for various income ranges: 13.8% for AGIs below $25k, 58.2% for AGIs $50k-75k, 139.3% for AGIs $100k-200k, 1000.0% for AGIs over 200k)
Total itemized deductions: $39,313 (reported on 20.7% of returns)
Here:
$39,313
State:
$39,517
(% of AGI for various income ranges: 252.9% for AGIs below $25k, 403.1% for AGIs $25k-50k, 990.9% for AGIs $50k-75k, 1644.5% for AGIs $75k-100k, 3381.0% for AGIs $100k-200k, 20381.1% for AGIs over 200k)
Charity contributions: $8,724 (reported on 16.9% of returns)
Here:
$8,724
State:
$12,598
(% of AGI for various income ranges: 12.2% for AGIs below $25k, 32.3% for AGIs $25k-50k, 110.0% for AGIs $50k-75k, 200.0% for AGIs $75k-100k, 499.3% for AGIs $100k-200k, 5088.4% for AGIs over 200k)
Taxes paid: $8,293 (reported on 20.5% of returns)
92264:
$8,293
State:
$8,807
(% of AGI for various income ranges: 48.7% for AGIs below $25k, 84.0% for AGIs $25k-50k, 237.3% for AGIs $50k-75k, 461.2% for AGIs $75k-100k, 983.7% for AGIs $100k-200k, 3065.3% for AGIs over 200k)
Earned income credit: $1,388 (reported on 9.1% of returns)
Here:
$1,388
State:
$2,074
(% of AGI for various income ranges: 47.4% for AGIs below $25k, 36.7% for AGIs $25k-50k)
Percentage of individuals using paid preparers for their 2020 taxes: 92.1%
Here:
92%
State:
92%
(% for various income ranges: 89.7% for AGIs below $25k, 92.3% for AGIs $25k-50k, 93.3% for AGIs $50k-75k, 90.7% for AGIs $75k-100k, 94.6% for AGIs $100k-200k, 95.8% for AGIs over 200k)
Averages for the 2012 tax year for zip code 92264, filed in 2013:
Average Adjusted Gross Income (AGI) in 2012: $61,261 (Individual Income Tax Returns)
Here:
$61,261
State:
$72,726
Salary/wage: $45,771 (reported on 61.4% of returns)
Here:
$45,771
State:
$59,079
(% of AGI for various income ranges: 57.0% for AGIs below $25k, 61.3% for AGIs $25k-50k, 48.7% for AGIs $50k-75k, 49.6% for AGIs $75k-100k, 46.4% for AGIs $100k-200k, 33.4% for AGIs over 200k)
Taxable interest for individuals: $2,950 (reported on 44.1% of returns)
This zip code:
$2,950
California:
$2,146
(% of AGI for various income ranges: 3.1% for AGIs below $25k, 1.6% for AGIs $25k-50k, 2.1% for AGIs $50k-75k, 2.4% for AGIs $75k-100k, 1.5% for AGIs $100k-200k, 2.4% for AGIs over 200k)
Ordinary dividends: $9,057 (reported on 29.1% of returns)
Here:
$9,057
State:
$9,308
(% of AGI for various income ranges: 5.5% for AGIs below $25k, 3.0% for AGIs $25k-50k, 3.8% for AGIs $50k-75k, 4.2% for AGIs $75k-100k, 3.4% for AGIs $100k-200k, 5.4% for AGIs over 200k)
Net capital gain/loss in AGI: +$15,430 (reported on 28.2% of returns)
Here:
+$15,430
State:
+$30,460
(% of AGI for various income ranges: 0.7% for AGIs $25k-50k, 1.4% for AGIs $50k-75k, 1.8% for AGIs $75k-100k, 4.1% for AGIs $100k-200k, 18.1% for AGIs over 200k)
Profit/loss from business: +$15,979 (reported on 20.0% of returns)
Here:
+$15,979
State:
+$17,064
(% of AGI for various income ranges: 13.4% for AGIs below $25k, 5.9% for AGIs $25k-50k, 5.1% for AGIs $50k-75k, 4.8% for AGIs $75k-100k, 4.3% for AGIs $100k-200k, 3.6% for AGIs over 200k)
Taxable individual retirement arrangement distribution: $21,183 (reported on 18.4% of returns)
92264:
$21,183
California:
$19,557
(% of AGI for various income ranges: 6.5% for AGIs below $25k, 5.2% for AGIs $25k-50k, 7.0% for AGIs $50k-75k, 8.1% for AGIs $75k-100k, 8.8% for AGIs $100k-200k, 4.4% for AGIs over 200k)
Self-employment retirement plans: $20,950 (reported on 0.9% of returns)
92264:
$20,950
California:
$24,530
(% of AGI for various income ranges: 0.3% for AGIs below $25k, 0.5% for AGIs $50k-75k, 0.3% for AGIs $100k-200k, 0.4% for AGIs over 200k)
Total itemized deductions: $30,994 (29% of AGI, reported on 41.5% of returns)
Here:
$30,994
State:
$34,004
Here:
28.8% of AGI
State:
22.7% of AGI
(% of AGI for various income ranges: 23.5% for AGIs below $25k, 16.2% for AGIs $25k-50k, 19.3% for AGIs $50k-75k, 19.6% for AGIs $75k-100k, 28.0% for AGIs $100k-200k, 18.8% for AGIs over 200k)
Charity contributions: $3,283 (reported on 34.2% of returns)
Here:
$3,283
State:
$4,659
(% of AGI for various income ranges: 1.2% for AGIs below $25k, 1.4% for AGIs $25k-50k, 1.9% for AGIs $50k-75k, 2.2% for AGIs $75k-100k, 2.3% for AGIs $100k-200k, 1.7% for AGIs over 200k)
Taxes paid: $10,131 (reported on 41.3% of returns)
92264:
$10,131
State:
$14,448
(% of AGI for various income ranges: 4.9% for AGIs below $25k, 3.8% for AGIs $25k-50k, 5.6% for AGIs $50k-75k, 6.7% for AGIs $75k-100k, 8.3% for AGIs $100k-200k, 8.2% for AGIs over 200k)
Earned income credit: $1,676 (reported on 13.5% of returns)
Here:
$1,676
State:
$2,286
(% of AGI for various income ranges: 3.5% for AGIs below $25k, 0.5% for AGIs $25k-50k)
Percentage of individuals using paid preparers for their 2012 taxes: 66.5%
Here:
67%
State:
64%
(% for various income ranges: 61.5% for AGIs below $25k, 64.4% for AGIs $25k-50k, 70.0% for AGIs $50k-75k, 70.6% for AGIs $75k-100k, 77.0% for AGIs $100k-200k, 86.8% for AGIs over 200k)
Averages for the 2004 tax year for zip code 92264, filed in 2005:
Average Adjusted Gross Income (AGI) in 2004: $51,216 (Individual Income Tax Returns)
Here:
$51,216
State:
$58,600
Salary/wage: $37,575 (reported on 62.3% of returns)
Here:
$37,575
State:
$49,455
(% of AGI for various income ranges: 59.6% for AGIs $10k-25k, 63.3% for AGIs $25k-50k, 52.2% for AGIs $50k-75k, 49.6% for AGIs $75k-100k, 31.9% for AGIs over 100k)
Taxable interest for individuals: $4,206 (reported on 54.6% of returns)
This zip code:
$4,206
California:
$2,365
(% of AGI for various income ranges: 5.8% for AGIs $10k-25k, 4.0% for AGIs $25k-50k, 3.8% for AGIs $50k-75k, 4.2% for AGIs $75k-100k, 4.0% for AGIs over 100k)
Taxable dividends: $6,367 (reported on 33.9% of returns)
Here:
$6,367
State:
$4,746
(% of AGI for various income ranges: 4.5% for AGIs $10k-25k, 3.5% for AGIs $25k-50k, 3.9% for AGIs $50k-75k, 3.1% for AGIs $75k-100k, 4.1% for AGIs over 100k)
Net capital gain/loss: +$21,382 (reported on 33.8% of returns)
Here:
+$21,382
State:
+$23,418
(% of AGI for various income ranges: 0.6% for AGIs $10k-25k, 1.6% for AGIs $25k-50k, 3.6% for AGIs $50k-75k, 5.2% for AGIs $75k-100k, 24.9% for AGIs over 100k)
Profit/loss from business: +$18,627 (reported on 19.8% of returns)
Here:
+$18,627
State:
+$16,826
(% of AGI for various income ranges: 8.8% for AGIs $10k-25k, 6.1% for AGIs $25k-50k, 5.8% for AGIs $50k-75k, 8.1% for AGIs $75k-100k, 7.2% for AGIs over 100k)
IRA payment deduction: $3,123 (reported on 3.0% of returns)
92264:
$3,123
California:
$3,192
(% of AGI for various income ranges: 0.4% for AGIs $10k-25k, 0.3% for AGIs $25k-50k, 0.2% for AGIs $50k-75k, 0.2% for AGIs $75k-100k, 0.1% for AGIs over 100k)
Self-employed pension: $21,689 (reported on 1.7% of returns)
Here:
$21,689
California:
$17,688
(% of AGI for various income ranges: 0.1% for AGIs $10k-25k, 0.3% for AGIs $25k-50k, 0.4% for AGIs $50k-75k, 0.5% for AGIs $75k-100k, 1.0% for AGIs over 100k)
Total itemized deductions: $25,611 (28% of AGI, reported on 42.4% of returns)
Here:
$25,611
State:
$28,113
Here:
27.6% of AGI
State:
25.3% of AGI
(% of AGI for various income ranges: 24.2% for AGIs $10k-25k, 19.7% for AGIs $25k-50k, 22.3% for AGIs $50k-75k, 24.6% for AGIs $75k-100k, 18.3% for AGIs over 100k)
Charity contributions deductions: $3,313 (3% of AGI, reported on 37.1% of returns)
Here:
$3,313
State:
$3,923
Here:
3.4% of AGI
State:
3.3% of AGI
(% of AGI for various income ranges: 1.9% for AGIs $10k-25k, 2.0% for AGIs $25k-50k, 2.5% for AGIs $50k-75k, 2.6% for AGIs $75k-100k, 2.4% for AGIs over 100k)
Total tax: $9,467 (reported on 76.3% of returns)
92264:
$9,467
State:
$10,761
(% of AGI for various income ranges: 4.8% for AGIs $10k-25k, 8.0% for AGIs $25k-50k, 10.9% for AGIs $50k-75k, 12.3% for AGIs $75k-100k, 18.5% for AGIs over 100k)
Earned income credit: $1,317 (reported on 11.2% of returns)
Here:
$1,317
State:
$1,763
Percentage of individuals using paid preparers for their 2004 taxes: 70.6%
Here:
71%
State:
66%
(% for various income ranges: 66.5% for AGIs below $10k, 67.8% for AGIs $10k-25k, 68.6% for AGIs $25k-50k, 70.7% for AGIs $50k-75k, 78.6% for AGIs $75k-100k, 85.7% for AGIs over 100k)
Likely homosexual households (counted as self-reported same-sex unmarried-partner households)
Lesbian couples: 0.5% of all households
Gay men: 5.1% of all households
Household received Food Stamps/SNAP in the past 12 months: 865 Household did not receive Food Stamps/SNAP in the past 12 months: 10,440
Women who had a birth in the past 12 months: 89 (81 now married, 8 unmarried) Women who did not have a birth in the past 12 months: 2,196 (901 now married, 1,293 unmarried)
Housing units in zip code 92264 with a mortgage: 3,594 (264 second mortgage, 19 home equity loan, 215 both second mortgage and home equity loan) Houses without a mortgage: 88
Median monthly owner costs for units with a mortgage: $2,411 Median monthly owner costs for units without a mortgage: $994
Residents with income below the poverty level in 2022:
This zip code:
10.9%
Whole state:
12.2%
Residents with income below 50% of the poverty level in 2022:
This zip code:
4.1%
Whole state:
6.2%
Median number of rooms in houses and condos:
Here:
5.3
State:
6.0
Median number of rooms in apartments:
Here:
3.6
State:
3.9
Notable locations in this zip code not listed on our city pages
Notable locations in zip code 92264: Palm Springs Municipal Golf Course (A), Seven Lakes Country Club (B), Mesquite Country Club (C), Fairchilds Golf Course (D), Canyon Estates Golf Course (E), Canyon Country Club South Golf Course (F), Canyon Country Club North Golf Course (G), Cathedral Canyon Country Club (H), Palm Springs Fire Department Station 445 (I), Palm Springs Fire Department Station 444 (J). Display/hide their locations on the map
Shopping Centers: Rimrock Shopping Center (1), Smoke Tree Village Shopping Center (2), Cameron Center Shopping Center (3). Display/hide their locations on the map
In group quarters: 133 (-1 institutionalized population)
Size of family households: 3,659 2-persons, 699 3-persons, 190 4-persons, 161 5-persons, 9 6-persons, 44 7-or-more-persons
Size of nonfamily households: 5,341 1-person, 1,397 2-persons, 110 3-persons
589 married couples with children.
341 single-parent households (79 men, 262 women).
81.9% of residents of 92264 zip code speak English at home.
12.8% of residents speak Spanish at home (66% very well, 20% well, 8% not well, 5% not at all).
2.3% of residents speak other Indo-European language at home (88% very well, 11% well, 1% not well).
3.6% of residents speak Asian or Pacific Island language at home (60% very well, 30% well, 9% not well, 2% not at all).
0.2% of residents speak other language at home (85% very well, 12% well, 3% not well).
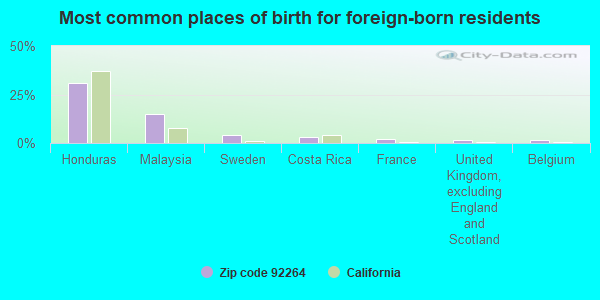
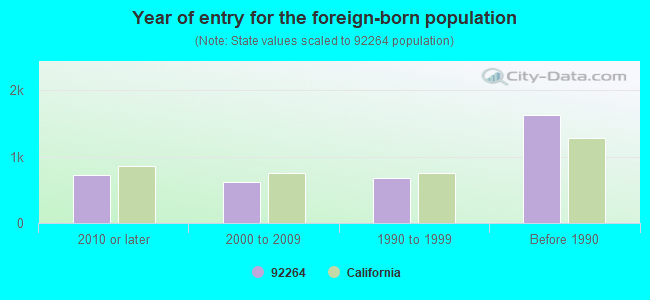
Foreign born population: 3,328 (16.6%) (55.3% of them are naturalized citizens)
Facilities with environmental interests located in this zip code:
ACE PRINTING CO (948 VELLA RD in PALM SPRINGS, CA)
STATE MASTER (California - Hazardous Waste Tracking) - HAZARDOU WASTE PROGRAM Small Quantity Generators, between 100 kg and 1000 kg of hazardous waste/month (Resource Conservation and Recovery Act (tracking hazardous waste)) - notification Organizations: GREG LAWRENCE (CONTACT/OWNER)
B M W OF PALM SPRINGS (3919 E PALM CANYON DR in PALM SPRINGS, CA) . Tribal Land
STATE MASTER (California - Hazardous Waste Tracking) - HAZARDOU WASTE PROGRAM Small Quantity Generators, between 100 kg and 1000 kg of hazardous waste/month (Resource Conservation and Recovery Act (tracking hazardous waste)) - notification Organizations: V I P MOTOR CARS LTD (CONTACT/OWNER)
Alternative names: BMW OF PALM SPRINGS
CIELO VISTA ELEMENTARY (650 PASEO DOROTEA in PALM SPRINGS, CA)
(National Center for Education Statistics) - STATE ID-6032411 Organizations: PALM SPRINGS UNIFIED (SCHOOL DISTRICT)
CAHUILLA ELEMENTARY (833 MESQUITE ROAD in PALM SPRINGS, CA)
(National Center for Education Statistics) - STATE ID-6032395 Organizations: PALM SPRINGS UNIFIED (SCHOOL DISTRICT)
LAIDLAW TRANSPORTATION INC (5006 CALLE SAN RAPHAEL in PALM SPRINGS, CA) . Tribal Land
Small Quantity Generators, between 100 kg and 1000 kg of hazardous waste/month (Resource Conservation and Recovery Act (tracking hazardous waste)) - notification Organizations: LAIDLAW INC (CONTACT/OWNER)
Housing units lacking complete plumbing facilities: 0.7% Housing units lacking complete kitchen facilities: 1.2%
61.3%Utility gas
33.4%Electricity
2.4%Bottled, tank, or LP gas
1.4%Solar energy
0.9%No fuel used
Population in 1990: 18,733. Population change in the 1990s: +136 (+0.7%).
Place of birth for U.S.-born residents:
This state: 7,856
Northeast: 2,228
Midwest: 2,948
South: 1,703
West: 1,408
50% of the 92264 zip code residents lived in the same house 5 years ago. Out of people who lived in different houses, 48% lived in this county. Out of people who lived in different counties, 50% lived in California.
84% of the 92264 zip code residents lived in the same house 1 year ago. Out of people who lived in different houses, 41% moved from this county. Out of people who lived in different houses, 31% moved from different county within same state. Out of people who lived in different houses, 22% moved from different state. Out of people who lived in different houses, 5% moved from abroad.
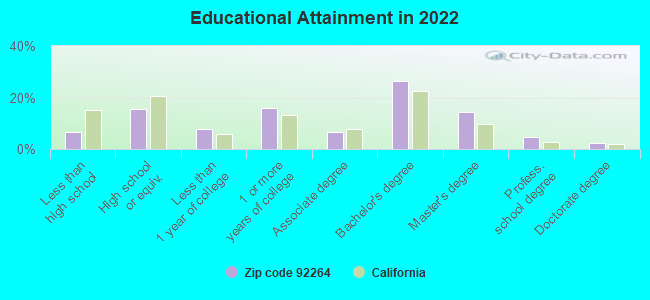
Private vs. public school enrollment:
Students in private schools in grades 1 to 8 (elementary and middle school): 35
Here:
8.4%
California:
10.5%
Students in private schools in grades 9 to 12 (high school): 11
Here:
2.9%
California:
8.5%
Students in private undergraduate colleges: 50
Here:
8.1%
California:
15.9%
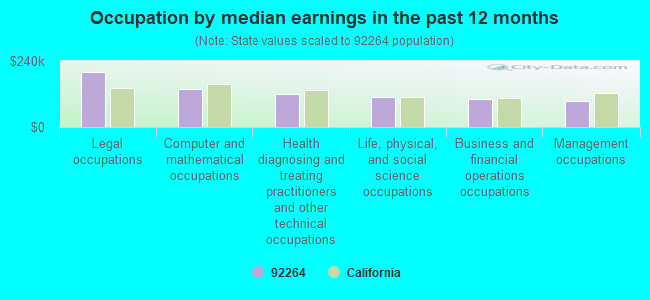
Occupation by median earnings in the past 12 months ($)
198,188Legal occupations
139,726Computer and mathematical occupations
120,547Health diagnosing and treating practitioners and other technical occupations
110,857Life, physical, and social science occupations
102,767Business and financial operations occupations
95,615Management occupations
Companies with federal contracts located in this zip code:
DESERT SUPPORT SERVICES (2336 S CALIENTE ROAD in PALM SPRINGS, CA; small business) : $1,267,098 in 21 contractsfrom 1999 to 2006
Contracts for Word Processing/Typing Services, Warehousing and Storage Services, Guard Services by Navy, Army, U.S. Army Corps of Engineers - civil program financing only, Air Force, and others Signed by year:2000: $134,112; 2001: $354,192; 2002: $138,254; 2003: $109,287; 2004: $20,592; 2005: $254,450; 2006: $142,838.
Biggest contracts:
$224,160 with Navy for Word Processing/Typing Services. Signed on 2001-09-13. Completion date: 2002-09-30.
$142,838 with Army for Warehousing and Storage Services. Taking place in MS. Signed on 2006-01-11. Completion date: 2007-01-12.
$107,688, same as above.Signed on 2005-01-11. Completion date: 2006-01-12.
$107,688 with U.S. Army Corps of Engineers - civil program financing only for Warehousing and Storage Services. Taking place in MS. Signed on 2005-01-11. Completion date: 2006-01-12.
GAMBALE, FRANK (38194 MARACAIBO CIR W in PALM SPRINGS, CA; small business)
$4,000 with Air Force for Other Management Support Services. Taking place in AK. Signed on 2005-08-09. Completion date: 2005-06-10.
COLE, SCOTT (1811 SANDCLIFF RD in PALM SPRINGS, CA; small business)
$3,000 with Navy for Educational Services. Signed on 2004-04-13. Completion date: 2004-04-01.
Top industries in this zip code by the number of employees in 2005:
Construction: Poured Concrete Foundation and Structure Contractors (100-249: 1, 20-49: 1)
Other Services (except Public Administration): Other Similar Organizations (except Business, Professional, Labor, and Political Organizations) (50-99: 1, 20-49: 2, 10-19: 1, 5-9: 3, 1-4: 5)
Other Services (except Public Administration): Religious Organizations (50-99: 1, 10-19: 2, 1-4: 4)
People in group quarters in 2010:
79 people in nursing facilities/skilled-nursing facilities
14 people in workers' group living quarters and job corps centers
10 people in group homes intended for adults
7 people in other noninstitutional facilities
4 people in in-patient hospice facilities
People in group quarters in 2000:
69 people in other group homes
20 people in other noninstitutional group quarters
13 people in other workers' dormitories
Fatal accident statistics in 2014:
Fatal accident count: 1
Vehicles involved in fatal accidents: 1
Fatal accidents caused by drunken drivers: 0
Fatalities: 1
Persons involved in fatal accidents: 1
Pedestrians involved in fatal accidents: 1
Fatal accident statistics in 2013:
Fatal accident count: 3
Vehicles involved in fatal accidents: 4
Fatal accidents caused by drunken drivers: 3
Fatalities: 3
Persons involved in fatal accidents: 4
Pedestrians involved in fatal accidents: 1
Home Mortgage Disclosure Act Aggregated Statistics For Year 2009 (Based on 19 full and 6 partial tracts)
A) FHA, FSA/RHS & VA Home Purchase Loans
B) Conventional Home Purchase Loans
C) Refinancings
D) Home Improvement Loans
E) Loans on Dwellings For 5+ Families
F) Non-occupant Loans on < 5 Family Dwellings (A B C & D)
G) Loans On Manufactured Home Dwelling (A B C & D)
Number
Average Value
Number
Average Value
Number
Average Value
Number
Average Value
Number
Average Value
Number
Average Value
Number
Average Value
LOANS ORIGINATED
48
$274,731
571
$289,444
1,000
$282,689
37
$161,438
1
$175,000
692
$281,358
10
$41,589
APPLICATIONS APPROVED, NOT ACCEPTED
6
$226,982
126
$342,409
114
$255,402
6
$84,823
0
$0
115
$309,541
8
$57,932
APPLICATIONS DENIED
16
$258,756
258
$346,071
517
$318,421
34
$107,803
3
$1,133,333
368
$289,431
13
$41,334
APPLICATIONS WITHDRAWN
7
$204,030
134
$265,251
317
$293,345
20
$200,528
0
$0
160
$235,481
3
$96,333
FILES CLOSED FOR INCOMPLETENESS
5
$399,148
26
$311,625
58
$274,840
1
$84,130
0
$0
34
$291,504
0
$0
Aggregated Statistics For Year 2008 (Based on 19 full and 6 partial tracts)
A) FHA, FSA/RHS & VA Home Purchase Loans
B) Conventional Home Purchase Loans
C) Refinancings
D) Home Improvement Loans
E) Loans on Dwellings For 5+ Families
F) Non-occupant Loans on < 5 Family Dwellings (A B C & D)
G) Loans On Manufactured Home Dwelling (A B C & D)
Number
Average Value
Number
Average Value
Number
Average Value
Number
Average Value
Number
Average Value
Number
Average Value
Number
Average Value
LOANS ORIGINATED
28
$258,300
669
$329,321
528
$336,237
40
$288,769
6
$1,116,097
517
$307,829
22
$47,803
APPLICATIONS APPROVED, NOT ACCEPTED
1
$134,000
143
$277,138
133
$244,373
4
$27,490
0
$0
129
$223,809
16
$85,282
APPLICATIONS DENIED
6
$306,848
243
$470,914
484
$378,370
54
$193,550
7
$2,491,183
279
$369,074
17
$60,324
APPLICATIONS WITHDRAWN
18
$206,773
120
$315,301
176
$329,620
33
$275,695
0
$0
113
$331,165
4
$25,355
FILES CLOSED FOR INCOMPLETENESS
0
$0
34
$380,318
25
$233,796
2
$225,500
0
$0
14
$230,727
0
$0
Aggregated Statistics For Year 2007 (Based on 19 full and 6 partial tracts)
A) FHA, FSA/RHS & VA Home Purchase Loans
B) Conventional Home Purchase Loans
C) Refinancings
D) Home Improvement Loans
E) Loans on Dwellings For 5+ Families
F) Non-occupant Loans on < 5 Family Dwellings (A B C & D)
G) Loans On Manufactured Home Dwelling (A B C & D)
Number
Average Value
Number
Average Value
Number
Average Value
Number
Average Value
Number
Average Value
Number
Average Value
Number
Average Value
LOANS ORIGINATED
4
$408,158
1,247
$367,227
1,293
$374,373
171
$431,021
13
$866,799
1,153
$389,115
26
$55,233
APPLICATIONS APPROVED, NOT ACCEPTED
2
$249,500
228
$452,883
406
$425,180
31
$243,895
5
$12,251,912
239
$406,547
12
$57,875
APPLICATIONS DENIED
7
$283,881
300
$398,887
857
$439,200
108
$244,384
4
$523,655
394
$433,402
46
$45,985
APPLICATIONS WITHDRAWN
0
$0
157
$555,545
291
$475,198
33
$242,106
4
$787,500
145
$459,507
10
$24,026
FILES CLOSED FOR INCOMPLETENESS
0
$0
57
$450,255
115
$323,691
12
$292,895
0
$0
51
$220,527
0
$0
Aggregated Statistics For Year 2006 (Based on 19 full and 6 partial tracts)
A) FHA, FSA/RHS & VA Home Purchase Loans
B) Conventional Home Purchase Loans
C) Refinancings
D) Home Improvement Loans
E) Loans on Dwellings For 5+ Families
F) Non-occupant Loans on < 5 Family Dwellings (A B C & D)
G) Loans On Manufactured Home Dwelling (A B C & D)
Number
Average Value
Number
Average Value
Number
Average Value
Number
Average Value
Number
Average Value
Number
Average Value
Number
Average Value
LOANS ORIGINATED
10
$282,396
1,658
$387,500
1,620
$395,019
188
$293,920
13
$828,785
1,262
$361,893
19
$82,457
APPLICATIONS APPROVED, NOT ACCEPTED
0
$0
400
$357,050
378
$436,834
63
$338,441
3
$1,537,893
306
$404,350
11
$46,154
APPLICATIONS DENIED
0
$0
541
$445,900
829
$453,956
138
$258,243
1
$660,000
394
$475,755
32
$62,597
APPLICATIONS WITHDRAWN
0
$0
280
$340,454
520
$457,979
49
$560,649
0
$0
241
$465,474
4
$186,925
FILES CLOSED FOR INCOMPLETENESS
0
$0
50
$242,282
158
$354,837
14
$271,863
2
$425,000
49
$265,426
2
$49,035
Aggregated Statistics For Year 2005 (Based on 19 full and 6 partial tracts)
A) FHA, FSA/RHS & VA Home Purchase Loans
B) Conventional Home Purchase Loans
C) Refinancings
D) Home Improvement Loans
E) Loans on Dwellings For 5+ Families
F) Non-occupant Loans on < 5 Family Dwellings (A B C & D)
G) Loans On Manufactured Home Dwelling (A B C & D)
Number
Average Value
Number
Average Value
Number
Average Value
Number
Average Value
Number
Average Value
Number
Average Value
Number
Average Value
LOANS ORIGINATED
4
$997,450
2,407
$362,846
2,138
$345,039
264
$247,752
21
$856,909
1,854
$323,430
19
$68,849
APPLICATIONS APPROVED, NOT ACCEPTED
0
$0
332
$327,990
365
$346,225
46
$320,016
0
$0
226
$290,198
24
$101,045
APPLICATIONS DENIED
0
$0
660
$307,553
767
$320,053
135
$152,080
2
$563,220
429
$326,924
50
$63,596
APPLICATIONS WITHDRAWN
0
$0
389
$388,804
464
$359,276
63
$295,887
0
$0
242
$356,430
18
$78,243
FILES CLOSED FOR INCOMPLETENESS
0
$0
56
$419,609
202
$303,554
12
$184,312
0
$0
24
$252,586
2
$200,000
Aggregated Statistics For Year 2004 (Based on 19 full and 6 partial tracts)
A) FHA, FSA/RHS & VA Home Purchase Loans
B) Conventional Home Purchase Loans
C) Refinancings
D) Home Improvement Loans
E) Loans on Dwellings For 5+ Families
F) Non-occupant Loans on < 5 Family Dwellings (A B C & D)
G) Loans On Manufactured Home Dwelling (A B C & D)
Number
Average Value
Number
Average Value
Number
Average Value
Number
Average Value
Number
Average Value
Number
Average Value
Number
Average Value
LOANS ORIGINATED
3
$189,610
3,035
$285,566
1,962
$280,979
170
$192,303
16
$707,454
2,100
$256,295
34
$80,506
APPLICATIONS APPROVED, NOT ACCEPTED
0
$0
507
$251,445
378
$250,576
16
$94,042
0
$0
241
$264,033
39
$81,486
APPLICATIONS DENIED
0
$0
627
$253,166
799
$285,959
145
$221,508
3
$475,667
411
$230,553
41
$66,494
APPLICATIONS WITHDRAWN
0
$0
442
$314,538
509
$245,693
42
$121,544
2
$647,705
231
$297,585
6
$103,982
FILES CLOSED FOR INCOMPLETENESS
0
$0
54
$217,779
138
$296,104
6
$106,473
0
$0
33
$240,048
6
$70,345
Aggregated Statistics For Year 2003 (Based on 19 full and 6 partial tracts)
A) FHA, FSA/RHS & VA Home Purchase Loans
B) Conventional Home Purchase Loans
C) Refinancings
D) Home Improvement Loans
E) Loans on Dwellings For 5+ Families
F) Non-occupant Loans on < 5 Family Dwellings (A B C & D)
Number
Average Value
Number
Average Value
Number
Average Value
Number
Average Value
Number
Average Value
Number
Average Value
LOANS ORIGINATED
8
$176,044
2,350
$218,760
3,680
$219,003
39
$84,684
24
$639,619
2,247
$187,606
APPLICATIONS APPROVED, NOT ACCEPTED
0
$0
285
$240,863
585
$216,181
23
$46,221
0
$0
228
$205,025
APPLICATIONS DENIED
2
$144,500
472
$180,577
881
$211,506
61
$64,923
7
$488,311
347
$191,698
APPLICATIONS WITHDRAWN
0
$0
271
$246,580
601
$182,037
22
$100,219
6
$730,492
198
$202,374
FILES CLOSED FOR INCOMPLETENESS
0
$0
69
$222,234
226
$228,362
13
$56,499
0
$0
92
$193,212
Aggregated Statistics For Year 1999 (Based on 2 partial tracts)
A) FHA, FSA/RHS & VA Home Purchase Loans
B) Conventional Home Purchase Loans
C) Refinancings
D) Home Improvement Loans
E) Loans on Dwellings For 5+ Families
F) Non-occupant Loans on < 5 Family Dwellings (A B C & D)


 Nearest zip codes: 92270, 92260, 92234, 92561, 92210, 92262.