Estimated zip code population in 2022: 32,025 Zip code population in 2010: 33,065 Zip code population in 2000: 31,284
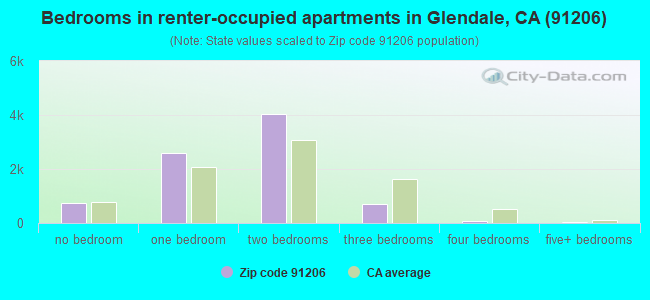
Houses and condos: 13,897 Renter-occupied apartments: 8,186
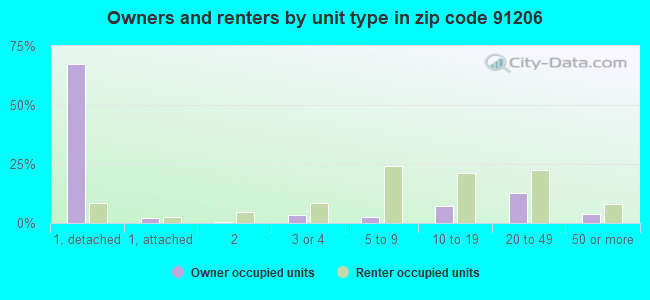
% of renters here:
64%
State:
44%
March 2022 cost of living index in zip code 91206: 142.1 (very high, U.S. average is 100)
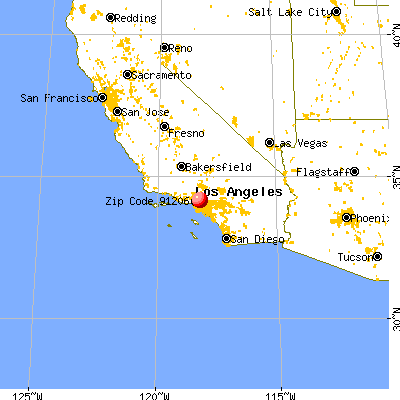
Land area: 5.9 sq. mi. Water area: 0.0 sq. mi.
Population density: 5,444 people per square mile
(average).
OSM Map
General Map
Google Map
MSN Map
OSM Map
General Map
Google Map
MSN Map
OSM Map
General Map
Google Map
MSN Map
OSM Map
General Map
Google Map
MSN Map
Please wait while loading the map...
Real estate property taxes paid for housing units in 2022:
This zip code:
0.6% ($6,454)
California:
0.7% ($4,831)
Median real estate property taxes paid for housing units with mortgages in 2022: $7,178 (0.6%) Median real estate property taxes paid for housing units with no mortgage in 2022: $4,733 (0.5%)
Estimated median house/condo value in 2022: $1,106,806
91206:
$1,106,806
California:
$715,900
According to our research of California and other state lists, there were 7 registered sex offenders living in 91206 zip code as of June 02, 2024. The ratio of all residents to sex offenders in zip code 91206 is 4,963 to 1. The ratio of registered sex offenders to all residents in this zip code is much lower than the state average.
Median resident age:
This zip code:
43.9 years
California median age:
37.9 years
Average household size:
This zip code:
2.5 people
California:
2.8 people
Averages for the 2020 tax year for zip code 91206, filed in 2021:
Average Adjusted Gross Income (AGI) in 2020: $84,461 (Individual Income Tax Returns)
Here:
$84,461
State:
$95,910
Salary/wage: $70,584 (reported on 76.2% of returns)
Here:
$70,584
State:
$77,331
(% of AGI for various income ranges: 1144.3% for AGIs below $25k, 4147.6% for AGIs $25k-50k, 8047.8% for AGIs $50k-75k, 11728.6% for AGIs $75k-100k, 22738.7% for AGIs $100k-200k, 98150.0% for AGIs over 200k)
Taxable interest for individuals: $1,976 (reported on 34.0% of returns)
This zip code:
$1,976
California:
$2,294
(% of AGI for various income ranges: 21.1% for AGIs below $25k, 32.7% for AGIs $25k-50k, 63.0% for AGIs $50k-75k, 91.8% for AGIs $75k-100k, 245.8% for AGIs $100k-200k, 1761.7% for AGIs over 200k)
Ordinary dividends: $8,360 (reported on 20.1% of returns)
Here:
$8,360
State:
$10,949
(% of AGI for various income ranges: 23.6% for AGIs below $25k, 51.7% for AGIs $25k-50k, 86.6% for AGIs $50k-75k, 139.9% for AGIs $75k-100k, 456.3% for AGIs $100k-200k, 6062.4% for AGIs over 200k)
Net capital gain/loss in AGI: +$23,111 (reported on 21.1% of returns)
Here:
+$23,111
State:
+$49,306
(% of AGI for various income ranges: 14.6% for AGIs below $25k, 46.7% for AGIs $25k-50k, 129.3% for AGIs $50k-75k, 163.8% for AGIs $75k-100k, 760.6% for AGIs $100k-200k, 22220.3% for AGIs over 200k)
Profit/loss from business: +$13,177 (reported on 29.1% of returns)
Here:
+$13,177
State:
+$15,671
(% of AGI for various income ranges: 284.6% for AGIs below $25k, 410.1% for AGIs $25k-50k, 584.1% for AGIs $50k-75k, 545.1% for AGIs $75k-100k, 1094.2% for AGIs $100k-200k, 6891.7% for AGIs over 200k)
Taxable individual retirement arrangement distribution: $22,894 (reported on 5.7% of returns)
91206:
$22,894
California:
$23,505
(% of AGI for various income ranges: 29.6% for AGIs below $25k, 69.2% for AGIs $25k-50k, 137.3% for AGIs $50k-75k, 216.7% for AGIs $75k-100k, 741.2% for AGIs $100k-200k, 2349.3% for AGIs over 200k)
Self-employed (Keogh) retirement plans: $26,221 (reported on 0.9% of returns)
91206:
$26,221
California:
$30,163
(% of AGI for various income ranges: 21.5% for AGIs $50k-75k, 57.4% for AGIs $100k-200k, 963.4% for AGIs over 200k)
Total itemized deductions: $42,480 (reported on 17.0% of returns)
Here:
$42,480
State:
$39,517
(% of AGI for various income ranges: 121.7% for AGIs below $25k, 255.4% for AGIs $25k-50k, 603.1% for AGIs $50k-75k, 1200.1% for AGIs $75k-100k, 3060.8% for AGIs $100k-200k, 18923.1% for AGIs over 200k)
Charity contributions: $9,207 (reported on 14.4% of returns)
Here:
$9,207
State:
$12,598
(% of AGI for various income ranges: 4.5% for AGIs below $25k, 26.2% for AGIs $25k-50k, 69.4% for AGIs $50k-75k, 166.8% for AGIs $75k-100k, 528.1% for AGIs $100k-200k, 4239.3% for AGIs over 200k)
Taxes paid: $8,748 (reported on 17.0% of returns)
91206:
$8,748
State:
$8,807
(% of AGI for various income ranges: 25.3% for AGIs below $25k, 54.6% for AGIs $25k-50k, 142.6% for AGIs $50k-75k, 322.4% for AGIs $75k-100k, 854.8% for AGIs $100k-200k, 2723.8% for AGIs over 200k)
Earned income credit: $1,700 (reported on 13.7% of returns)
Here:
$1,700
State:
$2,074
(% of AGI for various income ranges: 77.1% for AGIs below $25k, 66.9% for AGIs $25k-50k, 0.9% for AGIs $50k-75k)
Percentage of individuals using paid preparers for their 2020 taxes: 92.8%
Here:
93%
State:
92%
(% for various income ranges: 91.9% for AGIs below $25k, 93.7% for AGIs $25k-50k, 93.0% for AGIs $50k-75k, 93.4% for AGIs $75k-100k, 92.1% for AGIs $100k-200k, 93.8% for AGIs over 200k)
Averages for the 2012 tax year for zip code 91206, filed in 2013:
Average Adjusted Gross Income (AGI) in 2012: $68,329 (Individual Income Tax Returns)
Here:
$68,329
State:
$72,726
Salary/wage: $58,819 (reported on 80.9% of returns)
Here:
$58,819
State:
$59,079
(% of AGI for various income ranges: 69.5% for AGIs below $25k, 80.8% for AGIs $25k-50k, 80.1% for AGIs $50k-75k, 76.6% for AGIs $75k-100k, 74.8% for AGIs $100k-200k, 54.1% for AGIs over 200k)
Taxable interest for individuals: $1,807 (reported on 35.4% of returns)
This zip code:
$1,807
California:
$2,146
(% of AGI for various income ranges: 1.2% for AGIs below $25k, 0.6% for AGIs $25k-50k, 0.6% for AGIs $50k-75k, 0.7% for AGIs $75k-100k, 0.9% for AGIs $100k-200k, 1.3% for AGIs over 200k)
Ordinary dividends: $5,267 (reported on 17.4% of returns)
Here:
$5,267
State:
$9,308
(% of AGI for various income ranges: 1.5% for AGIs below $25k, 0.7% for AGIs $25k-50k, 1.0% for AGIs $50k-75k, 1.0% for AGIs $75k-100k, 1.3% for AGIs $100k-200k, 1.9% for AGIs over 200k)
Net capital gain/loss in AGI: +$15,809 (reported on 16.7% of returns)
Here:
+$15,809
State:
+$30,460
(% of AGI for various income ranges: 0.2% for AGIs $50k-75k, 0.3% for AGIs $75k-100k, 1.1% for AGIs $100k-200k, 11.5% for AGIs over 200k)
Profit/loss from business: +$14,247 (reported on 25.8% of returns)
Here:
+$14,247
State:
+$17,064
(% of AGI for various income ranges: 19.2% for AGIs below $25k, 7.1% for AGIs $25k-50k, 4.4% for AGIs $50k-75k, 4.0% for AGIs $75k-100k, 4.2% for AGIs $100k-200k, 3.7% for AGIs over 200k)
Taxable individual retirement arrangement distribution: $18,292 (reported on 7.6% of returns)
91206:
$18,292
California:
$19,557
(% of AGI for various income ranges: 1.9% for AGIs below $25k, 1.7% for AGIs $25k-50k, 2.3% for AGIs $50k-75k, 2.0% for AGIs $75k-100k, 2.5% for AGIs $100k-200k, 1.7% for AGIs over 200k)
Self-employment retirement plans: $25,033 (reported on 1.0% of returns)
91206:
$25,033
California:
$24,530
(% of AGI for various income ranges: 0.3% for AGIs $25k-50k, 0.3% for AGIs $100k-200k, 0.8% for AGIs over 200k)
Total itemized deductions: $32,893 (25% of AGI, reported on 37.1% of returns)
Here:
$32,893
State:
$34,004
Here:
25.1% of AGI
State:
22.7% of AGI
(% of AGI for various income ranges: 11.4% for AGIs below $25k, 12.2% for AGIs $25k-50k, 15.4% for AGIs $50k-75k, 18.3% for AGIs $75k-100k, 22.0% for AGIs $100k-200k, 18.7% for AGIs over 200k)
Charity contributions: $4,329 (reported on 30.8% of returns)
Here:
$4,329
State:
$4,659
(% of AGI for various income ranges: 0.7% for AGIs below $25k, 1.1% for AGIs $25k-50k, 1.7% for AGIs $50k-75k, 2.1% for AGIs $75k-100k, 2.3% for AGIs $100k-200k, 2.2% for AGIs over 200k)
Taxes paid: $12,088 (reported on 37.1% of returns)
91206:
$12,088
State:
$14,448
(% of AGI for various income ranges: 2.5% for AGIs below $25k, 2.6% for AGIs $25k-50k, 4.0% for AGIs $50k-75k, 5.8% for AGIs $75k-100k, 8.2% for AGIs $100k-200k, 8.9% for AGIs over 200k)
Earned income credit: $1,894 (reported on 17.7% of returns)
Here:
$1,894
State:
$2,286
(% of AGI for various income ranges: 5.9% for AGIs below $25k, 0.9% for AGIs $25k-50k)
Percentage of individuals using paid preparers for their 2012 taxes: 71.0%
Here:
71%
State:
64%
(% for various income ranges: 70.8% for AGIs below $25k, 70.7% for AGIs $25k-50k, 67.3% for AGIs $50k-75k, 69.7% for AGIs $75k-100k, 73.2% for AGIs $100k-200k, 79.7% for AGIs over 200k)
Averages for the 2004 tax year for zip code 91206, filed in 2005:
Average Adjusted Gross Income (AGI) in 2004: $53,521 (Individual Income Tax Returns)
Here:
$53,521
State:
$58,600
Salary/wage: $46,524 (reported on 81.6% of returns)
Here:
$46,524
State:
$49,455
(% of AGI for various income ranges: 234.1% for AGIs below $10k, 74.4% for AGIs $10k-25k, 82.4% for AGIs $25k-50k, 81.0% for AGIs $50k-75k, 77.4% for AGIs $75k-100k, 59.5% for AGIs over 100k)
Taxable interest for individuals: $2,181 (reported on 44.6% of returns)
This zip code:
$2,181
California:
$2,365
(% of AGI for various income ranges: 11.8% for AGIs below $10k, 1.8% for AGIs $10k-25k, 1.4% for AGIs $25k-50k, 1.4% for AGIs $50k-75k, 1.6% for AGIs $75k-100k, 2.0% for AGIs over 100k)
Taxable dividends: $3,304 (reported on 21.5% of returns)
Here:
$3,304
State:
$4,746
(% of AGI for various income ranges: 7.2% for AGIs below $10k, 1.4% for AGIs $10k-25k, 1.0% for AGIs $25k-50k, 0.9% for AGIs $50k-75k, 1.1% for AGIs $75k-100k, 1.6% for AGIs over 100k)
Net capital gain/loss: +$15,244 (reported on 20.5% of returns)
Here:
+$15,244
State:
+$23,418
(% of AGI for various income ranges: -9.3% for AGIs below $10k, -0.2% for AGIs $10k-25k, -0.0% for AGIs $25k-50k, 0.3% for AGIs $50k-75k, 1.0% for AGIs $75k-100k, 11.8% for AGIs over 100k)
Profit/loss from business: +$13,350 (reported on 25.1% of returns)
Here:
+$13,350
State:
+$16,826
(% of AGI for various income ranges: 37.4% for AGIs below $10k, 13.5% for AGIs $10k-25k, 7.1% for AGIs $25k-50k, 5.2% for AGIs $50k-75k, 4.6% for AGIs $75k-100k, 5.2% for AGIs over 100k)
IRA payment deduction: $3,234 (reported on 3.6% of returns)
91206:
$3,234
California:
$3,192
(% of AGI for various income ranges: 0.9% for AGIs below $10k, 0.2% for AGIs $10k-25k, 0.4% for AGIs $25k-50k, 0.2% for AGIs $50k-75k, 0.3% for AGIs $75k-100k, 0.1% for AGIs over 100k)
Self-employed pension: $18,117 (reported on 1.4% of returns)
Here:
$18,117
California:
$17,688
(% of AGI for various income ranges: 0.1% for AGIs $10k-25k, 0.0% for AGIs $25k-50k, 0.1% for AGIs $50k-75k, 0.3% for AGIs $75k-100k, 0.8% for AGIs over 100k)
Total itemized deductions: $26,495 (26% of AGI, reported on 38.9% of returns)
Here:
$26,495
State:
$28,113
Here:
26.4% of AGI
State:
25.3% of AGI
(% of AGI for various income ranges: 42.2% for AGIs below $10k, 12.5% for AGIs $10k-25k, 16.3% for AGIs $25k-50k, 20.1% for AGIs $50k-75k, 22.2% for AGIs $75k-100k, 20.0% for AGIs over 100k)
Charity contributions deductions: $4,146 (4% of AGI, reported on 34.2% of returns)
Here:
$4,146
State:
$3,923
Here:
3.9% of AGI
State:
3.3% of AGI
(% of AGI for various income ranges: 2.0% for AGIs below $10k, 1.2% for AGIs $10k-25k, 1.9% for AGIs $25k-50k, 2.5% for AGIs $50k-75k, 2.6% for AGIs $75k-100k, 3.2% for AGIs over 100k)
Total tax: $8,811 (reported on 80.4% of returns)
91206:
$8,811
State:
$10,761
(% of AGI for various income ranges: 13.2% for AGIs below $10k, 5.4% for AGIs $10k-25k, 7.7% for AGIs $25k-50k, 10.1% for AGIs $50k-75k, 11.2% for AGIs $75k-100k, 17.8% for AGIs over 100k)
Earned income credit: $1,546 (reported on 15.3% of returns)
Here:
$1,546
State:
$1,763
Percentage of individuals using paid preparers for their 2004 taxes: 70.1%
Here:
70%
State:
66%
(% for various income ranges: 66.3% for AGIs below $10k, 69.5% for AGIs $10k-25k, 68.0% for AGIs $25k-50k, 70.8% for AGIs $50k-75k, 73.8% for AGIs $75k-100k, 78.0% for AGIs over 100k)
Likely homosexual households (counted as self-reported same-sex unmarried-partner households)
Lesbian couples: 0.0% of all households
Gay men: 0.4% of all households
Household received Food Stamps/SNAP in the past 12 months: 2,112 Household did not receive Food Stamps/SNAP in the past 12 months: 10,802
Women who had a birth in the past 12 months: 232 (225 now married, 6 unmarried) Women who did not have a birth in the past 12 months: 7,889 (3,307 now married, 4,574 unmarried)
Housing units in zip code 91206 with a mortgage: 3,275 (387 second mortgage, 9 home equity loan, 348 both second mortgage and home equity loan) Houses without a mortgage: 277
Median monthly owner costs for units with a mortgage: $3,651 Median monthly owner costs for units without a mortgage: $946
Residents with income below the poverty level in 2022:
This zip code:
13.4%
Whole state:
12.2%
Residents with income below 50% of the poverty level in 2022:
This zip code:
6.2%
Whole state:
6.2%
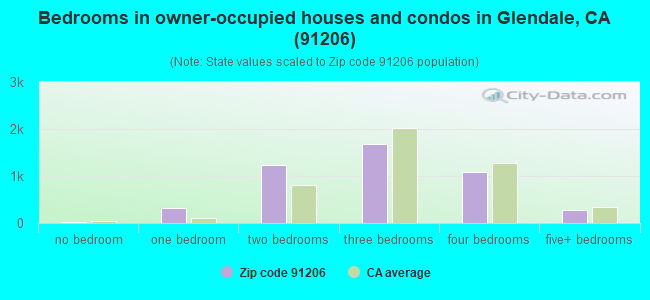
Median number of rooms in houses and condos:
Here:
6.0
State:
6.0
Median number of rooms in apartments:
Here:
4.1
State:
3.9
Notable locations in this zip code not listed on our city pages
Notable locations in zip code 91206: Chevy Chase Golf Course (A), Chevy Chase Country Club (B), Verdugo Metropolitan Pumping Station (C), Chevy Chase Branch Glendale Public Library (D), Glendale City Hall (E), City of Glendale Fire Department Station 23 (F), Alex Theatre (G), Glendale Masonic Temple (H), City of Glendale Fire Department Station 25 (I), Valley National Building (J), City of Glendale Police Facilities Building (K). Display/hide their locations on the map
Churches in zip code 91206 include: Church of Jesus Christ of Latter Day Saints (A), Church of God (B), Broadway Methodist Church (C), First United Methodist Church (D), First Baptist Church (E), Zion Lutheran Church (F), Glendale Seventh Day Adventist Church (G), Vallejo Drive Seventh Day Adventist Church (H), Calvary Bible Presbyterian Church (I). Display/hide their locations on the map
3,732 married couples with children.
1,111 single-parent households (278 men, 833 women).
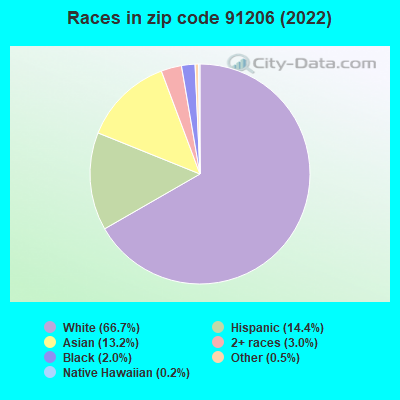
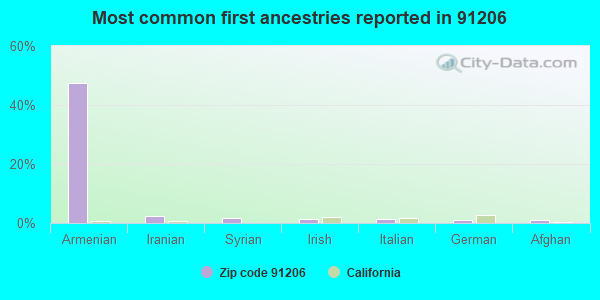
33.3% of residents of 91206 zip code speak English at home.
9.2% of residents speak Spanish at home (72% very well, 19% well, 9% not well, 1% not at all).
47.4% of residents speak other Indo-European language at home (54% very well, 22% well, 17% not well, 7% not at all).
9.4% of residents speak Asian or Pacific Island language at home (53% very well, 41% well, 6% not well).
2.9% of residents speak other language at home (47% very well, 20% well, 24% not well, 9% not at all).
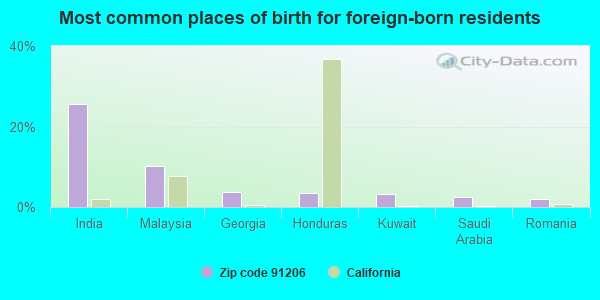
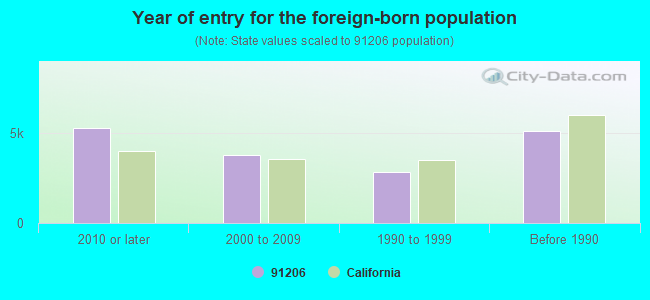
Foreign born population: 16,423 (51.3%) (66.6% of them are naturalized citizens)
Facilities with environmental interests located in this zip code:
GLENDALE ADVENTIST MEDICAL CENTER (1520 E CHEVY CHASE DR in GLENDALE, CA)
STATE MASTER (California - Hazardous Waste Tracking) - HAZARDOU WASTE PROGRAM Small Quantity Generators, between 100 kg and 1000 kg of hazardous waste/month (Resource Conservation and Recovery Act (tracking hazardous waste))
GLENDALE ALTERNATIVE HIGH (223 N. JACKSON ST. in GLENDALE, CA)
(National Center for Education Statistics) - STATE ID-1995497 Organizations: GLENDALE UNIFIED (SCHOOL DISTRICT)
GLENOAKS ELEMENTARY (2015 E. GLENOAKS BLVD. in GLENDALE, CA)
(National Center for Education Statistics) - STATE ID-6013692 Organizations: GLENDALE UNIFIED (SCHOOL DISTRICT)
JEWEL CITY COMMUNITY DAY (1440 E. BROADWAY in GLENDALE, CA)
(National Center for Education Statistics) - STATE ID-1996156 Organizations: GLENDALE UNIFIED (SCHOOL DISTRICT)
EXXONMOBIL OIL CORP. (700 N GLENDAL AVE in GLENDALE, CA)
HAZARDOUS WASTE BIENNIAL REPORTER (Resource Conservation and Recovery Act (tracking hazardous waste)) Large Quantity Generators, more that 1000 kg of hazardous waste/month (Resource Conservation and Recovery Act (tracking hazardous waste)) Organizations: EXXONMOBIL OIL CORPORATION (CONTACT/OWNER)
EXXON MOBIL OIL CORP (1297 N VERDUGO RD in GLENDALE, CA)
HAZARDOUS WASTE BIENNIAL REPORTER (Resource Conservation and Recovery Act (tracking hazardous waste)) Large Quantity Generators, more that 1000 kg of hazardous waste/month (Resource Conservation and Recovery Act (tracking hazardous waste))
GLENDALE AVENUE CLEANERS (321 N GLENDALE AVE in GLENDALE, CA)
Small Quantity Generators, between 100 kg and 1000 kg of hazardous waste/month (Resource Conservation and Recovery Act (tracking hazardous waste)) - notification Organizations: QUE ROBERT (CONTACT/OWNER)
GLENDALE HEALTH CTR (501 N GLENDALE AVE in GLENDALE, CA)
Small Quantity Generators, between 100 kg and 1000 kg of hazardous waste/month (Resource Conservation and Recovery Act (tracking hazardous waste)) - notification Organizations: LOS ANGELES COUNTY (CONTACT/OWNER)
CAMPUS CLEANERS (553-E N GLENDALE BLVD in GLENDALE, CA)
Small Quantity Generators, between 100 kg and 1000 kg of hazardous waste/month (Resource Conservation and Recovery Act (tracking hazardous waste))
GLENDALE ADVENTIST MEDICAL CENTER (1505 WILSON TERRACE in GLENDALE, CA)
CRITERIA AND HAZARDOUS AIR POLLUTANT INVENTORY (Inventory of air pollution sources) Business SIC classification: GENERAL MEDICAL AND SURGICAL HOSPITALS
Housing units lacking complete plumbing facilities: 1.1% Housing units lacking complete kitchen facilities: 3.6%
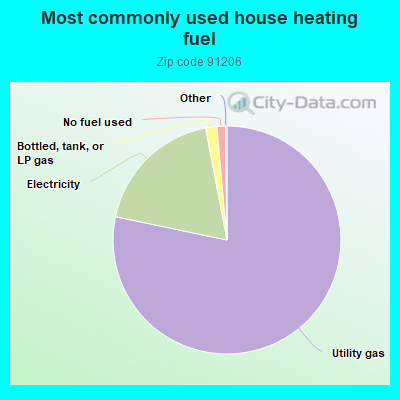
78.2%Utility gas
18.7%Electricity
1.6%Bottled, tank, or LP gas
1.2%No fuel used
Population in 1990: 30,415. Population change in the 1990s: +869 (+2.9%).
Place of birth for U.S.-born residents:
This state: 11,202
Northeast: 1,160
Midwest: 1,217
South: 1,142
West: 556
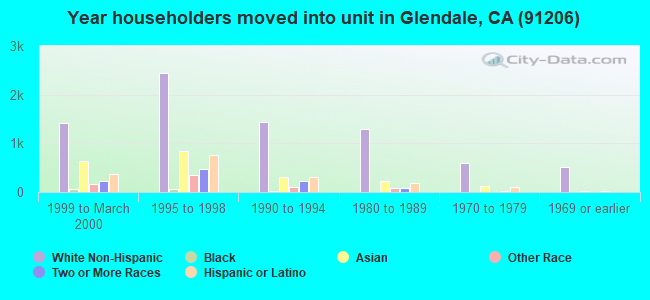
53% of the 91206 zip code residents lived in the same house 5 years ago. Out of people who lived in different houses, 86% lived in this county. Out of people who lived in different counties, 50% lived in California.
91% of the 91206 zip code residents lived in the same house 1 year ago. Out of people who lived in different houses, 69% moved from this county. Out of people who lived in different houses, 10% moved from different county within same state. Out of people who lived in different houses, 8% moved from different state. Out of people who lived in different houses, 12% moved from abroad.
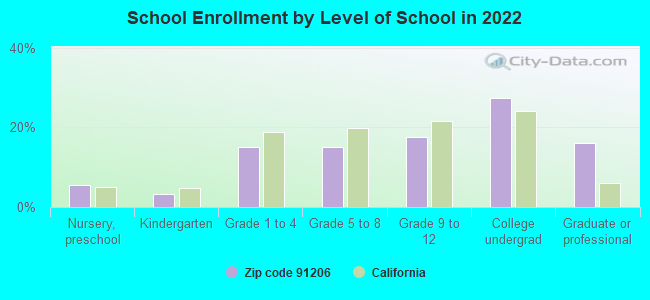
Private vs. public school enrollment:
Students in private schools in grades 1 to 8 (elementary and middle school): 220
Here:
10.9%
California:
10.5%
Students in private schools in grades 9 to 12 (high school): 164
Here:
14.1%
California:
8.5%
Students in private undergraduate colleges: 623
Here:
33.5%
California:
15.9%
Occupation by median earnings in the past 12 months ($)
223,275Law enforcement workers including supervisors
112,098Health diagnosing and treating practitioners and other technical occupations
97,423Architecture and engineering occupations
86,910Life, physical, and social science occupations
85,275Business and financial operations occupations
85,050Legal occupations
Companies with federal contracts located in this zip code:
DOALL INDUSTRIAL SUPPLY CO (514 RIVERDALE DR in GLENDALE, CA) : $25,632 in 2 contractsfrom 2003 to 2006
$14,312 with Army for Miscellaneous Maintenance and Repair Shop Specialized Equipment. Signed on 2003-09-18. Completion date: 2003-12-01.
$11,320 with Navy for Motors, Electrical. Signed on 2006-05-23. Completion date: 2006-08-01.
Top industries in this zip code by the number of employees in 2005:
Health Care and Social Assistance: General Medical and Surgical Hospitals (over 1000 employees: 1 establishment)
Administrative and Support and Waste Management and Remediation Services: Temporary Help Services (250-499: 1, 50-99: 1, 5-9: 2)
Health Care and Social Assistance: Offices of Physicians (except Mental Health Specialists) (50-99: 1, 20-49: 1, 10-19: 8, 5-9: 14, 1-4: 37)
2005 - 2018 National Fire Incident Reporting System (NFIRS) incidents
Based on the data from the years 2005 - 2018 the average number of fires per year is 57. The highest number of reported fire incidents - 132 took place in 2007, and the least - 2 in 2015. The data has a growing trend.
When looking into fire subcategories, the most incidents belonged to: Mobile Property/Vehicle Fires (33.1%), and Outside Fires (26.1%).
Fire incident types reported to NFIRS in Zip Code 91206


 Nearest zip codes: 90041, 91208, 91205, 91210, 90065, 91103.
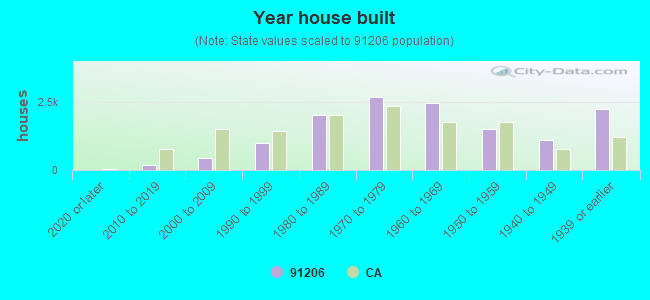


 Based on the data from the years 2005 - 2018 the average number of fires per year is 57. The highest number of reported fire incidents - 132 took place in 2007, and the least - 2 in 2015. The data has a growing trend.
 When looking into fire subcategories, the most incidents belonged to: Mobile Property/Vehicle Fires (33.1%), and Outside Fires (26.1%).