Estimated zip code population in 2022: 2,907 Zip code population in 2010: 3,000 Zip code population in 2000: 3,357
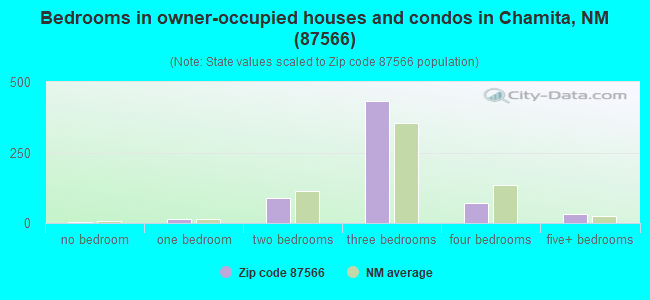
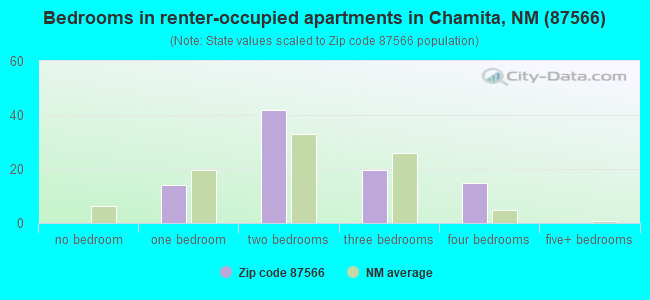
Houses and condos: 924 Renter-occupied apartments: 91
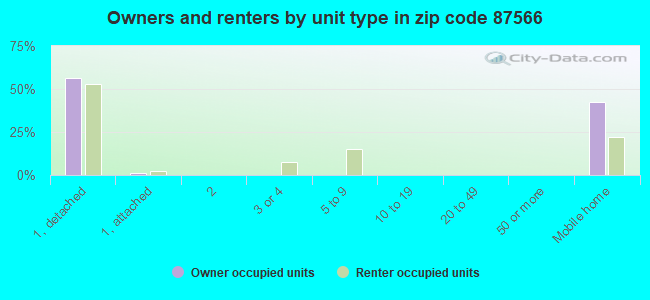
% of renters here:
12%
State:
29%
March 2022 cost of living index in zip code 87566: 88.6 (less than average, U.S. average is 100)
Land area: 20.8 sq. mi. Water area: 0.3 sq. mi.
Population density: 140 people per square mile
(very low).
OSM Map
General Map
Google Map
MSN Map
OSM Map
General Map
Google Map
MSN Map
OSM Map
General Map
Google Map
MSN Map
OSM Map
General Map
Google Map
MSN Map
Please wait while loading the map...
Real estate property taxes paid for housing units in 2022:
This zip code:
0.2% ($898)
New Mexico:
0.7% ($1,638)
Median real estate property taxes paid for housing units with mortgages in 2022: $1,158 (0.5%) Median real estate property taxes paid for housing units with no mortgage in 2022: $805 (0.3%)
Business Search- 14 Million verified businesses
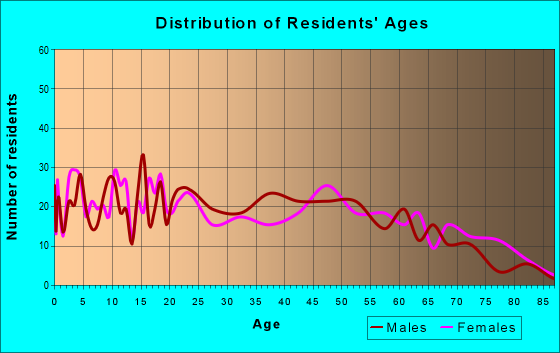
Males: 1,589
(54.7%)
Females: 1,316
(45.3%)
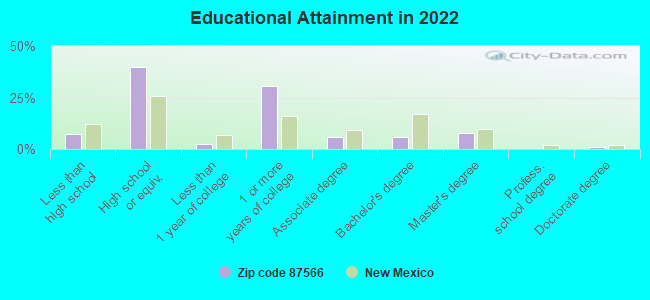
For population 25 years and over in 87566:
High school or higher: 91.0%
Bachelor's degree or higher: 14.1%
Graduate or professional degree: 8.2%
Unemployed: 5.5%
Mean travel time to work (commute): 18.0 minutes
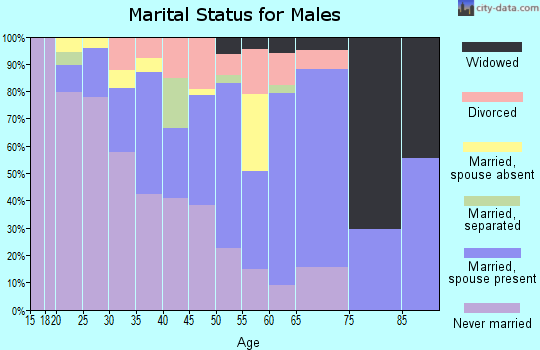
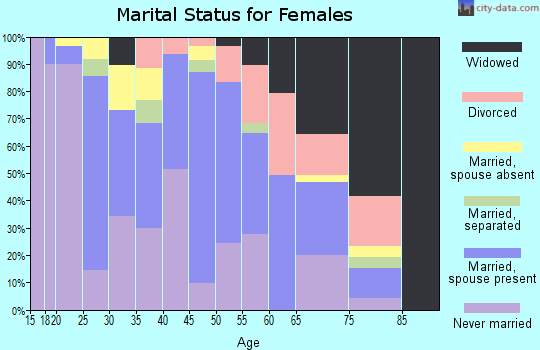
For population 15 years and over in 87566:
Never married: 60.2%
Now married: 21.8%
Separated: 0.9%
Widowed: 5.6%
Divorced: 11.5%
Zip code 87566 compared to state average:
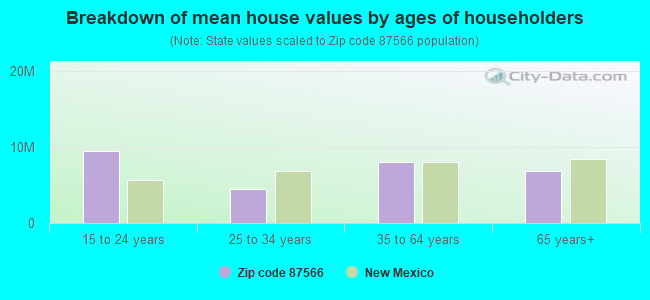
Median house value above state average.
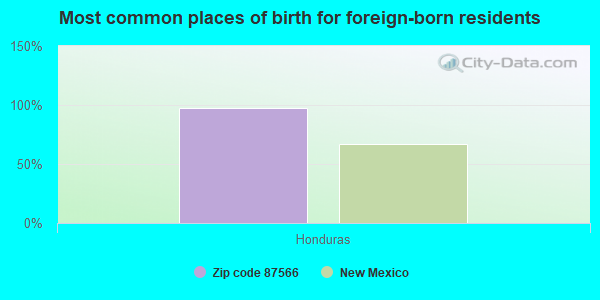
Foreign-born population percentage significantly below state average.
Renting percentage significantly below state average.
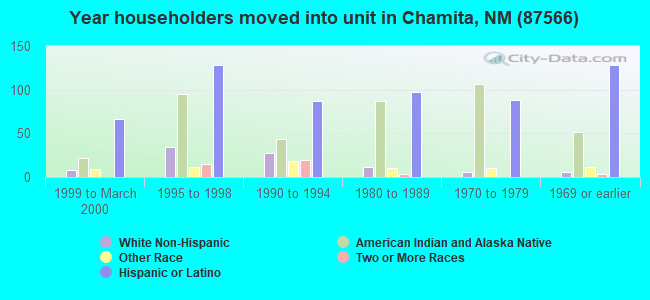
Length of stay since moving in significantly above state average.
Percentage of population with a bachelor's degree or higher below state average.
Estimated median house/condo value in 2022: $406,180
87566:
$406,180
New Mexico:
$243,100
According to our research of New Mexico and other state lists, there were 2 registered sex offenders living in 87566 zip code as of May 20, 2024. The ratio of all residents to sex offenders in zip code 87566 is 1,829 to 1. The ratio of registered sex offenders to all residents in this zip code is much lower than the state average.
Median resident age:
This zip code:
38.8 years
New Mexico median age:
39.4 years
Average household size:
This zip code:
3.5 people
New Mexico:
2.4 people
Averages for the 2020 tax year for zip code 87566, filed in 2021:
Average Adjusted Gross Income (AGI) in 2020: $38,950 (Individual Income Tax Returns)
Here:
$38,950
State:
$59,146
Salary/wage: $36,028 (reported on 79.7% of returns)
Here:
$36,028
State:
$48,327
(% of AGI for various income ranges: 1233.8% for AGIs below $25k, 3503.8% for AGIs $25k-50k, 7454.5% for AGIs $50k-75k, 10207.5% for AGIs $75k-100k, 19970.0% for AGIs $100k-200k)
Taxable interest for individuals: $229 (reported on 16.4% of returns)
This zip code:
$229
New Mexico:
$1,616
(% of AGI for various income ranges: 4.9% for AGIs below $25k, 2.9% for AGIs $25k-50k, 4.5% for AGIs $50k-75k, 10.0% for AGIs $75k-100k, 27.5% for AGIs $100k-200k)
Ordinary dividends: $267 (reported on 2.3% of returns)
Here:
$267
State:
$7,816
(% of AGI for various income ranges: 2.4% for AGIs $25k-50k)
Net capital gain/loss in AGI: +$567 (reported on 2.3% of returns)
Here:
+$567
State:
+$19,595
(% of AGI for various income ranges: 5.0% for AGIs $25k-50k)
Profit/loss from business: +$6,015 (reported on 10.2% of returns)
Here:
+$6,015
State:
+$11,430
(% of AGI for various income ranges: 44.3% for AGIs below $25k, 12.4% for AGIs $25k-50k, 80.0% for AGIs $50k-75k, 1220.0% for AGIs $100k-200k)
Taxable individual retirement arrangement distribution: $15,440 (reported on 3.9% of returns)
87566:
$15,440
New Mexico:
$20,970
(% of AGI for various income ranges: 701.8% for AGIs $50k-75k)
Earned income credit: $2,297 (reported on 28.1% of returns)
Here:
$2,297
State:
$2,323
(% of AGI for various income ranges: 136.5% for AGIs below $25k, 94.7% for AGIs $25k-50k)
Percentage of individuals using paid preparers for their 2020 taxes: 91.4%
Here:
91%
State:
92%
(% for various income ranges: 92.6% for AGIs below $25k, 92.7% for AGIs $25k-50k, 88.2% for AGIs $50k-75k, 85.7% for AGIs $75k-100k, 88.9% for AGIs $100k-200k)
Averages for the 2012 tax year for zip code 87566, filed in 2013:
Average Adjusted Gross Income (AGI) in 2012: $32,419 (Individual Income Tax Returns)
Here:
$32,419
State:
$50,343
Salary/wage: $29,943 (reported on 82.8% of returns)
Here:
$29,943
State:
$41,171
(% of AGI for various income ranges: 76.6% for AGIs below $25k, 83.3% for AGIs $25k-50k, 73.5% for AGIs $50k-75k, 71.5% for AGIs $75k-100k, 71.2% for AGIs $100k-200k)
Taxable interest for individuals: $453 (reported on 15.6% of returns)
This zip code:
$453
New Mexico:
$1,677
(% of AGI for various income ranges: 0.3% for AGIs below $25k, 0.2% for AGIs $25k-50k, 0.2% for AGIs $50k-75k, 0.3% for AGIs $100k-200k)
Ordinary dividends: $1,240 (reported on 4.1% of returns)
Here:
$1,240
State:
$6,939
Profit/loss from business: +$4,992 (reported on 9.8% of returns)
Here:
+$4,992
State:
+$11,059
Taxable individual retirement arrangement distribution: $10,925 (reported on 3.3% of returns)
87566:
$10,925
New Mexico:
$15,706
Total itemized deductions: $17,191 (23% of AGI, reported on 9.0% of returns)
Here:
$17,191
State:
$21,709
Here:
23.2% of AGI
State:
19.8% of AGI
(% of AGI for various income ranges: 4.7% for AGIs $25k-50k, 8.9% for AGIs $50k-75k, 8.6% for AGIs $100k-200k)
Charity contributions: $2,022 (reported on 7.4% of returns)
Here:
$2,022
State:
$4,195
(% of AGI for various income ranges: 0.4% for AGIs below $25k, 0.7% for AGIs $50k-75k, 1.3% for AGIs $100k-200k)
Taxes paid: $3,191 (reported on 9.0% of returns)
87566:
$3,191
State:
$6,176
(% of AGI for various income ranges: 0.4% for AGIs $25k-50k, 1.6% for AGIs $50k-75k, 2.4% for AGIs $100k-200k)
Earned income credit: $2,340 (reported on 35.2% of returns)
Here:
$2,340
State:
$2,311
(% of AGI for various income ranges: 9.8% for AGIs below $25k, 1.6% for AGIs $25k-50k)
Percentage of individuals using paid preparers for their 2012 taxes: 46.7%
Here:
47%
State:
50%
(% for various income ranges: 47.7% for AGIs below $25k, 42.4% for AGIs $25k-50k, 46.2% for AGIs $50k-75k, 60.0% for AGIs $75k-100k, 50.0% for AGIs $100k-200k)
Averages for the 2004 tax year for zip code 87566, filed in 2005:
Average Adjusted Gross Income (AGI) in 2004: $28,500 (Individual Income Tax Returns)
Here:
$28,500
State:
$39,572
Salary/wage: $27,351 (reported on 87.8% of returns)
Here:
$27,351
State:
$34,237
(% of AGI for various income ranges: 97.3% for AGIs below $10k, 86.5% for AGIs $10k-25k, 87.4% for AGIs $25k-50k, 86.4% for AGIs $50k-75k, 81.1% for AGIs $75k-100k, 63.9% for AGIs over 100k)
Taxable interest for individuals: $733 (reported on 21.5% of returns)
This zip code:
$733
New Mexico:
$1,873
(% of AGI for various income ranges: 2.7% for AGIs below $10k, 0.9% for AGIs $10k-25k, 0.5% for AGIs $25k-50k, 0.3% for AGIs $50k-75k, 0.4% for AGIs $75k-100k, 0.2% for AGIs over 100k)
Taxable dividends: $740 (reported on 4.2% of returns)
Here:
$740
State:
$3,554
Net capital gain/loss: +$2,879 (reported on 2.8% of returns)
Here:
+$2,879
State:
+$10,425
Total itemized deductions: $14,661 (23% of AGI, reported on 9.6% of returns)
Here:
$14,661
State:
$18,103
Here:
23.2% of AGI
State:
21.5% of AGI
(% of AGI for various income ranges: 2.2% for AGIs $10k-25k, 3.5% for AGIs $25k-50k, 6.3% for AGIs $50k-75k, 9.4% for AGIs $75k-100k, 8.8% for AGIs over 100k)
Charity contributions deductions: $1,613 (3% of AGI, reported on 7.8% of returns)
Here:
$1,613
State:
$3,246
Here:
2.6% of AGI
State:
3.6% of AGI
(% of AGI for various income ranges: 0.3% for AGIs $25k-50k, 0.8% for AGIs $50k-75k, 0.8% for AGIs $75k-100k, 0.7% for AGIs over 100k)
Total tax: $3,466 (reported on 62.2% of returns)
87566:
$3,466
State:
$6,237
(% of AGI for various income ranges: 1.9% for AGIs below $10k, 2.9% for AGIs $10k-25k, 6.3% for AGIs $25k-50k, 9.3% for AGIs $50k-75k, 10.5% for AGIs $75k-100k, 15.8% for AGIs over 100k)
Earned income credit: $1,687 (reported on 32.2% of returns)
Here:
$1,687
State:
$1,796
Percentage of individuals using paid preparers for their 2004 taxes: 55.6%
Here:
56%
State:
57%
(% for various income ranges: 49.5% for AGIs below $10k, 65.0% for AGIs $10k-25k, 52.4% for AGIs $25k-50k, 47.8% for AGIs $50k-75k, 50.0% for AGIs $75k-100k, 66.7% for AGIs over 100k)
Likely homosexual households (counted as self-reported same-sex unmarried-partner households)
Lesbian couples: 1.1% of all households
Gay men: 0.0% of all households
Household received Food Stamps/SNAP in the past 12 months: 142 Household did not receive Food Stamps/SNAP in the past 12 months: 582
Women who had a birth in the past 12 months: 6 (0 now married, 4 unmarried) Women who did not have a birth in the past 12 months: 681 (84 now married, 604 unmarried)
Housing units in zip code 87566 with a mortgage: 127 Median monthly owner costs for units with a mortgage: $991 Median monthly owner costs for units without a mortgage: $266
Residents with income below the poverty level in 2022:
This zip code:
19.8%
Whole state:
17.6%
Residents with income below 50% of the poverty level in 2022:
This zip code:
10.8%
Whole state:
9.7%
Median number of rooms in houses and condos:
Here:
5.0
State:
5.9
Median number of rooms in apartments:
Here:
4.2
State:
4.2
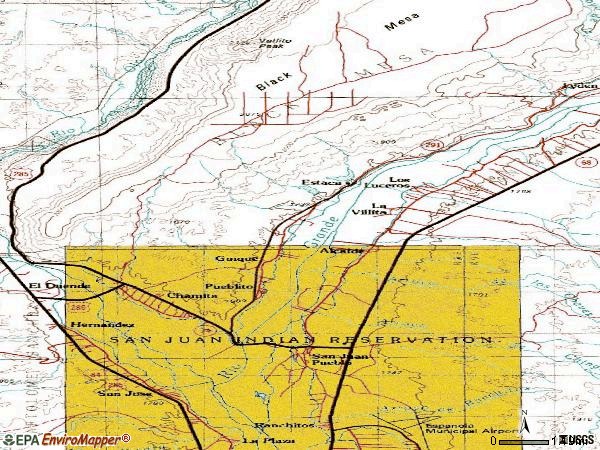
Notable locations in this zip code not listed on our city pages
Notable locations in zip code 87566: Old San Juan (A), San Juan Pueblo Community Library (B), Chamita Fire Department (C). Display/hide their locations on the map
Streams, rivers, and creeks: Rio Chama (A), Arroyo del Pueblito (B), Arroyo del Guique (C), Arroyo de Trujillos (D), Arroyo de los Peñita (E), Arroyo de los Borregos (F), Arroyo de las Canobitas (G), Arroyo de la Presa (H), Arroyo Maestas (I). Display/hide their locations on the map
Parks in zip code 87566 include: Pueblo of San Juan Historical Marker (1), San Gabriel on the Camino Real Historical Marker (2). Display/hide their locations on the map
In group quarters: 339 (-1 institutionalized population)
Size of family households: 222 2-persons, 126 3-persons, 47 4-persons, 45 5-persons, 6 6-persons, 16 7-or-more-persons
Size of nonfamily households: 218 1-person, 33 2-persons, 4 3-persons
179 married couples with children.
235 single-parent households (69 men, 166 women).
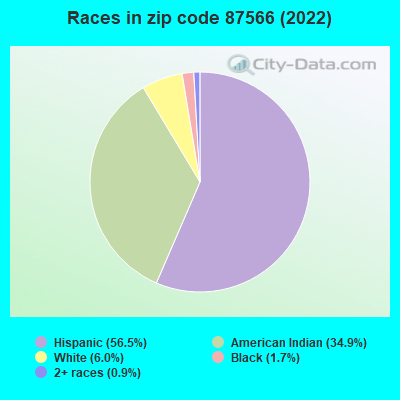
36.1% of residents of 87566 zip code speak English at home.
28.8% of residents speak Spanish at home (85% very well, 11% well, 3% not well, 1% not at all).
26.5% of residents speak other language at home (100% very well).
Foreign born population: 79 (2.7%) (56.4% of them are naturalized citizens)
This zip code:
2.7%
Whole state:
9.3%
98%Honduras
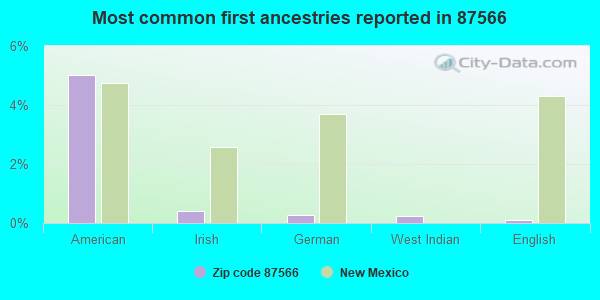
5%American
0%Irish
0%German
0%West Indian
0%English
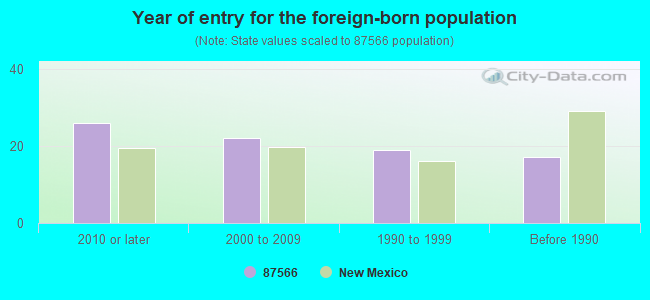
Year of entry for the foreign-born population
262010 or later
222000 to 2009
191990 to 1999
17Before 1990
Housing units lacking complete plumbing facilities: 9.2% Housing units lacking complete kitchen facilities: 1.9%
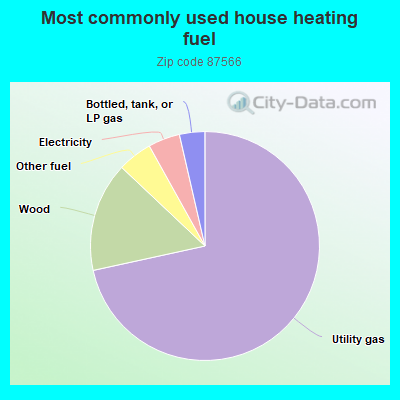
71.8%Utility gas
15.5%Wood
4.9%Other fuel
4.5%Electricity
3.6%Bottled, tank, or LP gas
Population in 1990: 5,209.
Place of birth for U.S.-born residents:
This state: 2,416
Northeast: 10
Midwest: 90
South: 121
West: 154
74% of the 87566 zip code residents lived in the same house 5 years ago. Out of people who lived in different houses, 64% lived in this county. Out of people who lived in different counties, 50% lived in New Mexico.
90% of the 87566 zip code residents lived in the same house 1 year ago. Out of people who lived in different houses, 20% moved from this county. Out of people who lived in different houses, 56% moved from different county within same state. Out of people who lived in different houses, 22% moved from different state.
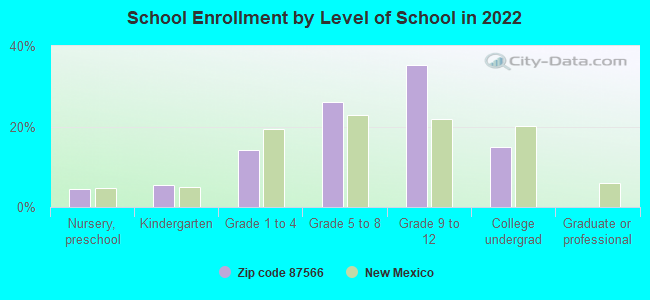
Private vs. public school enrollment:
Students in private schools in grades 1 to 8 (elementary and middle school): 57
Here:
20.5%
New Mexico:
10.2%
Students in private schools in grades 9 to 12 (high school): 55
Here:
22.6%
New Mexico:
10.0%
Students in private undergraduate colleges:
Here:
0.0%
New Mexico:
12.3%
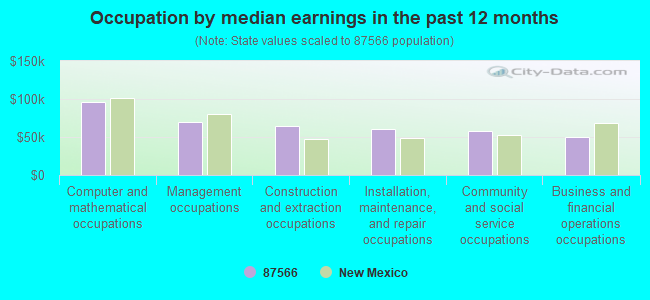
Occupation by median earnings in the past 12 months ($)
96,653Computer and mathematical occupations
70,240Management occupations
64,605Construction and extraction occupations
60,371Installation, maintenance, and repair occupations
57,725Community and social service occupations
49,929Business and financial operations occupations
Companies with federal contracts located in this zip code:
EIGHT NORTHERN INDIAN PUEBLOS (PO BOX 969 in SAN JUAN, NM) : $2,077,302 in 8 contractsfrom 2003 to 2005
Contracts for Other Medical Services by Public Health Service, Indian Health Service Signed by year:2000: $0; 2001: $0; 2002: $0; 2003: $1,007,056; 2004: $1,037,292; 2005: $32,954; 2006: $0.
Biggest contracts:
$1,028,155 with Public Health Service for Other Medical Services. Signed on 2004-02-13. Effective on 2004-02-10. Completion date: 2004-09-30.
$1,007,056, same as above.Signed on 2003-10-01. Completion date: 2004-09-30.
$21,558 with Indian Health Service for Other Medical Services. Signed on 2005-02-09. Completion date: 2005-09-30.
$10,329 with Public Health Service for Other Medical Services. Signed on 2004-06-17. Effective on 2004-03-01. Completion date: 2004-09-30.
PUEBLO OF SAN JUAN (SAN JUAN PUEBLO in SAN JUAN PUEBLO, NM; small business) : $288,445 in 8 contractsfrom 2002 to 2003
Contracts for Lease or Rental of Facilities -- Office Buildings by Public Buildings Service Signed by year:2000: $0; 2001: $0; 2002: $77,752; 2003: $210,693; 2004: $0; 2005: $0; 2006: $0.
Biggest contracts:
$40,553 with Public Buildings Service for Lease or Rental of Facilities -- Office Buildings. Signed on 2003-09-15. Completion date: 2003-09-15.
$40,553, same as above.Signed on 2003-06-15. Completion date: 2003-06-15.
$38,876, same as above.Signed on 2002-12-15. Completion date: 2002-12-15.
$38,876, same as above.Signed on 2003-03-15. Completion date: 2003-03-15.
PAISANO SURVEYING CO (NW CORNER OF HWY 68 in SAN JUAN PUEBLO, NM; small business) 3 employees, $78000 revenue. Small Disadvantaged Business
$73,000 with Indian Affairs (Assistant Secretary) for Miscellaneous Items. Signed on 2001-05-15. Completion date: 2001-06-15.
Top industries in this zip code by the number of employees in 2005:
Management of Companies and Enterprises: Corporate, Subsidiary, and Regional Managing Offices (100-249 employees: 1 establishment, 50-99 employees: 1 establishment)
Health Care and Social Assistance: All Other Outpatient Care Centers (20-49: 1)
Educational Services: Elementary and Secondary Schools (20-49: 1)
Health Care and Social Assistance: Other Individual and Family Services (10-19: 1, 5-9: 2, 1-4: 1)
Construction: New Single-Family Housing Construction (except Operative Builders) (5-9: 1, 1-4: 1)
Health Care and Social Assistance: Vocational Rehabilitation Services (5-9: 1)
Other Services (except Public Administration): Religious Organizations (5-9: 1)
Finance and Insurance: Other Activities Related to Credit Intermediation (5-9: 1)
People in group quarters in 2010:
94 people in residential treatment centers for adults
2 people in other noninstitutional facilities
People in group quarters in 2000:
122 people in homes or halfway houses for drug/alcohol abuse
Fatal accident statistics in 2013:
Fatal accident count: 2
Vehicles involved in fatal accidents: 2
Fatal accidents caused by drunken drivers: 2
Fatalities: 2
Persons involved in fatal accidents: 3
Pedestrians involved in fatal accidents: 0
2006 - 2018 National Fire Incident Reporting System (NFIRS) incidents
According to the data from the years 2006 - 2018 the average number of fire incidents per year is 12. The highest number of reported fire incidents - 25 took place in 2011, and the least - 0 in 2008. The data has a growing trend.
When looking into fire subcategories, the most incidents belonged to: Outside Fires (51.0%), and Structure Fires (30.5%).
Fire incident types reported to NFIRS in Zip Code 87566


 Nearest zip codes: 87533, 87532, 87567, 87582, 87548, 87537.


 : $2,077,302 in 8 contracts from 2003 to 2005


 According to the data from the years 2006 - 2018 the average number of fire incidents per year is 12. The highest number of reported fire incidents - 25 took place in 2011, and the least - 0 in 2008. The data has a growing trend.
 When looking into fire subcategories, the most incidents belonged to: Outside Fires (51.0%), and Structure Fires (30.5%).