Averages for the 2020 tax year for zip code 86044, filed in 2021:
Average Adjusted Gross Income (AGI) in 2020: $33,952 (Individual Income Tax Returns)
Here:
$33,952
State:
$73,499
Salary/wage: $31,303 (reported on 86.6% of returns)
Here:
$31,303
State:
$59,499
(% of AGI for various income ranges: 1111.2% for AGIs below $25k, 3524.4% for AGIs $25k-50k, 6096.2% for AGIs $50k-75k, 11675.0% for AGIs $75k-100k, 16680.0% for AGIs $100k-200k)
Taxable interest for individuals: $120 (reported on 3.9% of returns)
This zip code:
$120
Arizona:
$2,325
(% of AGI for various income ranges: 0.2% for AGIs below $25k, 1.6% for AGIs $25k-50k)
Profit/loss from business: +$4,756 (reported on 7.1% of returns)
Here:
+$4,756
State:
+$13,214
(% of AGI for various income ranges: 72.4% for AGIs below $25k, 20.6% for AGIs $25k-50k)
Earned income credit: $2,651 (reported on 38.6% of returns)
Here:
$2,651
State:
$2,383
(% of AGI for various income ranges: 178.0% for AGIs below $25k, 127.8% for AGIs $25k-50k)
Percentage of individuals using paid preparers for their 2020 taxes: 96.1%
Here:
96%
State:
93%
(% for various income ranges: 96.7% for AGIs below $25k, 94.9% for AGIs $25k-50k, 100.0% for AGIs $50k-75k, 100.0% for AGIs $75k-100k, 80.0% for AGIs $100k-200k)
Averages for the 2012 tax year for zip code 86044, filed in 2013:
Average Adjusted Gross Income (AGI) in 2012: $30,582 (Individual Income Tax Returns)
Here:
$30,582
State:
$57,644
Salary/wage: $29,051 (reported on 93.0% of returns)
Here:
$29,051
State:
$47,932
(% of AGI for various income ranges: 82.6% for AGIs below $25k, 90.0% for AGIs $25k-50k, 92.3% for AGIs $50k-75k, 89.2% for AGIs $75k-100k, 88.4% for AGIs $100k-200k)
Taxable interest for individuals: $125 (reported on 3.5% of returns)
This zip code:
$125
Arizona:
$2,064
Profit/loss from business: +$5,889 (reported on 7.9% of returns)
Here:
+$5,889
State:
+$12,323
(% of AGI for various income ranges: 5.7% for AGIs below $25k, 0.5% for AGIs $25k-50k)
Total itemized deductions: $24,954 (36% of AGI, reported on 11.4% of returns)
Here:
$24,954
State:
$23,651
Here:
35.8% of AGI
State:
20.6% of AGI
(% of AGI for various income ranges: 7.9% for AGIs $25k-50k, 17.6% for AGIs $50k-75k, 24.9% for AGIs $75k-100k)
Charity contributions: $2,633 (reported on 7.9% of returns)
Here:
$2,633
State:
$4,114
(% of AGI for various income ranges: 0.4% for AGIs below $25k, 1.5% for AGIs $50k-75k, 1.9% for AGIs $75k-100k)
Taxes paid: $1,992 (reported on 11.4% of returns)
86044:
$1,992
State:
$6,509
(% of AGI for various income ranges: 0.4% for AGIs $25k-50k, 1.2% for AGIs $50k-75k, 2.7% for AGIs $75k-100k)
Earned income credit: $2,698 (reported on 49.1% of returns)
Here:
$2,698
State:
$2,432
(% of AGI for various income ranges: 14.6% for AGIs below $25k, 2.8% for AGIs $25k-50k)
Percentage of individuals using paid preparers for their 2012 taxes: 80.7%
Here:
81%
State:
52%
(% for various income ranges: 81.2% for AGIs below $25k, 78.6% for AGIs $25k-50k, 83.3% for AGIs $50k-75k, 83.3% for AGIs $75k-100k, 75.0% for AGIs $100k-200k)
Averages for the 2004 tax year for zip code 86044, filed in 2005:
Average Adjusted Gross Income (AGI) in 2004: $25,424 (Individual Income Tax Returns)
Here:
$25,424
State:
$50,097
Salary/wage: $24,729 (reported on 94.8% of returns)
Here:
$24,729
State:
$42,146
(% of AGI for various income ranges: 85.2% for AGIs below $10k, 87.1% for AGIs $10k-25k, 94.0% for AGIs $25k-50k, 95.8% for AGIs $50k-75k, 98.3% for AGIs $75k-100k, 81.5% for AGIs over 100k)
Taxable interest for individuals: $145 (reported on 5.7% of returns)
This zip code:
$145
Arizona:
$2,374
(% of AGI for various income ranges: 0.0% for AGIs $10k-25k, 0.0% for AGIs $25k-50k, 0.0% for AGIs $50k-75k, 0.1% for AGIs $75k-100k)
Taxable dividends: $125 (reported on 1.5% of returns)
Here:
$125
State:
$3,888
Net capital gain/loss: +$471 (reported on 1.6% of returns)
Here:
+$471
State:
+$17,569
Profit/loss from business: +$4,292 (reported on 9.7% of returns)
Here:
+$4,292
State:
+$11,088
(% of AGI for various income ranges: 8.4% for AGIs below $10k, 4.0% for AGIs $10k-25k, 0.9% for AGIs $25k-50k, -0.0% for AGIs $50k-75k)
IRA payment deduction: $357 (reported on 1.3% of returns)
86044:
$357
Arizona:
$3,023
Total itemized deductions: $21,593 (43% of AGI, reported on 16.7% of returns)
Here:
$21,593
State:
$19,781
Here:
43.3% of AGI
State:
21.8% of AGI
(% of AGI for various income ranges: 4.7% for AGIs $10k-25k, 19.9% for AGIs $25k-50k, 19.5% for AGIs $50k-75k, 20.7% for AGIs $75k-100k)
Charity contributions deductions: $2,365 (5% of AGI, reported on 12.6% of returns)
Here:
$2,365
State:
$3,389
Here:
4.5% of AGI
State:
3.5% of AGI
(% of AGI for various income ranges: 0.1% for AGIs $10k-25k, 1.2% for AGIs $25k-50k, 1.8% for AGIs $50k-75k, 2.9% for AGIs $75k-100k)
Total tax: $2,539 (reported on 40.4% of returns)
86044:
$2,539
State:
$8,323
(% of AGI for various income ranges: 1.8% for AGIs below $10k, 1.6% for AGIs $10k-25k, 2.1% for AGIs $25k-50k, 5.0% for AGIs $50k-75k, 7.8% for AGIs $75k-100k, 13.6% for AGIs over 100k)
Earned income credit: $2,022 (reported on 54.8% of returns)
Here:
$2,022
State:
$1,786
Percentage of individuals using paid preparers for their 2004 taxes: 84.9%
Here:
85%
State:
60%
(% for various income ranges: 79.9% for AGIs below $10k, 89.8% for AGIs $10k-25k, 83.1% for AGIs $25k-50k, 88.9% for AGIs $50k-75k, 80.0% for AGIs $75k-100k, 100.0% for AGIs over 100k)
Household received Food Stamps/SNAP in the past 12 months: 410 Household did not receive Food Stamps/SNAP in the past 12 months: 717
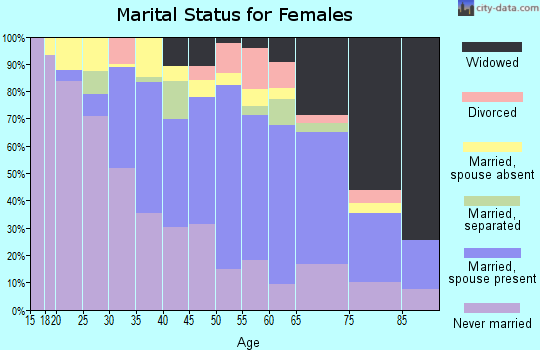
Women who had a birth in the past 12 months: 70 (27 now married, 41 unmarried) Women who did not have a birth in the past 12 months: 698 (97 now married, 607 unmarried)
Housing units in zip code 86044 with a mortgage: 46 Median monthly owner costs for units with a mortgage: $654 Median monthly owner costs for units without a mortgage: $182
Residents with income below the poverty level in 2022:
This zip code:
42.6%
Whole state:
12.5%
Residents with income below 50% of the poverty level in 2022:
This zip code:
18.1%
Whole state:
6.0%
Median number of rooms in houses and condos:
Here:
4.0
State:
6.0
Median number of rooms in apartments:
Here:
4.2
State:
4.1
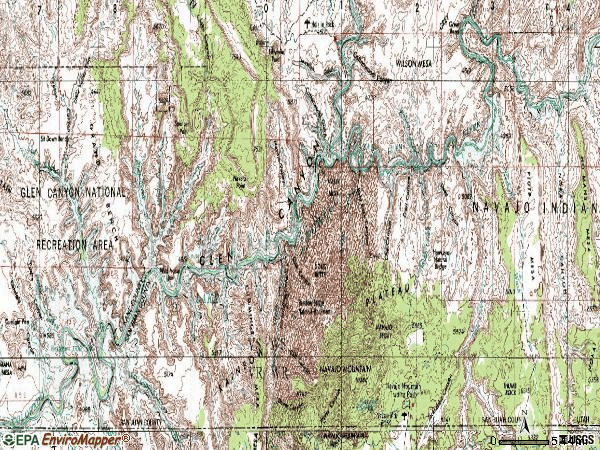
Notable locations in this zip code not listed on our city pages
Notable locations in zip code 86044: Begay Windmill (A), Rainbow Lodge (B), Inscription House Ruin (C), Inscription House Trading Post (D), Beacon Power Plant (E), Cow Springs Trading Post (F), The Old Windmill (G), Old Cow Springs Trading Post (H). Display/hide their locations on the map
Size of family households: 265 2-persons, 157 3-persons, 134 4-persons, 73 5-persons, 46 6-persons, 42 7-or-more-persons
Size of nonfamily households: 318 1-person, 80 2-persons
145 married couples with children.
257 single-parent households (58 men, 199 women).
18.9% of residents of 86044 zip code speak English at home.
0.3% of residents speak Spanish at home (100% very well).
0.5% of residents speak Asian or Pacific Island language at home (100% very well).
77.5% of residents speak other language at home (74% very well, 16% well, 8% not well, 2% not at all).
Foreign born population: 40 (1.2%) (77.8% of them are naturalized citizens)
This zip code:
1.2%
Whole state:
13.1%
56%Bhutan
23%Japan
21%Uruguay
0%American
0%Irish
0%German
Year of entry for the foreign-born population
02010 or later
42000 to 2009
121990 to 1999
19Before 1990
Facilities with environmental interests located in this zip code:
NAVAJO MOUNTAIN HIGH (RESERVATION RD #16 in NAVAJO MT, UT)
(National Center for Education Statistics) - STATE ID-25 712 Organizations: SAN JUAN SCHOOL DISTRICT (SCHOOL DISTRICT)
APL TONALEA PUMP STATION (1 MILE SW/RED LAKE TRADING POS in TONALEA, AZ) . Tribal Land
Conditionally Exempt Small Quantity Generators, less than 100 kg/month of hazardous waste (Resource Conservation and Recovery Act (tracking hazardous waste)) - notification Organizations: ARCO PIPELINE COMPANY (CONTACT/OWNER)
BIA BLACK MESA COMMUNITY SCHOOL NN (BLACK MESA 67 MILES WEST OF CHINLE in TONALEA, AZ) . Federal Facility. BUREAU OF INDIAN AFFAIRS. Tribal Land
Conditionally Exempt Small Quantity Generators, less than 100 kg/month of hazardous waste (Resource Conservation and Recovery Act (tracking hazardous waste)) - notification Organizations: USDOI BIA OIEP (CONTACT/OWNER)
Alternative names: USDOI BIA BLACK MESA COMMUNITY SCHOOL
Housing units lacking complete plumbing facilities: 30.3% Housing units lacking complete kitchen facilities: 21.8%
79.5%Wood
8.7%Electricity
8.3%Bottled, tank, or LP gas
2.3%Other fuel
0.7%No fuel used
0.7%Utility gas
Population in 1990: 158. Population change in the 1990s: +4,827 (+3055.1%).
Place of birth for U.S.-born residents:
This state: 2,469
Northeast: 2
Midwest: 19
South: 5
West: 711
83% of the 86044 zip code residents lived in the same house 5 years ago. Out of people who lived in different houses, 74% lived in this county. Out of people who lived in different counties, 50% lived in Arizona.
100% of the 86044 zip code residents lived in the same house 1 year ago.
Private vs. public school enrollment:
Students in private schools in grades 1 to 8 (elementary and middle school): 6
Here:
2.0%
Arizona:
10.4%
Students in private schools in grades 9 to 12 (high school): 32
Here:
9.1%
Arizona:
8.8%
Students in private undergraduate colleges:
Here:
0.0%
Arizona:
13.1%
Occupation by median earnings in the past 12 months ($)
96,840Management occupations
64,914Health technologists and technicians
60,973Education, training, and library occupations
46,060Installation, maintenance, and repair occupations
36,485Office and administrative support occupations
34,976Personal care and service occupations
Top industries in this zip code by the number of employees in 2005:
Construction: Poured Concrete Foundation and Structure Contractors (5-9 employees: 1 establishment)
People in group quarters in 2010:
7 people in other noninstitutional facilities
Fatal accident statistics in 2014:
Fatal accident count: 2
Vehicles involved in fatal accidents: 4
Fatal accidents caused by drunken drivers: 2
Fatalities: 6
Persons involved in fatal accidents: 10
Pedestrians involved in fatal accidents: 0
Fatal accident statistics in 2013:
Fatal accident count: 1
Vehicles involved in fatal accidents: 2
Fatal accidents caused by drunken drivers: 0
Fatalities: 1
Persons involved in fatal accidents: 6
Pedestrians involved in fatal accidents: 0
Home Mortgage Disclosure Act Aggregated Statistics For Year 2009 (Based on 2 partial tracts)
A) FHA, FSA/RHS & VA Home Purchase Loans
B) Conventional Home Purchase Loans
C) Refinancings
D) Home Improvement Loans
F) Non-occupant Loans on < 5 Family Dwellings (A B C & D)
G) Loans On Manufactured Home Dwelling (A B C & D)
Number
Average Value
Number
Average Value
Number
Average Value
Number
Average Value
Number
Average Value
Number
Average Value
LOANS ORIGINATED
4
$211,338
1
$121,790
9
$205,926
0
$0
1
$130,380
4
$104,058
APPLICATIONS APPROVED, NOT ACCEPTED
0
$0
0
$0
1
$73,790
1
$1,430
0
$0
1
$75,220
APPLICATIONS DENIED
1
$133,250
4
$67,700
3
$202,740
3
$4,300
1
$20,060
4
$40,835
APPLICATIONS WITHDRAWN
2
$280,470
0
$0
1
$340,290
0
$0
0
$0
0
$0
FILES CLOSED FOR INCOMPLETENESS
0
$0
0
$0
0
$0
0
$0
0
$0
0
$0
Aggregated Statistics For Year 2008 (Based on 2 partial tracts)
A) FHA, FSA/RHS & VA Home Purchase Loans
B) Conventional Home Purchase Loans
C) Refinancings
D) Home Improvement Loans
F) Non-occupant Loans on < 5 Family Dwellings (A B C & D)
G) Loans On Manufactured Home Dwelling (A B C & D)
Number
Average Value
Number
Average Value
Number
Average Value
Number
Average Value
Number
Average Value
Number
Average Value
LOANS ORIGINATED
3
$198,920
2
$128,595
1
$224,950
0
$0
1
$22,210
2
$110,325
APPLICATIONS APPROVED, NOT ACCEPTED
0
$0
3
$110,563
0
$0
0
$0
0
$0
2
$62,325
APPLICATIONS DENIED
1
$80,240
4
$114,265
3
$111,760
4
$28,655
1
$320,950
6
$59,342
APPLICATIONS WITHDRAWN
0
$0
0
$0
1
$209,190
1
$25,790
1
$65,910
1
$25,790
FILES CLOSED FOR INCOMPLETENESS
0
$0
0
$0
0
$0
0
$0
0
$0
0
$0
Aggregated Statistics For Year 2007 (Based on 2 partial tracts)
A) FHA, FSA/RHS & VA Home Purchase Loans
B) Conventional Home Purchase Loans
C) Refinancings
D) Home Improvement Loans
F) Non-occupant Loans on < 5 Family Dwellings (A B C & D)
G) Loans On Manufactured Home Dwelling (A B C & D)
Number
Average Value
Number
Average Value
Number
Average Value
Number
Average Value
Number
Average Value
Number
Average Value
LOANS ORIGINATED
3
$149,490
8
$179,010
7
$152,184
1
$27,220
4
$173,190
4
$140,772
APPLICATIONS APPROVED, NOT ACCEPTED
0
$0
0
$0
1
$13,610
1
$1,430
0
$0
0
$0
APPLICATIONS DENIED
1
$73,070
4
$193,965
5
$144,426
2
$15,760
4
$95,818
4
$67,342
APPLICATIONS WITHDRAWN
0
$0
0
$0
2
$95,640
0
$0
0
$0
1
$25,070
FILES CLOSED FOR INCOMPLETENESS
0
$0
1
$138,980
1
$99,580
0
$0
1
$238,560
0
$0
Aggregated Statistics For Year 2006 (Based on 2 partial tracts)
A) FHA, FSA/RHS & VA Home Purchase Loans
B) Conventional Home Purchase Loans
C) Refinancings
D) Home Improvement Loans
F) Non-occupant Loans on < 5 Family Dwellings (A B C & D)
G) Loans On Manufactured Home Dwelling (A B C & D)
Number
Average Value
Number
Average Value
Number
Average Value
Number
Average Value
Number
Average Value
Number
Average Value
LOANS ORIGINATED
1
$145,430
12
$113,191
2
$142,920
1
$7,160
4
$150,982
2
$97,070
APPLICATIONS APPROVED, NOT ACCEPTED
1
$79,520
1
$161,190
2
$96,715
1
$80,950
1
$287,280
1
$121,790
APPLICATIONS DENIED
0
$0
7
$162,930
9
$103,560
3
$24,597
4
$131,638
3
$37,970
APPLICATIONS WITHDRAWN
0
$0
3
$133,490
6
$123,102
0
$0
1
$194,860
1
$60,180
FILES CLOSED FOR INCOMPLETENESS
0
$0
1
$136,120
1
$85,970
1
$77,370
0
$0
0
$0
Aggregated Statistics For Year 2005 (Based on 2 partial tracts)
A) FHA, FSA/RHS & VA Home Purchase Loans
B) Conventional Home Purchase Loans
C) Refinancings
D) Home Improvement Loans
F) Non-occupant Loans on < 5 Family Dwellings (A B C & D)
G) Loans On Manufactured Home Dwelling (A B C & D)
Number
Average Value
Number
Average Value
Number
Average Value
Number
Average Value
Number
Average Value
Number
Average Value
LOANS ORIGINATED
1
$138,980
2
$88,475
4
$159,578
3
$66,627
0
$0
3
$77,133
APPLICATIONS APPROVED, NOT ACCEPTED
0
$0
0
$0
0
$0
1
$5,730
0
$0
0
$0
APPLICATIONS DENIED
0
$0
4
$134,325
8
$86,685
5
$25,504
3
$71,640
7
$71,026
APPLICATIONS WITHDRAWN
0
$0
2
$142,205
4
$143,998
3
$65,910
0
$0
0
$0
FILES CLOSED FOR INCOMPLETENESS
0
$0
3
$100,057
1
$136,120
0
$0
1
$39,400
1
$39,400
Aggregated Statistics For Year 2004 (Based on 2 partial tracts)
A) FHA, FSA/RHS & VA Home Purchase Loans
B) Conventional Home Purchase Loans
C) Refinancings
D) Home Improvement Loans
F) Non-occupant Loans on < 5 Family Dwellings (A B C & D)
G) Loans On Manufactured Home Dwelling (A B C & D)
Number
Average Value
Number
Average Value
Number
Average Value
Number
Average Value
Number
Average Value
Number
Average Value
LOANS ORIGINATED
0
$0
6
$116,177
5
$156,462
1
$60,890
2
$162,625
2
$57,670
APPLICATIONS APPROVED, NOT ACCEPTED
1
$76,650
2
$59,460
1
$133,970
0
$0
0
$0
2
$59,460
APPLICATIONS DENIED
1
$60,890
6
$55,522
11
$73,464
4
$9,135
1
$34,390
9
$41,710
APPLICATIONS WITHDRAWN
0
$0
1
$51,580
1
$111,040
0
$0
0
$0
0
$0
FILES CLOSED FOR INCOMPLETENESS
0
$0
2
$136,830
5
$115,914
0
$0
1
$75,940
1
$154,030
Aggregated Statistics For Year 2003 (Based on 2 partial tracts)
A) FHA, FSA/RHS & VA Home Purchase Loans
B) Conventional Home Purchase Loans
C) Refinancings
D) Home Improvement Loans
F) Non-occupant Loans on < 5 Family Dwellings (A B C & D)
Number
Average Value
Number
Average Value
Number
Average Value
Number
Average Value
Number
Average Value
LOANS ORIGINATED
1
$76,650
5
$129,954
11
$126,216
1
$7,160
0
$0
APPLICATIONS APPROVED, NOT ACCEPTED
0
$0
1
$87,400
4
$88,298
1
$19,340
0
$0
APPLICATIONS DENIED
0
$0
9
$86,764
8
$61,790
6
$8,597
1
$21,490
APPLICATIONS WITHDRAWN
0
$0
2
$140,055
10
$89,765
1
$2,870
1
$43,700
FILES CLOSED FOR INCOMPLETENESS
0
$0
0
$0
0
$0
0
$0
0
$0
Aggregated Statistics For Year 1999 (Based on 1 partial tract)
B) Conventional Home Purchase Loans
C) Refinancings
D) Home Improvement Loans
F) Non-occupant Loans on < 5 Family Dwellings (A B C & D)

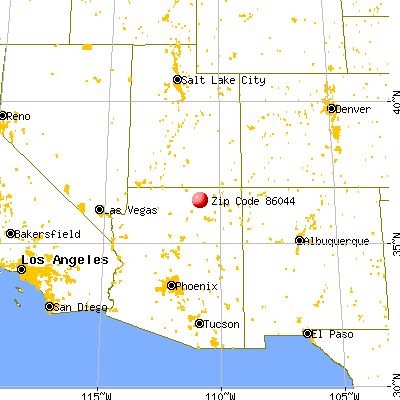


 Nearest zip codes: 86054, 86053, 86033, 86040, 84536, 86045.