Estimated zip code population in 2022: 40,271 Zip code population in 2010: 34,640 Zip code population in 2000: 33,812
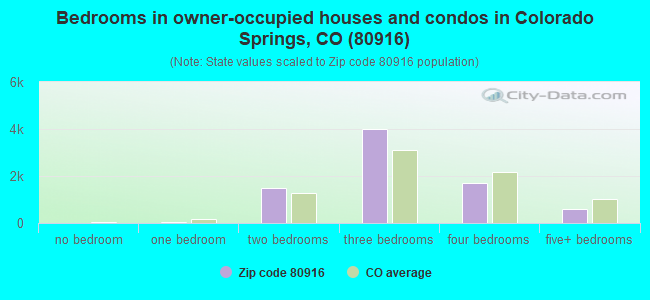
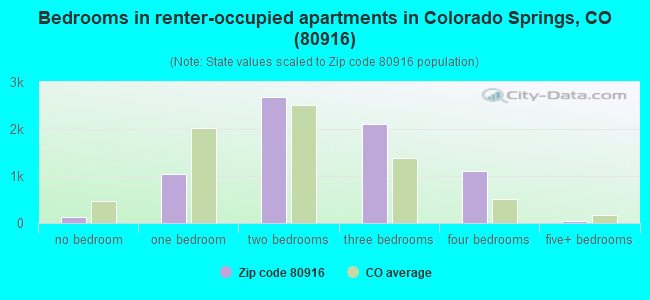
Houses and condos: 15,828 Renter-occupied apartments: 7,120
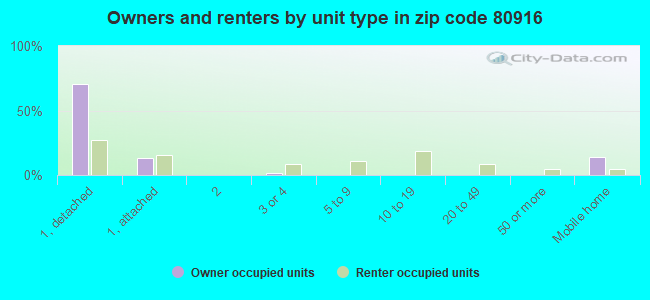
% of renters here:
48%
State:
34%
March 2022 cost of living index in zip code 80916: 99.6 (near average, U.S. average is 100)
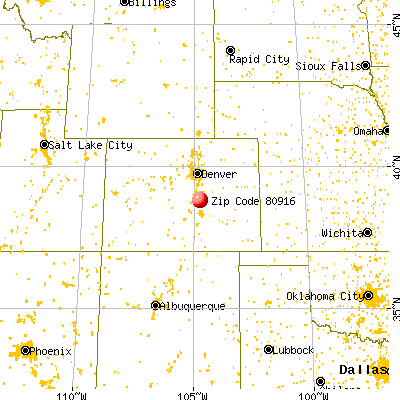
Land area: 17.2 sq. mi. Water area: 0.0 sq. mi.
Population density: 2,345 people per square mile
(low).
OSM Map
General Map
Google Map
MSN Map
OSM Map
General Map
Google Map
MSN Map
OSM Map
General Map
Google Map
MSN Map
OSM Map
General Map
Google Map
MSN Map
Please wait while loading the map...
Real estate property taxes paid for housing units in 2022:
This zip code:
0.3% ($844)
Colorado:
0.5% ($2,422)
Median real estate property taxes paid for housing units with mortgages in 2022: $934 (0.3%) Median real estate property taxes paid for housing units with no mortgage in 2022: $541 (0.3%)
Averages for the 2020 tax year for zip code 80916, filed in 2021:
Average Adjusted Gross Income (AGI) in 2020: $40,867 (Individual Income Tax Returns)
Here:
$40,867
State:
$89,260
Salary/wage: $38,824 (reported on 86.7% of returns)
Here:
$38,824
State:
$70,330
(% of AGI for various income ranges: 1270.4% for AGIs below $25k, 3756.1% for AGIs $25k-50k, 6764.9% for AGIs $50k-75k, 10048.3% for AGIs $75k-100k, 16906.1% for AGIs $100k-200k)
Taxable interest for individuals: $348 (reported on 19.3% of returns)
This zip code:
$348
Colorado:
$2,176
(% of AGI for various income ranges: 4.3% for AGIs below $25k, 6.2% for AGIs $25k-50k, 9.1% for AGIs $50k-75k, 16.2% for AGIs $75k-100k, 44.4% for AGIs $100k-200k)
Ordinary dividends: $972 (reported on 6.2% of returns)
Here:
$972
State:
$8,820
(% of AGI for various income ranges: 3.4% for AGIs below $25k, 3.8% for AGIs $25k-50k, 5.4% for AGIs $50k-75k, 27.1% for AGIs $75k-100k, 47.2% for AGIs $100k-200k)
Net capital gain/loss in AGI: +$4,939 (reported on 6.2% of returns)
Here:
+$4,939
State:
+$37,276
(% of AGI for various income ranges: 1.2% for AGIs below $25k, 6.8% for AGIs $25k-50k, 22.1% for AGIs $50k-75k, 68.0% for AGIs $75k-100k, 377.9% for AGIs $100k-200k)
Profit/loss from business: +$10,877 (reported on 16.4% of returns)
Here:
+$10,877
State:
+$15,295
(% of AGI for various income ranges: 210.3% for AGIs below $25k, 189.3% for AGIs $25k-50k, 217.5% for AGIs $50k-75k, 332.4% for AGIs $75k-100k, 653.9% for AGIs $100k-200k)
Taxable individual retirement arrangement distribution: $10,206 (reported on 2.7% of returns)
80916:
$10,206
Colorado:
$23,785
(% of AGI for various income ranges: 14.3% for AGIs below $25k, 19.4% for AGIs $25k-50k, 48.5% for AGIs $50k-75k, 74.4% for AGIs $75k-100k, 244.4% for AGIs $100k-200k)
Total itemized deductions: $23,214 (reported on 2.4% of returns)
Here:
$23,214
State:
$35,141
(% of AGI for various income ranges: 7.8% for AGIs below $25k, 33.0% for AGIs $25k-50k, 130.9% for AGIs $50k-75k, 169.1% for AGIs $75k-100k, 590.4% for AGIs $100k-200k)
Charity contributions: $8,461 (reported on 1.3% of returns)
Here:
$8,461
State:
$12,103
(% of AGI for various income ranges: 4.5% for AGIs $25k-50k, 18.0% for AGIs $50k-75k, 21.9% for AGIs $75k-100k, 199.5% for AGIs $100k-200k)
Taxes paid: $4,322 (reported on 2.3% of returns)
80916:
$4,322
State:
$7,710
(% of AGI for various income ranges: 0.8% for AGIs below $25k, 4.6% for AGIs $25k-50k, 23.9% for AGIs $50k-75k, 36.3% for AGIs $75k-100k, 116.0% for AGIs $100k-200k)
Earned income credit: $2,487 (reported on 24.3% of returns)
Here:
$2,487
State:
$2,053
(% of AGI for various income ranges: 124.4% for AGIs below $25k, 86.0% for AGIs $25k-50k, 2.6% for AGIs $50k-75k)
Percentage of individuals using paid preparers for their 2020 taxes: 93.1%
Here:
93%
State:
93%
(% for various income ranges: 90.4% for AGIs below $25k, 94.3% for AGIs $25k-50k, 94.9% for AGIs $50k-75k, 95.2% for AGIs $75k-100k, 94.7% for AGIs $100k-200k, 100.0% for AGIs over 200k)
Averages for the 2012 tax year for zip code 80916, filed in 2013:
Average Adjusted Gross Income (AGI) in 2012: $33,678 (Individual Income Tax Returns)
Here:
$33,678
State:
$69,103
Salary/wage: $31,665 (reported on 89.8% of returns)
Here:
$31,665
State:
$54,794
(% of AGI for various income ranges: 83.9% for AGIs below $25k, 88.8% for AGIs $25k-50k, 84.7% for AGIs $50k-75k, 82.6% for AGIs $75k-100k, 79.9% for AGIs $100k-200k, 46.7% for AGIs over 200k)
Taxable interest for individuals: $326 (reported on 23.5% of returns)
This zip code:
$326
Colorado:
$1,971
(% of AGI for various income ranges: 0.3% for AGIs below $25k, 0.1% for AGIs $25k-50k, 0.3% for AGIs $50k-75k, 0.2% for AGIs $75k-100k, 0.3% for AGIs $100k-200k)
Ordinary dividends: $1,040 (reported on 6.1% of returns)
Here:
$1,040
State:
$7,140
(% of AGI for various income ranges: 0.2% for AGIs below $25k, 0.1% for AGIs $25k-50k, 0.2% for AGIs $50k-75k, 0.2% for AGIs $75k-100k, 0.4% for AGIs $100k-200k)
Net capital gain/loss in AGI: +$1,232 (reported on 4.0% of returns)
Here:
+$1,232
State:
+$23,009
(% of AGI for various income ranges: 0.3% for AGIs $50k-75k, 0.6% for AGIs $100k-200k)
Profit/loss from business: +$7,693 (reported on 11.5% of returns)
Here:
+$7,693
State:
+$13,514
(% of AGI for various income ranges: 7.3% for AGIs below $25k, 1.9% for AGIs $25k-50k, 1.2% for AGIs $50k-75k, 1.7% for AGIs $75k-100k, 1.0% for AGIs $100k-200k)
Taxable individual retirement arrangement distribution: $8,672 (reported on 3.7% of returns)
80916:
$8,672
Colorado:
$17,927
(% of AGI for various income ranges: 0.8% for AGIs below $25k, 0.7% for AGIs $25k-50k, 1.0% for AGIs $50k-75k, 1.3% for AGIs $75k-100k, 1.8% for AGIs $100k-200k)
Total itemized deductions: $16,184 (26% of AGI, reported on 16.6% of returns)
Here:
$16,184
State:
$24,621
Here:
26.2% of AGI
State:
18.5% of AGI
(% of AGI for various income ranges: 5.3% for AGIs below $25k, 6.2% for AGIs $25k-50k, 8.6% for AGIs $50k-75k, 10.6% for AGIs $75k-100k, 11.5% for AGIs $100k-200k, 21.7% for AGIs over 200k)
Charity contributions: $2,706 (reported on 11.7% of returns)
Here:
$2,706
State:
$4,449
(% of AGI for various income ranges: 0.3% for AGIs below $25k, 0.6% for AGIs $25k-50k, 1.0% for AGIs $50k-75k, 1.4% for AGIs $75k-100k, 2.4% for AGIs $100k-200k)
Taxes paid: $3,250 (reported on 16.4% of returns)
80916:
$3,250
State:
$7,641
(% of AGI for various income ranges: 0.6% for AGIs below $25k, 1.1% for AGIs $25k-50k, 1.7% for AGIs $50k-75k, 2.5% for AGIs $75k-100k, 3.1% for AGIs $100k-200k, 3.8% for AGIs over 200k)
Earned income credit: $2,557 (reported on 32.6% of returns)
Here:
$2,557
State:
$2,095
(% of AGI for various income ranges: 9.4% for AGIs below $25k, 2.0% for AGIs $25k-50k)
Percentage of individuals using paid preparers for their 2012 taxes: 43.6%
Here:
44%
State:
49%
(% for various income ranges: 43.1% for AGIs below $25k, 43.1% for AGIs $25k-50k, 44.8% for AGIs $50k-75k, 46.1% for AGIs $75k-100k, 45.7% for AGIs $100k-200k, 66.7% for AGIs over 200k)
Averages for the 2004 tax year for zip code 80916, filed in 2005:
Average Adjusted Gross Income (AGI) in 2004: $31,254 (Individual Income Tax Returns)
Here:
$31,254
State:
$55,014
Salary/wage: $29,816 (reported on 93.0% of returns)
Here:
$29,816
State:
$46,010
(% of AGI for various income ranges: 98.8% for AGIs below $10k, 89.1% for AGIs $10k-25k, 90.8% for AGIs $25k-50k, 88.3% for AGIs $50k-75k, 87.2% for AGIs $75k-100k, 74.2% for AGIs over 100k)
Taxable interest for individuals: $463 (reported on 23.4% of returns)
This zip code:
$463
Colorado:
$2,127
(% of AGI for various income ranges: 1.3% for AGIs below $10k, 0.4% for AGIs $10k-25k, 0.2% for AGIs $25k-50k, 0.3% for AGIs $50k-75k, 0.4% for AGIs $75k-100k, 0.4% for AGIs over 100k)
Taxable dividends: $737 (reported on 8.3% of returns)
Here:
$737
State:
$3,782
(% of AGI for various income ranges: 0.7% for AGIs below $10k, 0.2% for AGIs $10k-25k, 0.1% for AGIs $25k-50k, 0.1% for AGIs $50k-75k, 0.2% for AGIs $75k-100k, 0.9% for AGIs over 100k)
Net capital gain/loss: +$1,966 (reported on 6.2% of returns)
Here:
+$1,966
State:
+$17,882
(% of AGI for various income ranges: -0.3% for AGIs below $10k, -0.0% for AGIs $10k-25k, 0.2% for AGIs $25k-50k, 0.2% for AGIs $50k-75k, 0.8% for AGIs $75k-100k, 3.3% for AGIs over 100k)
Profit/loss from business: +$4,943 (reported on 10.5% of returns)
Here:
+$4,943
State:
+$11,247
(% of AGI for various income ranges: 5.1% for AGIs below $10k, 3.4% for AGIs $10k-25k, 1.4% for AGIs $25k-50k, 1.2% for AGIs $50k-75k, 0.7% for AGIs $75k-100k, 0.6% for AGIs over 100k)
IRA payment deduction: $1,947 (reported on 1.9% of returns)
80916:
$1,947
Colorado:
$2,947
(% of AGI for various income ranges: 0.1% for AGIs $10k-25k, 0.1% for AGIs $25k-50k, 0.1% for AGIs $50k-75k, 0.2% for AGIs $75k-100k)
Self-employed pension: $2,909 (reported on 0.1% of returns)
Here:
$2,909
Colorado:
$13,653
Total itemized deductions: $13,820 (27% of AGI, reported on 26.5% of returns)
Here:
$13,820
State:
$20,560
Here:
27.5% of AGI
State:
21.4% of AGI
(% of AGI for various income ranges: 7.6% for AGIs below $10k, 6.3% for AGIs $10k-25k, 11.3% for AGIs $25k-50k, 14.3% for AGIs $50k-75k, 14.4% for AGIs $75k-100k, 16.2% for AGIs over 100k)
Charity contributions deductions: $1,956 (4% of AGI, reported on 20.9% of returns)
Here:
$1,956
State:
$3,518
Here:
3.7% of AGI
State:
3.4% of AGI
(% of AGI for various income ranges: 0.4% for AGIs below $10k, 0.6% for AGIs $10k-25k, 1.2% for AGIs $25k-50k, 1.7% for AGIs $50k-75k, 2.1% for AGIs $75k-100k, 1.9% for AGIs over 100k)
Total tax: $3,052 (reported on 66.6% of returns)
80916:
$3,052
State:
$9,173
(% of AGI for various income ranges: 1.9% for AGIs below $10k, 3.3% for AGIs $10k-25k, 5.3% for AGIs $25k-50k, 7.7% for AGIs $50k-75k, 10.0% for AGIs $75k-100k, 13.8% for AGIs over 100k)
Earned income credit: $1,821 (reported on 26.3% of returns)
Here:
$1,821
State:
$1,595
Percentage of individuals using paid preparers for their 2004 taxes: 57.1%
Here:
57%
State:
55%
(% for various income ranges: 51.9% for AGIs below $10k, 62.9% for AGIs $10k-25k, 56.5% for AGIs $25k-50k, 54.6% for AGIs $50k-75k, 48.6% for AGIs $75k-100k, 53.5% for AGIs over 100k)
Likely homosexual households (counted as self-reported same-sex unmarried-partner households)
Lesbian couples: 0.1% of all households
Gay men: 0.0% of all households
Household received Food Stamps/SNAP in the past 12 months: 3,113 Household did not receive Food Stamps/SNAP in the past 12 months: 12,074
Women who had a birth in the past 12 months: 821 (539 now married, 265 unmarried) Women who did not have a birth in the past 12 months: 10,203 (4,756 now married, 5,440 unmarried)
Housing units in zip code 80916 with a mortgage: 5,628 (555 second mortgage, 18 home equity loan, 254 both second mortgage and home equity loan) Houses without a mortgage: 114
Median monthly owner costs for units with a mortgage: $1,521 Median monthly owner costs for units without a mortgage: $581
Residents with income below the poverty level in 2022:
This zip code:
19.3%
Whole state:
9.4%
Residents with income below 50% of the poverty level in 2022:
This zip code:
10.2%
Whole state:
4.6%
Median number of rooms in houses and condos:
Here:
6.0
State:
6.8
Median number of rooms in apartments:
Here:
4.3
State:
4.0
Notable locations in this zip code not listed on our city pages
Notable locations in zip code 80916: Pikes Peak Speedway (A), Colorado Springs Fire Department Station 11 (B), Sand Creek Library (C). Display/hide their locations on the map
6,423 married couples with children.
3,881 single-parent households (1,139 men, 2,742 women).
71.2% of residents of 80916 zip code speak English at home.
22.7% of residents speak Spanish at home (68% very well, 17% well, 9% not well, 5% not at all).
1.7% of residents speak other Indo-European language at home (82% very well, 9% well, 9% not well).
2.6% of residents speak Asian or Pacific Island language at home (57% very well, 31% well, 11% not well, 1% not at all).
0.9% of residents speak other language at home (58% very well, 42% well).
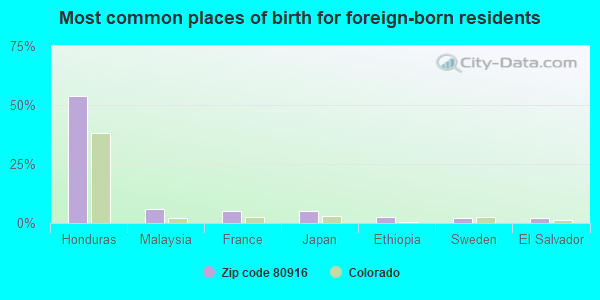
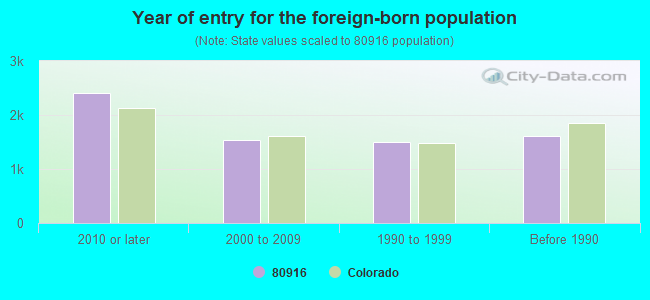
Foreign born population: 5,349 (13.3%) (43.0% of them are naturalized citizens)
Major facilities with environmental interests located in this zip code:
AMI AIRCRAFT SEATING SYSTEMS (1275 NORTH NEWPORT ROAD in COLORADO SPRINGS, CO)
AIR MINOR (AIRS/AFS) STATE MASTER (Colorado database) - RCRAINFO-COD983777731, LQG COMPLIANCE ACTIVITY (Tracking inspections of insecticide, fungicide, and rodenticide, and toxic substances) CRITERIA AND HAZARDOUS AIR POLLUTANT INVENTORY (Inventory of air pollution sources) HAZARDOUS WASTE BIENNIAL REPORTER (Resource Conservation and Recovery Act (tracking hazardous waste)) Large Quantity Generators, more that 1000 kg of hazardous waste/month (Resource Conservation and Recovery Act (tracking hazardous waste)) - notification TRI REPORTER (Tracking of toxic chemicals releasing facilities) Business SIC classification: PUBLIC BUILDING AND RELATED FURNITURE; AIRCRAFT PARTS AND AUXILIARY EQUIPMENT Business NAICS classification: ELECTROPLATING, PLATING, POLISHING, ANODIZING, AND COLORING.; OTHER AIRCRAFT PARTS AND AUXILIARY EQUIPMENT MANUFACTURING. Organizations: GOODRICH CORP-AIRCRAFT INTERIOR (CONTACT/OPERATOR)
, GOODRICH CORPORATION (CONTACT/OWNER)
Alternative names: AIRCRAFT SEATING PRODS., AMI INDUSTRIES, INC., GOODRICH CORP-AIRCRAFT INTERIOR PRODUCTS, GOODRICH CORP, AIRCRAFT SEATING PRO, GOODRICH AIRCRAFT INTERIOR PRODUCTS
BOYD LIGHTING COMPANY (1455 VAPOR TRL in COLORADO SPRINGS, CO)
AIR MINOR (AIRS/AFS) STATE MASTER (Colorado database) - RCRAINFO-COD982592974, SQG CRITERIA AND HAZARDOUS AIR POLLUTANT INVENTORY (Inventory of air pollution sources) Small Quantity Generators, between 100 kg and 1000 kg of hazardous waste/month (Resource Conservation and Recovery Act (tracking hazardous waste)) - notification Business SIC classification: RESIDENTIAL ELECTRIC LIGHTING FIXTURES; COMMERCIAL, INDUSTRIAL, AND INSTITUTIONAL ELECTRIC LIGHTING FIXTURES Business NAICS classification: ORNAMENTAL AND ARCHITECTURAL METAL WORK MANUFACTURING.; RESIDENTIAL ELECTRIC LIGHTING FIXTURE MANUFACTURING. Organizations: DOROTHY SWEET (CONTACT/OWNER)
BP AMOCO OIL (2250 SOUTH ACADEMY BOULEVARD in COLORADO SPRINGS, CO)
AIR MINOR (AIRS/AFS) STATE MASTER (Colorado database) - RCRAINFO-COD983787706, SQG, RCRAINFO-COD983787896, RCRAINFO-COD983788043, CRITERIA AND HAZARDOUS AIR POLLUTANT INVENTORY (Inventory of air pollution sources) (Resource Conservation and Recovery Act (tracking hazardous waste)) Business SIC classification: GASOLINE SERVICE STATIONS Organizations: AMOCO OIL CO (CONTACT/OWNER)
Alternative names: AMOCO GAS STA NO 3601, SOUTH ACADEMY AMOCO
INTERNATIONAL WOODWORK CORPORATION (1440 NORTH NEWPORT ROAD in COLORADO SPRINGS, CO)
AIR MINOR (AIRS/AFS) STATE MASTER (Colorado database) - RCRAINFO-COR000016105, SQG CRITERIA AND HAZARDOUS AIR POLLUTANT INVENTORY (Inventory of air pollution sources) Small Quantity Generators, between 100 kg and 1000 kg of hazardous waste/month (Resource Conservation and Recovery Act (tracking hazardous waste)) - notification Business SIC classification: MILLWORK Organizations: DOUGLAS B NOECKER (CONTACT/OWNER)
Alternative names: INTERNATIONAL WOODWORKING CORP
IMAGE-DRYCLEANERS (3035 JETWING DR in COLORADO SPRINGS, CO)
STATE MASTER (Colorado database) - RCRAINFO-COD981540859, SQG (Resource Conservation and Recovery Act (tracking hazardous waste)) Organizations: LEONARD R. GUZMAN (CONTACT/OWNER)
AMERTECH SPRAY FINISHING (2504 ZEPPELIN RD in COLORADO SPRINGS, CO)
AIR MAJOR (AIRS/AFS) STATE MASTER (Colorado database) - APCDSSP-CO0410686, AIR MAJOR CRITERIA AND HAZARDOUS AIR POLLUTANT INVENTORY (Inventory of air pollution sources) Business SIC classification: COATING, ENGRAVING, AND ALLIED SERVICES Alternative names: WESTERN SPRAY PAINTING INC
BRICKER ELEMENTARY SCHOOL (4880 DOVER PLACE in COLORADO SPRINGS, CO)
(Geographic Names Information System) (National Center for Education Statistics) - STATE ID-1000 Organizations: HARRISON 2 (SCHOOL DISTRICT)
GIBERSON ELEMENTARY SCHOOL (2880 FERBER DRIVE in COLORADO SPRINGS, CO)
(National Center for Education Statistics) - STATE ID-3392 Organizations: HARRISON 2 (SCHOOL DISTRICT)
ALAMO RENT-A-CAR, INC. (110 AVIATION WAY in COLORADO SPRINGS, CO)
AIR MINOR (AIRS/AFS) (Resource Conservation and Recovery Act (tracking hazardous waste)) Business SIC classification: PASSENGER CAR RENTAL
DANIEL'S TEXACO.CN (485 N MURRAY BLVD in COLORADO SPRINGS, CO)
AIR MINOR (AIRS/AFS) CRITERIA AND HAZARDOUS AIR POLLUTANT INVENTORY (Inventory of air pollution sources) Business SIC classification: GASOLINE SERVICE STATIONS
AAMCO TRANSMISSION (1716 MT WASHINGTON AVE in COLORADO SPRINGS, CO)
(Resource Conservation and Recovery Act (tracking hazardous waste))
ACACG PHASE 1A-1B (6794 SOUTH POWERS in COLORADO SPRINGS, CO)
National Pollutant Discharge Elimination System NON-MAJOR (Tracking pollutant discharge elimination systems) - permit Business SIC classification: GENERAL CONTRACTORS-RESIDENTIAL BUILDINGS, OTHER THAN SINGLE-FAMILY
AMR SERVICES (1340 AVIATION WAY in WRAY, CO)
AIR MINOR (AIRS/AFS) Business SIC classification: TOP, BODY, AND UPHOLSTERY REPAIR SHOPS AND PAINT SHOPS
Housing units lacking complete plumbing facilities: 1.0% Housing units lacking complete kitchen facilities: 0.9%
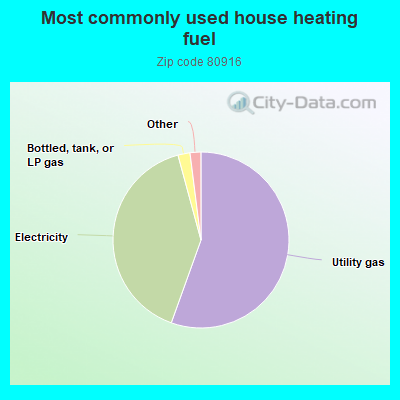
55.5%Utility gas
40.3%Electricity
2.2%Bottled, tank, or LP gas
0.8%Wood
0.6%Other fuel
Population in 1990: 26,402. Population change in the 1990s: +7,410 (+28.1%).
Place of birth for U.S.-born residents:
This state: 14,601
Northeast: 2,381
Midwest: 4,211
South: 6,379
West: 5,719
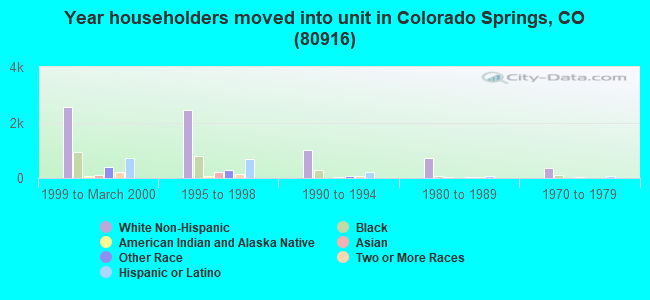
33% of the 80916 zip code residents lived in the same house 5 years ago. Out of people who lived in different houses, 49% lived in this county. Out of people who lived in different counties, 50% lived in Colorado.
83% of the 80916 zip code residents lived in the same house 1 year ago. Out of people who lived in different houses, 47% moved from this county. Out of people who lived in different houses, 10% moved from different county within same state. Out of people who lived in different houses, 35% moved from different state. Out of people who lived in different houses, 5% moved from abroad.
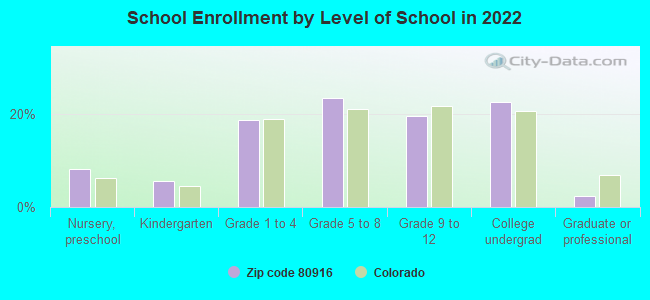
Private vs. public school enrollment:
Students in private schools in grades 1 to 8 (elementary and middle school): 325
Here:
6.6%
Colorado:
11.4%
Students in private schools in grades 9 to 12 (high school): 376
Here:
16.3%
Colorado:
8.5%
Students in private undergraduate colleges: 286
Here:
10.8%
Colorado:
14.0%
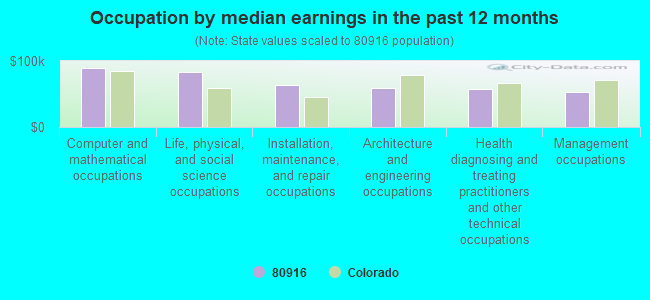
Occupation by median earnings in the past 12 months ($)
90,045Computer and mathematical occupations
83,998Life, physical, and social science occupations
63,070Installation, maintenance, and repair occupations
58,588Architecture and engineering occupations
57,123Health diagnosing and treating practitioners and other technical occupations
52,947Management occupations
Companies with biggest federal contracts located in this zip code (COLORADO SPRIN, CO):
ITT INDUSTRIES, INC (4410 E FOUNTAIN BLVD) : $1,193,402,194 in 1118 contractsfrom 1999 to 2006
Contracts for Defense Missile and Space Systems -- Management and Support (R&D), Maintenance, Repair and Rebuilding of Equipment -- Miscellaneous, Logistics Support Services, Systems Engineering Services, and moreby Air Force, Army, Navy, Department of State, and others Signed by year:2000: $114,672,252; 2001: $196,431,377; 2002: $256,652,299; 2003: $85,341,610; 2004: $151,523,458; 2005: $196,562,532; 2006: $158,177,523.
Biggest contracts:
$59,834,788 with Air Force for Defense Missile and Space Systems -- Management and Support (R&D). Signed on 2002-03-07. Completion date: 2006-10-31.
$19,874,695 with Air Force for Defense Missile and Space Systems -- Management and Support (R&D). Taking place in FL. Signed on 2004-11-08. Completion date: 2006-10-31.
$16,541,793 with Air Force for Maintenance, Repair and Rebuilding of Equipment -- Miscellaneous. Taking place in CA. Signed on 2003-04-08. Completion date: 2003-09-30.
$16,429,445 with Air Force for Defense Missile and Space Systems -- Management and Support (R&D). Signed on 2000-11-03. Completion date: 2006-10-31.
NORTHROP GRUMMAN SPACE & MISSI (1555 NORTH NEWPORT ROAD) : $588,376,038 in 1144 contractsfrom 2001 to 2006
Contracts for Operation of Government-Owned Facilities -- Government-Owned Contractor-Operated (GOCO) R&D Facilities, Invalid code: AC67, Optical Instruments, Test Equipment, Components and Accessories, Defense Missile and Space Systems -- Operational Systems Development (R&D), and moreby Department of Defense, Missile Defense Agency, Air Force Signed by year:2000: $0; 2001: $11,867,060; 2002: $116,599,294; 2003: $144,956,591; 2004: $145,551,492; 2005: $152,193,409; 2006: $17,208,192.
Biggest contracts:
$19,320,663 with Department of Defense for Operation of Government-Owned Facilities -- Government-Owned Contractor-Operated (GOCO) R&D Facilities. Signed on 2005-02-02. Completion date: 2005-01-31.
$14,474,342 with Missile Defense Agency for Operation of Government-Owned Facilities -- Government-Owned Contractor-Operated (GOCO) R&D Facilities. Signed on 2004-02-02. Completion date: 2005-01-31.
$11,310,024 with Department of Defense for Operation of Government-Owned Facilities -- Government-Owned Contractor-Operated (GOCO) R&D Facilities. Signed on 2005-03-30. Completion date: 2003-03-31.
$10,019,525, same as above.Signed on 2005-02-02. Completion date: 2003-04-30.
ITT SYSTEMS & SCIENCES CORPORA (4410 E FOUNTAIN BLVD) : $190,746,049 in 648 contractsfrom 1999 to 2006
Contracts for Other Research and Development -- Applied Research and Exploratory Development (R&D), Other ADP and Telecommunications Services (includes data storage on tapes, compact disks, etc.), Nuclear Warheads and Warhead Sections, Guided Missile Systems, Complete, and moreby Air Force, Navy, Defense Logistics Agency, Department of Defense, and others Signed by year:2000: $55,237,334; 2001: $25,364,052; 2002: $22,195,339; 2003: $10,047,465; 2004: $15,340,467; 2005: $10,299,759; 2006: $28,771,890.
Biggest contracts:
$21,336,537 with Air Force for Other Research and Development -- Applied Research and Exploratory Development (R&D). Taking place in VA. Signed on 2006-06-22. Completion date: 2007-06-21.
$10,340,000 with Air Force for Other ADP and Telecommunications Services (includes data storage on tapes, compact disks, etc.). Signed on 2000-07-13. Completion date: 2000-12-07.
$6,199,296, same as above.Signed on 1999-12-20. Completion date: 2000-03-31.
$5,475,946, same as above.Signed on 1999-10-01. Completion date: 2000-03-31.
LOCKHEED MARTIN CORPORATION (1670 N NEWPORT RD) : $182,179,481 in 107 contractsfrom 1999 to 2006
Contracts for Miscellaneous Communication Equipment, ADPE System Configuration, Electrical and Electronic assemblies, Boards, Cards, and Associated Hardware, Defense Electronics and Communication Equipment -- Operational Systems Development (R&D), and moreby Air Force, Defense Logistics Agency, Army Signed by year:2000: $62,970,091; 2001: $42,406,353; 2002: $0; 2003: $0; 2004: $10,623,638; 2005: $33,529,857; 2006: $25,572,221.
Biggest contracts:
$8,012,141 with Air Force for Miscellaneous Communication Equipment. Signed on 2006-06-30. Completion date: 2007-02-15.
$6,616,845, same as above.Signed on 2005-12-19. Completion date: 2006-11-30.
$6,272,112 with Air Force for ADPE System Configuration. Signed on 2001-04-11. Completion date: 2001-09-30.
$6,000,000, same as above.Signed on 2000-06-22. Completion date: 2001-09-30.
ITT INDUSTRIES, INC SYSTEM DI (4450 FOUNTAIN BLVD) : $90,887,496 in 43 contractsfrom 2002 to 2004
Contracts for Maintenance, Repair and Rebuilding of Equipment -- Miscellaneous, Defense Missile and Space Systems -- Applied Research and Exploratory Development (R&D), Electrical and Electronic assemblies, Boards, Cards, and Associated Hardware by Air Force Signed by year:2000: $0; 2001: $0; 2002: $5,242,791; 2003: $52,076,743; 2004: $33,567,962; 2005: $0; 2006: $0.
Biggest contracts:
$12,484,375 with Air Force for Maintenance, Repair and Rebuilding of Equipment -- Miscellaneous. Signed on 2004-01-30. Completion date: 2004-09-30.
$11,288,519, same as above.Signed on 2003-03-31. Completion date: 2003-06-30.
$9,328,039, same as above.Signed on 2003-10-28. Completion date: 2004-09-30.
$8,002,679, same as above.Signed on 2003-01-30. Completion date: 2003-06-30.
ITT FEDERAL SERVICES INTERNATI (4410 E FOUNTAIN BLVD) : $88,428,648 in 31 contractsfrom 2002 to 2006
Contracts for Services -- Basic Research (R&D), Logistics Support Services, Other Management Support Services, Miscellaneous Electrical and Electronic Components by Army Signed by year:2000: $0; 2001: $0; 2002: $16,763,689; 2003: $71,389,272; 2004: $6,212; 2005: $0; 2006: $269,475.
Biggest contracts:
$41,707,225 with Army for Services -- Basic Research (R&D). Signed on 2003-01-07. Completion date: 2003-11-30.
$12,789,644, same as above.Signed on 2003-03-17. Completion date: 2003-09-27.
$5,859,962, same as above.Signed on 2003-04-10. Completion date: 2000-11-30.
$4,398,310, same as above.Signed on 2002-12-12. Completion date: 2003-11-30.
LOCKHEED MARTIN SERVICES INC (1670 N NEWPORT ROAD) : $73,084,237 in 190 contractsfrom 1999 to 2006
Contracts for Other ADP and Telecommunications Services (includes data storage on tapes, compact disks, etc.), Maintenance, Repair and Rebuilding of Equipment -- Communication, Detection, and Coherent Radiation Equipment, ADP Telecommunications and Transmission Services, Defense Electronics and Communication Equipment -- Advanced Development (R&D), and moreby Army, Air Force, Navy, Department of Defense, and others Signed by year:2000: $12,342,167; 2001: $11,995,259; 2002: $30,706,087; 2003: $14,853,930; 2004: $2,362,785; 2005: $513,508; 2006: $85,478.
Biggest contracts:
$11,348,519 with Army for Other ADP and Telecommunications Services (includes data storage on tapes, compact disks, etc.). Taking place in VA. Signed on 2002-11-18. Completion date: 2003-09-30.
$8,705,346 with Army for Maintenance, Repair and Rebuilding of Equipment -- Communication, Detection, and Coherent Radiation Equipment. Taking place in VA. Signed on 2000-09-13. Completion date: 2001-09-30.
$6,868,416 with Air Force for ADP Telecommunications and Transmission Services. Taking place in CA. Signed on 2003-10-15. Completion date: 2004-09-30.
$6,638,280, same as above.Signed on 2002-10-01. Completion date: 2003-09-30.
LOCKHEED MARTIN CORPORATION (1670 N NEWPORT RD STE 400) : $52,620,761 in 19 contractsfrom 2001 to 2002
Contracts for ADPE System Configuration by Air Force Signed by year:2000: $0; 2001: $14,555,992; 2002: $38,064,769; 2003: $0; 2004: $0; 2005: $0; 2006: $0.
Biggest contracts:
$5,712,471 with Air Force for ADPE System Configuration. Signed on 2002-02-06. Completion date: 2002-12-11.
$5,137,720, same as above.Signed on 2002-03-14. Completion date: 2002-12-11.
$5,073,226, same as above.Signed on 2002-03-04. Completion date: 2002-12-11.
$4,874,071, same as above.Signed on 2002-01-08. Completion date: 2002-12-11.
SY TECHNOLOGY, DIVISION OF L-3 (440 NORTH WOOTEN ROAD; small business) : $47,829,073 in 166 contractsfrom 2001 to 2004
Contracts for Technical Assistance by Air Force Signed by year:2000: $0; 2001: $4,489,653; 2002: $10,454,345; 2003: $20,065,320; 2004: $12,819,755; 2005: $0; 2006: $0.
Biggest contracts:
$1,995,660 with Air Force for Technical Assistance. Signed on 2004-09-16. Completion date: 2005-09-29.
$1,434,217, same as above.Signed on 2003-10-06. Completion date: 2004-09-30.
$1,289,396, same as above.Signed on 2004-09-24. Completion date: 2005-09-29.
$1,241,000, same as above.Signed on 2001-11-01. Completion date: 2002-10-31.
A M I INDUSTRIES, INC (1275 N NEWPORT RD) : $12,582,110 in 90 contractsfrom 2000 to 2006
Contracts for Miscellaneous Aircraft Accessories and Components, Guided Missile Remote Control Systems, Defense Missile and Space Systems -- Advanced Development (R&D), Cartridge and Propellant Actuated Devices and Components, and moreby Air Force, Defense Logistics Agency, Navy, Federal Supply Service, and others Signed by year:2000: $196,652; 2001: $542,878; 2002: $697,550; 2003: $2,836,087; 2004: $144,802; 2005: $675,481; 2006: $7,488,660.
Biggest contracts:
$7,076,021 with Air Force for Miscellaneous Aircraft Accessories and Components. Signed on 2006-05-08. Completion date: 2008-04-30.
$2,761,935 with Air Force for Guided Missile Remote Control Systems. Signed on 2003-06-27. Completion date: 2004-08-30.
$220,800 with Defense Logistics Agency for Miscellaneous Aircraft Accessories and Components. Signed on 2001-01-26. Completion date: 2001-11-09.
$180,850, same as above.Signed on 2005-05-12. Completion date: 2005-12-01.
Top industries in this zip code by the number of employees in 2005:
Professional, Scientific, and Technical Services: Research and Development in the Physical, Engineering, and Life Sciences (100-249: 1, 10-19: 1, 5-9: 1, 1-4: 1)
Professional, Scientific, and Technical Services: Administrative Management and General Management Consulting Services (100-249: 1, 1-4: 1)
People in group quarters in 2000:
359 people in military barracks, etc.
Fatal accident statistics in 2014:
Fatal accident count: 3
Vehicles involved in fatal accidents: 3
Fatal accidents caused by drunken drivers: 1
Fatalities: 3
Persons involved in fatal accidents: 6
Pedestrians involved in fatal accidents: 3
Fatal accident statistics in 2013:
Fatal accident count: 5
Vehicles involved in fatal accidents: 7
Fatal accidents caused by drunken drivers: 4
Fatalities: 5
Persons involved in fatal accidents: 7
Pedestrians involved in fatal accidents: 0
Home Mortgage Disclosure Act Aggregated Statistics For Year 2009 (Based on 10 full and 6 partial tracts)
A) FHA, FSA/RHS & VA Home Purchase Loans
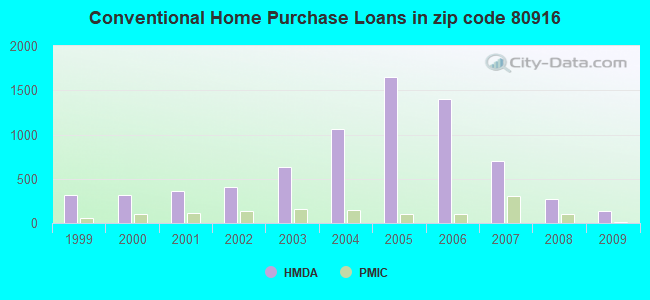
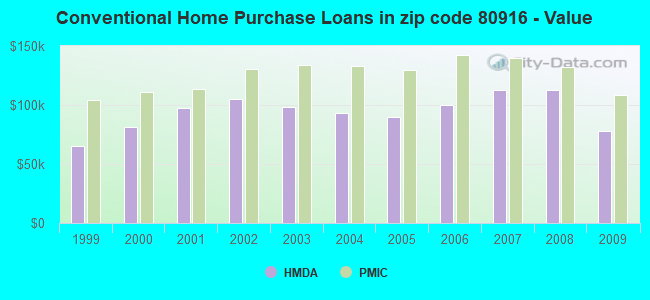
B) Conventional Home Purchase Loans
C) Refinancings
D) Home Improvement Loans
E) Loans on Dwellings For 5+ Families
F) Non-occupant Loans on < 5 Family Dwellings (A B C & D)
G) Loans On Manufactured Home Dwelling (A B C & D)
Number
Average Value
Number
Average Value
Number
Average Value
Number
Average Value
Number
Average Value
Number
Average Value
Number
Average Value
LOANS ORIGINATED
597
$137,498
137
$78,312
933
$150,287
33
$37,913
2
$1,248,910
130
$86,963
10
$32,317
APPLICATIONS APPROVED, NOT ACCEPTED
36
$145,631
13
$82,208
116
$149,782
12
$22,178
0
$0
9
$69,282
2
$24,610
APPLICATIONS DENIED
61
$132,582
40
$62,395
356
$131,893
89
$13,426
0
$0
38
$64,027
15
$39,885
APPLICATIONS WITHDRAWN
67
$145,671
30
$105,479
229
$153,389
20
$59,451
0
$0
27
$93,678
2
$187,570
FILES CLOSED FOR INCOMPLETENESS
5
$133,582
4
$50,105
42
$157,955
0
$0
0
$0
4
$50,105
0
$0
Aggregated Statistics For Year 2008 (Based on 10 full and 6 partial tracts)
A) FHA, FSA/RHS & VA Home Purchase Loans
B) Conventional Home Purchase Loans
C) Refinancings
D) Home Improvement Loans
E) Loans on Dwellings For 5+ Families
F) Non-occupant Loans on < 5 Family Dwellings (A B C & D)
G) Loans On Manufactured Home Dwelling (A B C & D)
Number
Average Value
Number
Average Value
Number
Average Value
Number
Average Value
Number
Average Value
Number
Average Value
Number
Average Value
LOANS ORIGINATED
461
$149,143
267
$113,121
605
$140,804
75
$27,084
5
$677,630
178
$103,471
7
$36,564
APPLICATIONS APPROVED, NOT ACCEPTED
39
$154,950
28
$79,022
109
$145,955
9
$15,120
0
$0
19
$124,269
3
$33,163
APPLICATIONS DENIED
87
$149,846
99
$90,988
627
$141,519
177
$30,416
0
$0
90
$107,812
40
$45,454
APPLICATIONS WITHDRAWN
48
$148,631
44
$106,613
237
$145,681
17
$62,753
0
$0
47
$107,688
3
$26,717
FILES CLOSED FOR INCOMPLETENESS
3
$134,440
7
$129,776
50
$139,203
2
$114,010
0
$0
4
$125,818
0
$0
Aggregated Statistics For Year 2007 (Based on 10 full and 6 partial tracts)
A) FHA, FSA/RHS & VA Home Purchase Loans
B) Conventional Home Purchase Loans
C) Refinancings
D) Home Improvement Loans
E) Loans on Dwellings For 5+ Families
F) Non-occupant Loans on < 5 Family Dwellings (A B C & D)
G) Loans On Manufactured Home Dwelling (A B C & D)
Number
Average Value
Number
Average Value
Number
Average Value
Number
Average Value
Number
Average Value
Number
Average Value
Number
Average Value
LOANS ORIGINATED
361
$156,564
696
$112,721
827
$127,850
160
$37,358
2
$441,950
292
$111,393
17
$23,255
APPLICATIONS APPROVED, NOT ACCEPTED
19
$166,864
88
$113,309
180
$114,709
37
$41,634
0
$0
62
$121,706
8
$23,879
APPLICATIONS DENIED
99
$155,992
273
$122,255
967
$140,210
211
$43,303
0
$0
102
$132,837
40
$36,337
APPLICATIONS WITHDRAWN
55
$180,780
124
$112,996
469
$135,767
27
$98,718
0
$0
57
$105,790
2
$28,585
FILES CLOSED FOR INCOMPLETENESS
3
$161,647
27
$109,855
112
$144,935
7
$93,914
0
$0
15
$126,223
0
$0
Aggregated Statistics For Year 2006 (Based on 10 full and 6 partial tracts)
A) FHA, FSA/RHS & VA Home Purchase Loans
B) Conventional Home Purchase Loans
C) Refinancings
D) Home Improvement Loans
E) Loans on Dwellings For 5+ Families
F) Non-occupant Loans on < 5 Family Dwellings (A B C & D)
G) Loans On Manufactured Home Dwelling (A B C & D)
Number
Average Value
Number
Average Value
Number
Average Value
Number
Average Value
Number
Average Value
Number
Average Value
Number
Average Value
LOANS ORIGINATED
424
$165,846
1,396
$100,331
1,287
$108,624
188
$31,219
7
$421,411
495
$104,841
7
$34,996
APPLICATIONS APPROVED, NOT ACCEPTED
22
$155,800
227
$99,193
353
$111,854
65
$35,671
0
$0
115
$109,440
14
$30,909
APPLICATIONS DENIED
54
$162,562
558
$101,532
1,346
$128,046
264
$40,963
0
$0
152
$121,406
53
$36,274
APPLICATIONS WITHDRAWN
63
$163,356
318
$110,486
815
$127,434
45
$61,450
0
$0
125
$101,179
0
$0
FILES CLOSED FOR INCOMPLETENESS
3
$147,503
108
$96,122
128
$133,429
2
$41,620
0
$0
34
$97,672
0
$0
Aggregated Statistics For Year 2005 (Based on 10 full and 6 partial tracts)
A) FHA, FSA/RHS & VA Home Purchase Loans
B) Conventional Home Purchase Loans
C) Refinancings
D) Home Improvement Loans
E) Loans on Dwellings For 5+ Families
F) Non-occupant Loans on < 5 Family Dwellings (A B C & D)
G) Loans On Manufactured Home Dwelling (A B C & D)
Number
Average Value
Number
Average Value
Number
Average Value
Number
Average Value
Number
Average Value
Number
Average Value
Number
Average Value
LOANS ORIGINATED
473
$168,038
1,655
$90,128
1,548
$110,496
134
$46,801
3
$823,720
436
$99,181
23
$40,561
APPLICATIONS APPROVED, NOT ACCEPTED
16
$137,453
251
$92,810
295
$108,931
43
$48,325
0
$0
83
$119,890
29
$33,499
APPLICATIONS DENIED
51
$146,905
605
$95,013
1,459
$120,219
302
$28,486
0
$0
158
$90,932
110
$73,745
APPLICATIONS WITHDRAWN
60
$157,257
401
$103,801
965
$127,247
71
$75,369
0
$0
121
$101,117
12
$26,587
FILES CLOSED FOR INCOMPLETENESS
0
$0
65
$79,184
185
$125,585
11
$34,120
0
$0
21
$93,021
0
$0
Aggregated Statistics For Year 2004 (Based on 10 full and 6 partial tracts)
A) FHA, FSA/RHS & VA Home Purchase Loans
B) Conventional Home Purchase Loans
C) Refinancings
D) Home Improvement Loans
E) Loans on Dwellings For 5+ Families
F) Non-occupant Loans on < 5 Family Dwellings (A B C & D)
G) Loans On Manufactured Home Dwelling (A B C & D)
Number
Average Value
Number
Average Value
Number
Average Value
Number
Average Value
Number
Average Value
Number
Average Value
Number
Average Value
LOANS ORIGINATED
485
$147,033
1,067
$92,880
1,625
$113,149
129
$34,326
2
$2,174,810
313
$100,741
41
$36,435
APPLICATIONS APPROVED, NOT ACCEPTED
14
$156,856
191
$90,616
360
$109,551
29
$35,145
0
$0
43
$87,211
30
$34,572
APPLICATIONS DENIED
77
$145,343
398
$85,092
1,296
$114,985
236
$23,820
0
$0
137
$93,642
94
$36,042
APPLICATIONS WITHDRAWN
39
$143,261
189
$101,818
720
$123,858
41
$54,104
0
$0
67
$116,787
5
$99,768
FILES CLOSED FOR INCOMPLETENESS
8
$99,194
33
$100,428
225
$126,291
6
$44,942
0
$0
23
$111,798
0
$0
Aggregated Statistics For Year 2003 (Based on 10 full and 6 partial tracts)
A) FHA, FSA/RHS & VA Home Purchase Loans
B) Conventional Home Purchase Loans
C) Refinancings
D) Home Improvement Loans
E) Loans on Dwellings For 5+ Families
F) Non-occupant Loans on < 5 Family Dwellings (A B C & D)
Number
Average Value
Number
Average Value
Number
Average Value
Number
Average Value
Number
Average Value
Number
Average Value
LOANS ORIGINATED
634
$145,915
629
$97,981
2,890
$113,249
109
$20,671
1
$3,478,440
386
$98,709
APPLICATIONS APPROVED, NOT ACCEPTED
24
$154,927
87
$96,154
442
$116,342
16
$19,191
0
$0
45
$120,253
APPLICATIONS DENIED
59
$138,695
248
$73,071
1,246
$106,167
197
$23,514
0
$0
119
$91,718
APPLICATIONS WITHDRAWN
73
$143,522
111
$108,869
886
$114,774
35
$19,023
0
$0
65
$87,703
FILES CLOSED FOR INCOMPLETENESS
10
$147,737
26
$105,173
138
$113,685
8
$25,980
0
$0
9
$97,180
Aggregated Statistics For Year 2002 (Based on 7 full and 6 partial tracts)
A) FHA, FSA/RHS & VA Home Purchase Loans
B) Conventional Home Purchase Loans
C) Refinancings
D) Home Improvement Loans
E) Loans on Dwellings For 5+ Families
F) Non-occupant Loans on < 5 Family Dwellings (A B C & D)
Number
Average Value
Number
Average Value
Number
Average Value
Number
Average Value
Number
Average Value
Number
Average Value
LOANS ORIGINATED
605
$132,673
404
$104,710
1,358
$108,416
152
$24,271
2
$5,512,080
236
$102,448
APPLICATIONS APPROVED, NOT ACCEPTED
25
$139,917
71
$96,308
282
$103,173
15
$20,785
0
$0
25
$77,480
APPLICATIONS DENIED
30
$136,869
150
$58,883
658
$98,252
214
$20,975
4
$7,063,995
35
$94,801
APPLICATIONS WITHDRAWN
54
$139,298
49
$117,749
496
$113,904
42
$27,251
0
$0
21
$89,379
FILES CLOSED FOR INCOMPLETENESS
11
$131,110
11
$98,706
138
$109,777
0
$0
0
$0
3
$84,917
Aggregated Statistics For Year 2001 (Based on 7 full and 6 partial tracts)
A) FHA, FSA/RHS & VA Home Purchase Loans
B) Conventional Home Purchase Loans
C) Refinancings
D) Home Improvement Loans
E) Loans on Dwellings For 5+ Families
F) Non-occupant Loans on < 5 Family Dwellings (A B C & D)
Number
Average Value
Number
Average Value
Number
Average Value
Number
Average Value
Number
Average Value
Number
Average Value
LOANS ORIGINATED
595
$128,405
362
$97,601
1,219
$102,306
208
$21,728
3
$2,017,720
147
$85,526
APPLICATIONS APPROVED, NOT ACCEPTED
15
$124,001
76
$63,436
206
$97,347
20
$33,820
0
$0
18
$76,344
APPLICATIONS DENIED
54
$137,973
293
$49,501
716
$82,636
176
$20,299
4
$8,111,405
33
$84,338
APPLICATIONS WITHDRAWN
48
$130,733
63
$109,581
419
$102,458
30
$25,802
2
$2,460,750
36
$84,991
FILES CLOSED FOR INCOMPLETENESS
9
$150,074
8
$102,499
80
$99,041
0
$0
0
$0
4
$185,048
Aggregated Statistics For Year 2000 (Based on 7 full and 6 partial tracts)
A) FHA, FSA/RHS & VA Home Purchase Loans
B) Conventional Home Purchase Loans
C) Refinancings
D) Home Improvement Loans
E) Loans on Dwellings For 5+ Families
F) Non-occupant Loans on < 5 Family Dwellings (A B C & D)
Number
Average Value
Number
Average Value
Number
Average Value
Number
Average Value
Number
Average Value
Number
Average Value
LOANS ORIGINATED
619
$119,454
322
$81,735
347
$77,881
210
$23,856
3
$3,811,807
84
$85,565
APPLICATIONS APPROVED, NOT ACCEPTED
11
$101,602
54
$68,089
102
$69,147
75
$18,186
0
$0
5
$67,738
APPLICATIONS DENIED
49
$120,057
391
$49,706
437
$67,204
229
$20,353
0
$0
24
$67,225
APPLICATIONS WITHDRAWN
55
$121,147
56
$90,009
185
$74,224
34
$26,124
0
$0
5
$66,676
FILES CLOSED FOR INCOMPLETENESS
5
$94,392
9
$94,652
50
$96,639
5
$23,320
0
$0
5
$85,630
Aggregated Statistics For Year 1999 (Based on 5 full and 3 partial tracts)
A) FHA, FSA/RHS & VA Home Purchase Loans
B) Conventional Home Purchase Loans
C) Refinancings
D) Home Improvement Loans
F) Non-occupant Loans on < 5 Family Dwellings (A B C & D)
2002 - 2018 National Fire Incident Reporting System (NFIRS) incidents
Based on the data from the years 2002 - 2018 the average number of fire incidents per year is 37. The highest number of reported fire incidents - 67 took place in 2005, and the least - 12 in 2013. The data has a decreasing trend.
When looking into fire subcategories, the most incidents belonged to: Outside Fires (49.5%), and Mobile Property/Vehicle Fires (20.4%).
Fire incident types reported to NFIRS in Zip Code 80916


 Nearest zip codes: 80914, 80915, 80911, 80910, 80925, 80939.


 Based on the data from the years 2002 - 2018 the average number of fire incidents per year is 37. The highest number of reported fire incidents - 67 took place in 2005, and the least - 12 in 2013. The data has a decreasing trend.
 When looking into fire subcategories, the most incidents belonged to: Outside Fires (49.5%), and Mobile Property/Vehicle Fires (20.4%).