Estimated zip code population in 2022: 4,078 Zip code population in 2010: 3,976 Zip code population in 2000: 3,594
Houses and condos: 1,813 Renter-occupied apartments: 555
% of renters here:
36%
State:
38%
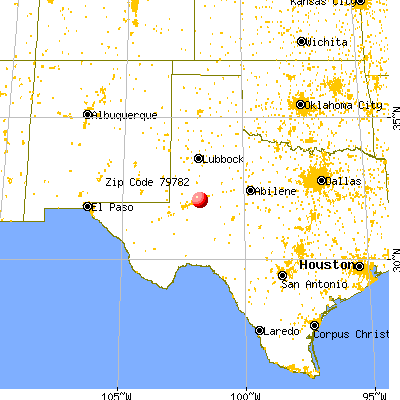
March 2022 cost of living index in zip code 79782: 78.8 (low, U.S. average is 100)
Land area: 461.4 sq. mi. Water area: 0.4 sq. mi.
Population density: 9 people per square mile
(very low).
OSM Map
General Map
Google Map
MSN Map
OSM Map
General Map
Google Map
MSN Map
OSM Map
General Map
Google Map
MSN Map
OSM Map
General Map
Google Map
MSN Map
Please wait while loading the map...
Real estate property taxes paid for housing units in 2022:
This zip code:
1.2% ($1,680)
Texas:
1.5% ($4,050)
Median real estate property taxes paid for housing units with mortgages in 2022: $2,223 (0.9%) Median real estate property taxes paid for housing units with no mortgage in 2022: $1,364 (1.1%)
Business Search- 14 Million verified businesses
Males: 2,284
(56.0%)
Females: 1,794
(44.0%)
For population 25 years and over in 79782:
High school or higher: 82.6%
Bachelor's degree or higher: 20.2%
Graduate or professional degree: 9.5%
Unemployed: 6.0%
Mean travel time to work (commute): 21.4 minutes
For population 15 years and over in 79782:
Never married: 18.9%
Now married: 66.5%
Separated: 0.3%
Widowed: 6.5%
Divorced: 7.8%
Zip code 79782 compared to state average:
Median house value below state average.
Black race population percentage significantly below state average.
Foreign-born population percentage below state average.
Length of stay since moving in above state average.
Percentage of population with a bachelor's degree or higher below state average.
Averages for the 2020 tax year for zip code 79782, filed in 2021:
Average Adjusted Gross Income (AGI) in 2020: $112,027 (Individual Income Tax Returns)
Here:
$112,027
State:
$77,054
Salary/wage: $63,642 (reported on 85.1% of returns)
Here:
$63,642
State:
$62,766
(% of AGI for various income ranges: 1173.3% for AGIs below $25k, 3573.1% for AGIs $25k-50k, 6648.5% for AGIs $50k-75k, 9686.2% for AGIs $75k-100k, 17355.2% for AGIs $100k-200k, 64043.3% for AGIs over 200k)
Taxable interest for individuals: $2,940 (reported on 19.8% of returns)
This zip code:
$2,940
Texas:
$2,665
(% of AGI for various income ranges: 7.2% for AGIs below $25k, 4.0% for AGIs $25k-50k, 10.0% for AGIs $50k-75k, 7.5% for AGIs $75k-100k, 41.7% for AGIs $100k-200k, 3323.3% for AGIs over 200k)
Ordinary dividends: $5,554 (reported on 11.9% of returns)
Here:
$5,554
State:
$10,044
(% of AGI for various income ranges: 6.0% for AGIs below $25k, 25.8% for AGIs $50k-75k, 94.8% for AGIs $100k-200k, 3406.7% for AGIs over 200k)
Net capital gain/loss in AGI: +$46,396 (reported on 11.4% of returns)
Here:
+$46,396
State:
+$39,590
(% of AGI for various income ranges: 28.8% for AGIs below $25k, 25.4% for AGIs $50k-75k, 62.6% for AGIs $100k-200k, 34456.7% for AGIs over 200k)
Profit/loss from business: +$12,110 (reported on 20.3% of returns)
Here:
+$12,110
State:
+$10,888
(% of AGI for various income ranges: 160.9% for AGIs below $25k, 89.4% for AGIs $25k-50k, 166.5% for AGIs $50k-75k, 45.6% for AGIs $75k-100k, 227.0% for AGIs $100k-200k, 9773.3% for AGIs over 200k)
Taxable individual retirement arrangement distribution: $23,064 (reported on 5.4% of returns)
79782:
$23,064
Texas:
$24,740
(% of AGI for various income ranges: 235.0% for AGIs $50k-75k, 591.3% for AGIs $100k-200k, 1886.7% for AGIs over 200k)
Total itemized deductions: $81,290 (reported on 5.0% of returns)
Here:
$81,290
State:
$40,428
(% of AGI for various income ranges: 567.4% for AGIs $100k-200k, 22746.7% for AGIs over 200k)
Charity contributions: $67,412 (reported on 4.0% of returns)
Here:
$67,412
State:
$18,201
(% of AGI for various income ranges: 17976.7% for AGIs over 200k)
Taxes paid: $5,180 (reported on 5.0% of returns)
79782:
$5,180
State:
$7,821
(% of AGI for various income ranges: 80.9% for AGIs $100k-200k, 1106.7% for AGIs over 200k)
Earned income credit: $2,786 (reported on 18.3% of returns)
Here:
$2,786
State:
$2,584
(% of AGI for various income ranges: 163.7% for AGIs below $25k, 93.4% for AGIs $25k-50k)
Percentage of individuals using paid preparers for their 2020 taxes: 94.6%
Here:
95%
State:
92%
(% for various income ranges: 94.6% for AGIs below $25k, 95.2% for AGIs $25k-50k, 93.9% for AGIs $50k-75k, 95.0% for AGIs $75k-100k, 94.1% for AGIs $100k-200k, 94.1% for AGIs over 200k)
Averages for the 2012 tax year for zip code 79782, filed in 2013:
Average Adjusted Gross Income (AGI) in 2012: $76,229 (Individual Income Tax Returns)
Here:
$76,229
State:
$65,384
Salary/wage: $50,201 (reported on 87.4% of returns)
Here:
$50,201
State:
$52,524
(% of AGI for various income ranges: 85.7% for AGIs below $25k, 88.0% for AGIs $25k-50k, 89.3% for AGIs $50k-75k, 83.9% for AGIs $75k-100k, 73.8% for AGIs $100k-200k, 16.1% for AGIs over 200k)
Taxable interest for individuals: $1,557 (reported on 22.1% of returns)
This zip code:
$1,557
Texas:
$2,372
(% of AGI for various income ranges: 0.4% for AGIs below $25k, 0.1% for AGIs $25k-50k, 0.2% for AGIs $50k-75k, 0.4% for AGIs $75k-100k, 0.6% for AGIs $100k-200k, 0.6% for AGIs over 200k)
Ordinary dividends: $2,971 (reported on 11.1% of returns)
Here:
$2,971
State:
$9,721
(% of AGI for various income ranges: 0.2% for AGIs $25k-50k, 0.1% for AGIs $50k-75k, 0.2% for AGIs $75k-100k, 0.4% for AGIs $100k-200k, 0.7% for AGIs over 200k)
Net capital gain/loss in AGI: +$16,857 (reported on 11.1% of returns)
Here:
+$16,857
State:
+$35,319
(% of AGI for various income ranges: 0.4% for AGIs $25k-50k, 0.7% for AGIs $75k-100k, 1.4% for AGIs $100k-200k, 5.4% for AGIs over 200k)
Profit/loss from business: +$24,989 (reported on 18.4% of returns)
Here:
+$24,989
State:
+$13,732
(% of AGI for various income ranges: 5.1% for AGIs below $25k, 2.5% for AGIs $25k-50k, 1.1% for AGIs $50k-75k, 2.2% for AGIs $75k-100k, 4.8% for AGIs $100k-200k, 10.8% for AGIs over 200k)
Taxable individual retirement arrangement distribution: $9,492 (reported on 6.3% of returns)
79782:
$9,492
Texas:
$19,511
(% of AGI for various income ranges: 1.3% for AGIs below $25k, 1.4% for AGIs $25k-50k, 1.6% for AGIs $50k-75k, 1.7% for AGIs $100k-200k)
Total itemized deductions: $27,156 (14% of AGI, reported on 14.2% of returns)
Here:
$27,156
State:
$24,724
Here:
14.3% of AGI
State:
15.9% of AGI
(% of AGI for various income ranges: 5.1% for AGIs $25k-50k, 3.6% for AGIs $50k-75k, 4.5% for AGIs $75k-100k, 6.6% for AGIs $100k-200k, 5.4% for AGIs over 200k)
Charity contributions: $16,394 (reported on 8.9% of returns)
Here:
$16,394
State:
$6,808
(% of AGI for various income ranges: 1.0% for AGIs below $25k, 0.5% for AGIs $50k-75k, 0.9% for AGIs $75k-100k, 1.5% for AGIs $100k-200k, 3.7% for AGIs over 200k)
Taxes paid: $3,285 (reported on 13.7% of returns)
79782:
$3,285
State:
$6,921
(% of AGI for various income ranges: 0.6% for AGIs $25k-50k, 0.4% for AGIs $50k-75k, 0.7% for AGIs $75k-100k, 0.9% for AGIs $100k-200k, 0.5% for AGIs over 200k)
Earned income credit: $2,353 (reported on 20.0% of returns)
Here:
$2,353
State:
$2,570
(% of AGI for various income ranges: 9.0% for AGIs below $25k, 1.5% for AGIs $25k-50k)
Percentage of individuals using paid preparers for their 2012 taxes: 62.6%
Here:
63%
State:
51%
(% for various income ranges: 62.1% for AGIs below $25k, 56.2% for AGIs $25k-50k, 57.1% for AGIs $50k-75k, 66.7% for AGIs $75k-100k, 66.7% for AGIs $100k-200k, 90.9% for AGIs over 200k)
Averages for the 2004 tax year for zip code 79782, filed in 2005:
Average Adjusted Gross Income (AGI) in 2004: $37,253 (Individual Income Tax Returns)
Here:
$37,253
State:
$47,881
Salary/wage: $33,221 (reported on 85.0% of returns)
Here:
$33,221
State:
$41,947
(% of AGI for various income ranges: 173.4% for AGIs below $10k, 83.9% for AGIs $10k-25k, 81.8% for AGIs $25k-50k, 77.4% for AGIs $50k-75k, 75.3% for AGIs $75k-100k, 59.6% for AGIs over 100k)
Taxable interest for individuals: $2,185 (reported on 31.7% of returns)
This zip code:
$2,185
Texas:
$2,255
(% of AGI for various income ranges: 6.8% for AGIs below $10k, 1.1% for AGIs $10k-25k, 2.5% for AGIs $25k-50k, 1.9% for AGIs $50k-75k, 1.1% for AGIs $75k-100k, 1.7% for AGIs over 100k)
Taxable dividends: $2,326 (reported on 15.8% of returns)
Here:
$2,326
State:
$4,261
(% of AGI for various income ranges: 2.4% for AGIs below $10k, 0.3% for AGIs $10k-25k, 0.8% for AGIs $25k-50k, 0.4% for AGIs $50k-75k, 0.7% for AGIs $75k-100k, 2.0% for AGIs over 100k)
Net capital gain/loss: +$1,377 (reported on 13.7% of returns)
Here:
+$1,377
State:
+$16,110
(% of AGI for various income ranges: -2.2% for AGIs below $10k, 0.2% for AGIs $10k-25k, 0.1% for AGIs $25k-50k, -0.1% for AGIs $50k-75k, 0.8% for AGIs $75k-100k, 1.6% for AGIs over 100k)
Profit/loss from business: +$6,796 (reported on 18.5% of returns)
Here:
+$6,796
State:
+$11,013
(% of AGI for various income ranges: -13.9% for AGIs below $10k, 2.3% for AGIs $10k-25k, 2.3% for AGIs $25k-50k, 3.0% for AGIs $50k-75k, -0.1% for AGIs $75k-100k, 7.9% for AGIs over 100k)
IRA payment deduction: $3,821 (reported on 1.8% of returns)
79782:
$3,821
Texas:
$3,120
Total itemized deductions: $16,512 (22% of AGI, reported on 10.6% of returns)
Here:
$16,512
State:
$19,631
Here:
21.9% of AGI
State:
18.9% of AGI
(% of AGI for various income ranges: 13.5% for AGIs below $10k, 5.2% for AGIs $10k-25k, 3.3% for AGIs $25k-50k, 4.2% for AGIs $50k-75k, 5.7% for AGIs $75k-100k, 4.9% for AGIs over 100k)
Charity contributions deductions: $6,569 (8% of AGI, reported on 8.6% of returns)
Here:
$6,569
State:
$4,753
Here:
8.0% of AGI
State:
4.2% of AGI
(% of AGI for various income ranges: 2.9% for AGIs below $10k, 0.9% for AGIs $25k-50k, 1.1% for AGIs $50k-75k, 1.8% for AGIs $75k-100k, 2.9% for AGIs over 100k)
Total tax: $6,438 (reported on 66.5% of returns)
79782:
$6,438
State:
$9,058
(% of AGI for various income ranges: 4.5% for AGIs below $10k, 3.5% for AGIs $10k-25k, 5.7% for AGIs $25k-50k, 8.9% for AGIs $50k-75k, 11.7% for AGIs $75k-100k, 22.5% for AGIs over 100k)
Earned income credit: $1,955 (reported on 26.7% of returns)
Here:
$1,955
State:
$2,024
Percentage of individuals using paid preparers for their 2004 taxes: 68.1%
Here:
68%
State:
57%
(% for various income ranges: 64.9% for AGIs below $10k, 73.8% for AGIs $10k-25k, 64.0% for AGIs $25k-50k, 71.1% for AGIs $50k-75k, 61.2% for AGIs $75k-100k, 73.0% for AGIs over 100k)
Household received Food Stamps/SNAP in the past 12 months: 273 Household did not receive Food Stamps/SNAP in the past 12 months: 1,295
Women who had a birth in the past 12 months: 98 (100 now married, 0 unmarried) Women who did not have a birth in the past 12 months: 783 (541 now married, 235 unmarried)
Housing units in zip code 79782 with a mortgage: 329 (27 second mortgage, 29 both second mortgage and home equity loan) Median monthly owner costs for units with a mortgage: $1,917 Median monthly owner costs for units without a mortgage: $468
Residents with income below the poverty level in 2022:
This zip code:
15.0%
Whole state:
14.0%
Residents with income below 50% of the poverty level in 2022:
This zip code:
12.2%
Whole state:
7.4%
Median number of rooms in houses and condos:
Here:
5.7
State:
6.3
Median number of rooms in apartments:
Here:
4.9
State:
4.0
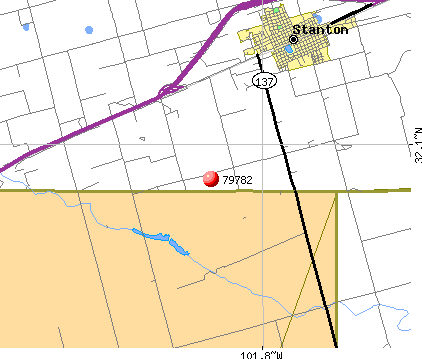
Notable locations in this zip code not listed on our city pages
Lakes and reservoirs: White Lake (A), China Lake (B), Salt Lake (C), Dewey Lake (D), Red Tank (E), Bluebell Tank (F), Big Tank (G). Display/hide their locations on the map
In group quarters: 58 (-1 institutionalized population)
Size of family households: 502 2-persons, 319 3-persons, 279 4-persons, 90 5-persons, 68 7-or-more-persons
Size of nonfamily households: 286 1-person, 13 4-persons
965 married couples with children.
130 single-parent households (30 men, 100 women).
62.5% of residents of 79782 zip code speak English at home.
34.1% of residents speak Spanish at home (68% very well, 26% well, 4% not well, 3% not at all).
3.3% of residents speak other Indo-European language at home (100% very well).
Foreign born population: 390 (9.6%) (30.2% of them are naturalized citizens)
This zip code:
9.6%
Whole state:
17.2%
92%Honduras
4%Costa Rica
10%English
6%American
6%German
2%Irish
2%European
1%Scottish
0%Russian
Year of entry for the foreign-born population
442010 or later
2502000 to 2009
01990 to 1999
82Before 1990
Facilities with environmental interests located in this zip code:
AMERICAN TRUCK AND EQUIPMENT PAINTING (3252 IH 20 in STANTON, TX)
Conditionally Exempt Small Quantity Generators, less than 100 kg/month of hazardous waste (Resource Conservation and Recovery Act (tracking hazardous waste))
Housing units lacking complete plumbing facilities: 4.2% Housing units lacking complete kitchen facilities: 5.7%
58.0%Electricity
32.7%Utility gas
9.4%Bottled, tank, or LP gas
Population in 1990: 3,776.
Place of birth for U.S.-born residents:
This state: 3,155
Northeast: 13
Midwest: 161
South: 175
West: 148
66% of the 79782 zip code residents lived in the same house 5 years ago. Out of people who lived in different houses, 51% lived in this county. Out of people who lived in different counties, 50% lived in Texas.
90% of the 79782 zip code residents lived in the same house 1 year ago. Out of people who lived in different houses, 72% moved from this county. Out of people who lived in different houses, 24% moved from different county within same state.
Private vs. public school enrollment:
Students in private schools in grades 1 to 8 (elementary and middle school): 81
Here:
16.4%
Texas:
8.8%
Students in private schools in grades 9 to 12 (high school):
Here:
0.0%
Texas:
8.0%
Students in private undergraduate colleges:
Here:
0.0%
Texas:
16.2%
Occupation by median earnings in the past 12 months ($)
68,874Management occupations
60,005Construction and extraction occupations
57,826Transportation occupations
52,029Office and administrative support occupations
49,382Community and social service occupations
44,178Material moving occupations
Companies with federal contracts located in this zip code:
S D BAKER CONSTRUCTION CO , IN (HWY 137 in STANTON, TX; small business)
$46,198 with Air Force for Vehicular Cab, Body, and Frame Structural Components. Signed on 2006-02-02. Completion date: 2006-03-16.
Top industries in this zip code by the number of employees in 2005:
Health Care and Social Assistance: General Medical and Surgical Hospitals (50-99 employees: 1 establishment)
Accommodation and Food Services: Limited-Service Restaurants (20-49: 1, 1-4: 1)
Mining: Support Activities for Oil and Gas Operations (20-49: 1, 1-4: 1)
Health Care and Social Assistance: Nursing Care Facilities (20-49: 1)
Other Services (except Public Administration): Religious Organizations (5-9: 3, 1-4: 3)
Finance and Insurance: Commercial Banking (10-19: 1, 5-9: 1)
People in group quarters in 2010:
41 people in nursing facilities/skilled-nursing facilities
7 people in local jails and other municipal confinement facilities
People in group quarters in 2000:
58 people in nursing homes
8 people in local jails and other confinement facilities (including police lockups)
2 people in religious group quarters
Fatal accident statistics in 2014:
Fatal accident count: 4
Vehicles involved in fatal accidents: 10
Fatal accidents caused by drunken drivers: 0
Fatalities: 5
Persons involved in fatal accidents: 19
Pedestrians involved in fatal accidents: 0
Fatal accident statistics in 2013:
Fatal accident count: 1
Vehicles involved in fatal accidents: 1
Fatal accidents caused by drunken drivers: 0
Fatalities: 1
Persons involved in fatal accidents: 1
Pedestrians involved in fatal accidents: 0
2005 - 2018 National Fire Incident Reporting System (NFIRS) incidents
According to the data from the years 2005 - 2018 the average number of fires per year is 16. The highest number of fire incidents - 78 took place in 2018, and the least - 0 in 2006. The data has an increasing trend.
When looking into fire subcategories, the most reports belonged to: Outside Fires (44.2%), and Mobile Property/Vehicle Fires (22.1%).
Fire incident types reported to NFIRS in Zip Code 79782


 Nearest zip codes: 79749, 79705, 79783, 79701, 79748, 79713.


 According to the data from the years 2005 - 2018 the average number of fires per year is 16. The highest number of fire incidents - 78 took place in 2018, and the least - 0 in 2006. The data has an increasing trend.
 When looking into fire subcategories, the most reports belonged to: Outside Fires (44.2%), and Mobile Property/Vehicle Fires (22.1%).