Estimated zip code population in 2022: 1,927 Zip code population in 2010: 1,855 Zip code population in 2000: 903
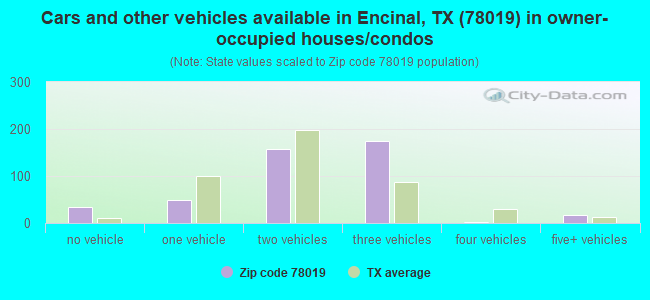
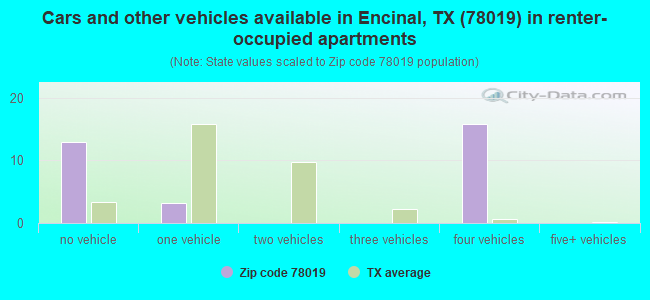
Houses and condos: 593 Renter-occupied apartments: 31
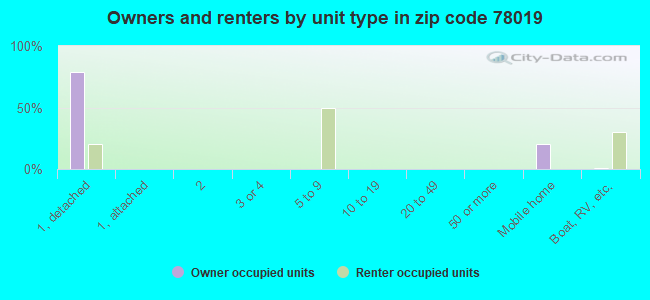
% of renters here:
7%
State:
38%
March 2022 cost of living index in zip code 78019: 79.0 (low, U.S. average is 100)
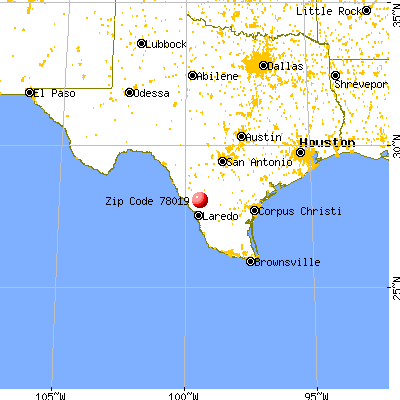
Land area: 967.0 sq. mi. Water area: 1.9 sq. mi.
Population density: 2 people per square mile
(very low).
OSM Map
General Map
Google Map
MSN Map
OSM Map
General Map
Google Map
MSN Map
OSM Map
General Map
Google Map
MSN Map
OSM Map
General Map
Google Map
MSN Map
Please wait while loading the map...
Real estate property taxes paid for housing units in 2022:
This zip code:
1.0% ($1,227)
Texas:
1.5% ($4,050)
Median real estate property taxes paid for housing units with mortgages in 2022: $2,908 (1.4%) Median real estate property taxes paid for housing units with no mortgage in 2022: $1,213 (1.1%)
Business Search- 14 Million verified businesses
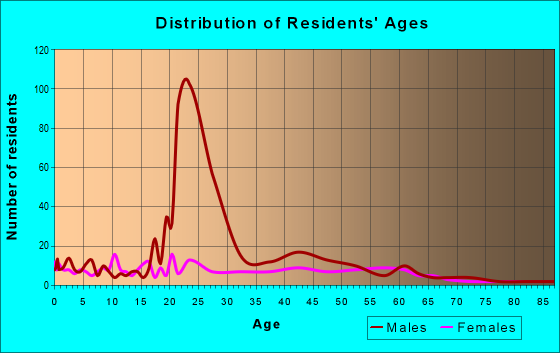
Males: 1,155
(59.9%)
Females: 772
(40.1%)
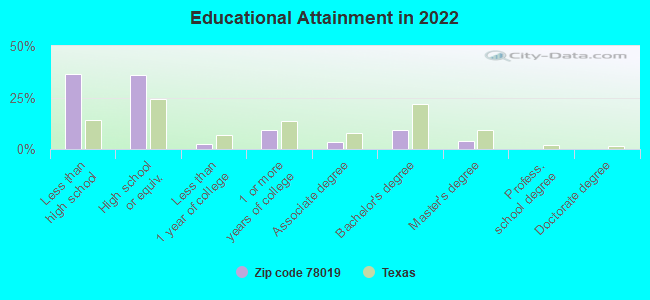
For population 25 years and over in 78019:
High school or higher: 61.0%
Bachelor's degree or higher: 12.5%
Graduate or professional degree: 3.7%
Unemployed: 1.2%
Mean travel time to work (commute): 14.9 minutes
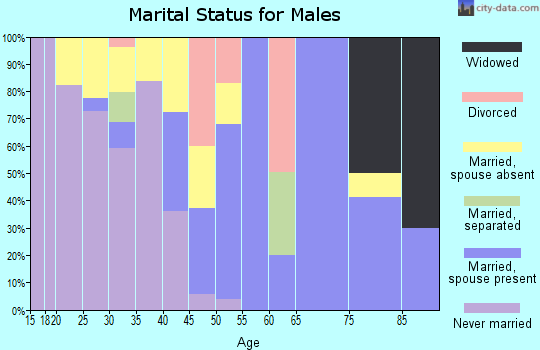
For population 15 years and over in 78019:
Never married: 50.6%
Now married: 38.8%
Separated: 0.1%
Widowed: 5.8%
Divorced: 4.7%
Zip code 78019 compared to state average:
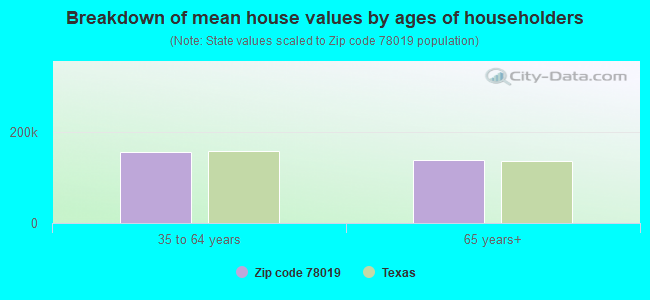
Median house value below state average.
Unemployed percentage significantly below state average.
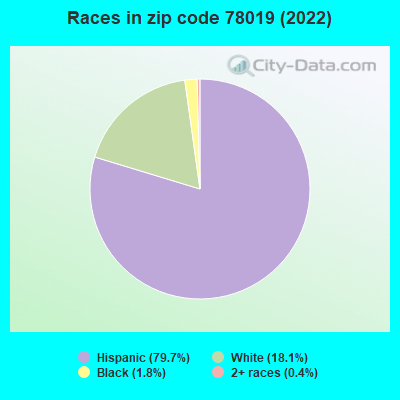
Black race population percentage significantly below state average.
Hispanic race population percentage above state average.
Renting percentage significantly below state average.
Length of stay since moving in significantly above state average.
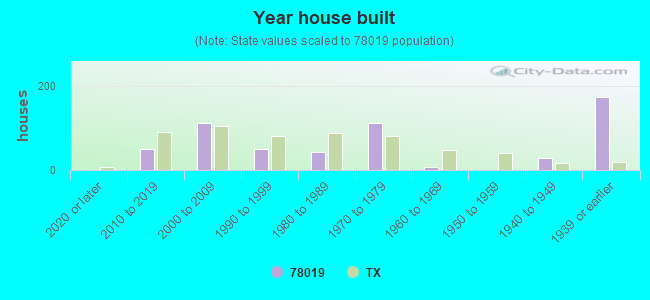
House age above state average.
Number of college students above state average.
Percentage of population with a bachelor's degree or higher significantly below state average.
Averages for the 2004 tax year for zip code 78019, filed in 2005:
Average Adjusted Gross Income (AGI) in 2004: $26,490 (Individual Income Tax Returns)
Here:
$26,490
State:
$47,881
Salary/wage: $23,881 (reported on 88.9% of returns)
Here:
$23,881
State:
$41,947
(% of AGI for various income ranges: 83.8% for AGIs below $10k, 88.4% for AGIs $10k-25k, 87.5% for AGIs $25k-50k, 79.8% for AGIs $50k-75k, 64.2% for AGIs $75k-100k)
Taxable interest for individuals: $472 (reported on 18.1% of returns)
This zip code:
$472
Texas:
$2,255
(% of AGI for various income ranges: 0.7% for AGIs below $10k, 0.1% for AGIs $10k-25k, 0.3% for AGIs $25k-50k, 0.6% for AGIs $75k-100k)
Taxable dividends: $1,731 (reported on 6.5% of returns)
Here:
$1,731
State:
$4,261
Net capital gain/loss: +$1,217 (reported on 5.8% of returns)
Here:
+$1,217
State:
+$16,110
Profit/loss from business: +$949 (reported on 14.8% of returns)
Here:
+$949
State:
+$11,013
Total itemized deductions: $15,788 (25% of AGI, reported on 8.3% of returns)
Here:
$15,788
State:
$19,631
Here:
25.3% of AGI
State:
18.9% of AGI
Charity contributions deductions: $1,500 (3% of AGI, reported on 5.0% of returns)
Here:
$1,500
State:
$4,753
Here:
2.9% of AGI
State:
4.2% of AGI
Total tax: $3,628 (reported on 58.0% of returns)
78019:
$3,628
State:
$9,058
(% of AGI for various income ranges: 3.1% for AGIs below $10k, 2.8% for AGIs $10k-25k, 5.6% for AGIs $25k-50k, 8.8% for AGIs $50k-75k, 15.5% for AGIs $75k-100k)
Earned income credit: $2,114 (reported on 41.7% of returns)
Here:
$2,114
State:
$2,024
Percentage of individuals using paid preparers for their 2004 taxes: 64.6%
Here:
65%
State:
57%
(% for various income ranges: 60.0% for AGIs below $10k, 67.2% for AGIs $10k-25k, 63.6% for AGIs $25k-50k, 66.7% for AGIs $50k-75k, 75.0% for AGIs $75k-100k)
Household received Food Stamps/SNAP in the past 12 months: 64 Household did not receive Food Stamps/SNAP in the past 12 months: 403
Women who had a birth in the past 12 months: 6 (6 now married, 0 unmarried) Women who did not have a birth in the past 12 months: 401 (64 now married, 340 unmarried)
Housing units in zip code 78019 with a mortgage: 35 Median monthly owner costs for units with a mortgage: $1,279 Median monthly owner costs for units without a mortgage: $502
Residents with income below the poverty level in 2022:
This zip code:
15.7%
Whole state:
14.0%
Residents with income below 50% of the poverty level in 2022:
This zip code:
11.5%
Whole state:
7.4%
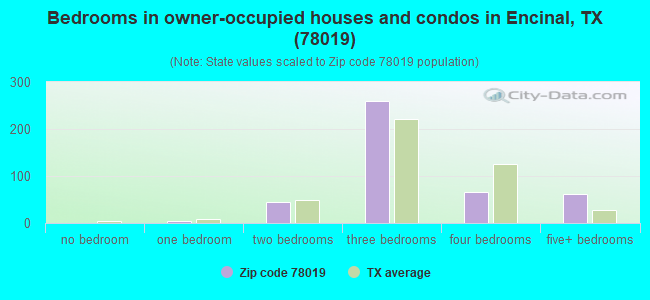
Median number of rooms in houses and condos:
Here:
6.0
State:
6.3
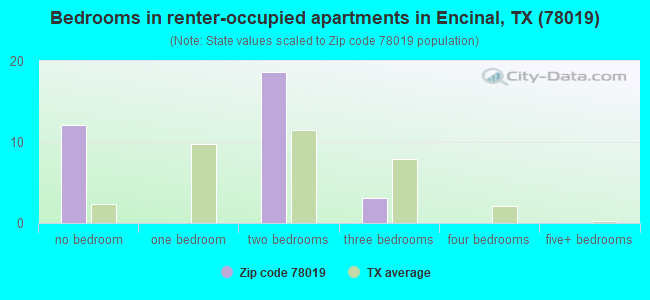
Median number of rooms in apartments:
Here:
3.7
State:
4.0
Notable locations in this zip code not listed on our city pages
Notable locations in zip code 78019: A Schletze (A), Atlee Siding (B), B Dunbar (C), Bell Ranch (D), Bennet Ranch (E), Brewster Ranch (F), Brown Ranch (G), Bruni Ranch (H), Buena Vista Ranch (I), C Chenault (J), Callaghan Ranch (K), E Lissy (L), Espejo Ranch (M), F B Ashe (N), F Churchill (O), G Lyles (P), Galvan Ranch (Q), H Garcia (R), Hill Top Inn (S), J Breeding (T). Display/hide their locations on the map
Reservoirs: Woodpecker Tank (A), Salines Lake (B), Traylor Lake Number 2 (C), Nunley Lake Number 2 (D), Bowles Lake (E), Nunley Lake Number 3 (F), Tiller Lake (G), Martinena Ranch Lake (H). Display/hide their locations on the map
Streams, rivers, and creeks: Venado Creek (A), Tecolate Creek (B), Tierra Blanca Creek (C), Becerra Creek (D), Salado Creek (E), Las Pintas Creek (F), Espejo (G), Chucareto Creek (H), Cuchara Creek (I). Display/hide their locations on the map
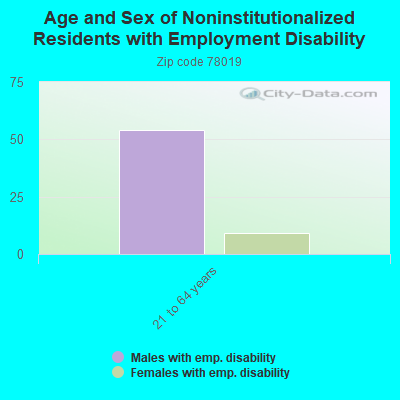
In group quarters: 248 (-1 institutionalized population)
Size of family households: 264 2-persons, 55 3-persons, 9 4-persons, 57 5-persons, 39 6-persons
Size of nonfamily households: 37 1-person
176 married couples with children.
10 single-parent households (10 men).
28.3% of residents of 78019 zip code speak English at home.
72.1% of residents speak Spanish at home (80% very well, 2% well, 4% not well, 14% not at all).
0.5% of residents speak other language at home (100% not at all).
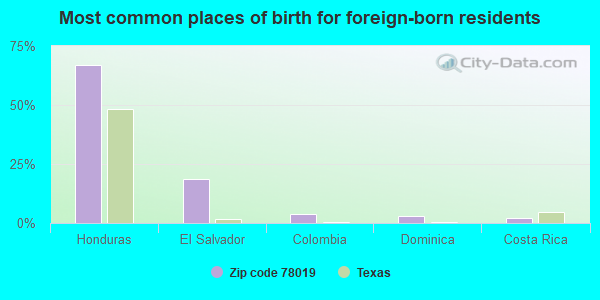
Foreign born population: 279 (14.5%) (12.6% of them are naturalized citizens)
This zip code:
14.5%
Whole state:
17.2%
67%Honduras
19%El Salvador
4%Colombia
3%Dominica
2%Costa Rica
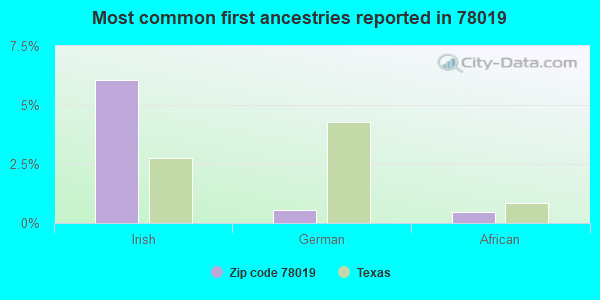
6%Irish
1%German
0%African
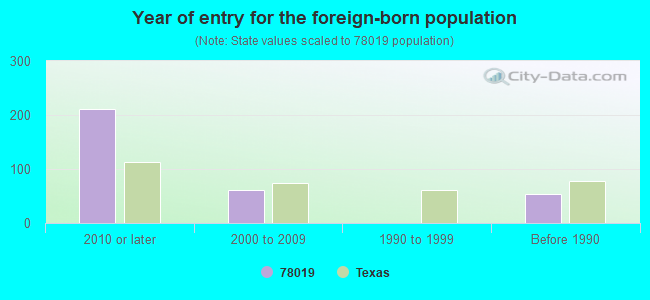
Year of entry for the foreign-born population
2112010 or later
612000 to 2009
01990 to 1999
54Before 1990
Facilities with environmental interests located in this zip code:
AMERICAN TELEPHONE AND TELEGRAPH COMPANY (HWY 83 12 MI ON H44 2.3 MI S O in ENCINAL, TX)
(Resource Conservation and Recovery Act (tracking hazardous waste)) Alternative names: AMERICAN TEL & TEL CO LONG LINES
Housing units lacking complete plumbing facilities: 10.5% Housing units lacking complete kitchen facilities: 5.4%
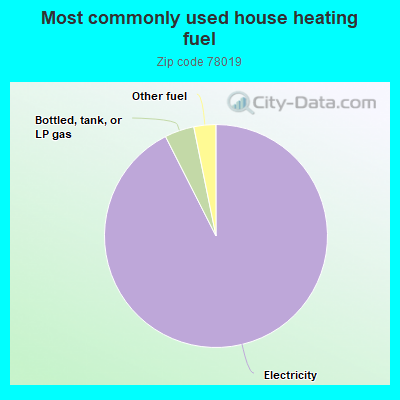
92.8%Electricity
4.3%Bottled, tank, or LP gas
3.2%Other fuel
Population in 1990: 821. Population change in the 1990s: +82 (+10.0%).
Place of birth for U.S.-born residents:
This state: 1,307
Northeast: 138
Midwest: 96
South: 11
West: 61
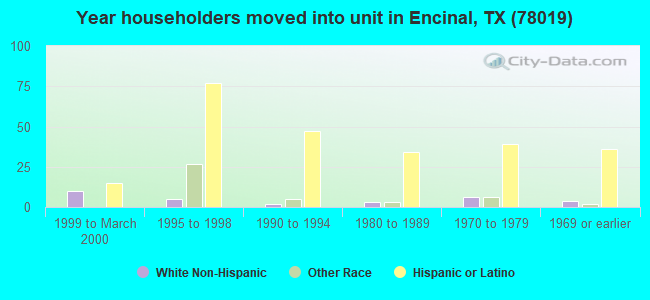
69% of the 78019 zip code residents lived in the same house 5 years ago. Out of people who lived in different houses, 75% lived in this county. Out of people who lived in different counties, 50% lived in Texas.
88% of the 78019 zip code residents lived in the same house 1 year ago. Out of people who lived in different houses, 11% moved from this county. Out of people who lived in different houses, 7% moved from different county within same state. Out of people who lived in different houses, 3% moved from different state. Out of people who lived in different houses, 91% moved from abroad.
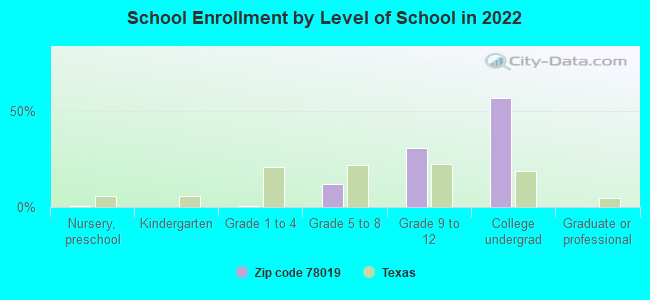
Private vs. public school enrollment:
Students in private schools in grades 1 to 8 (elementary and middle school): 36
Here:
55.8%
Texas:
8.8%
Students in private schools in grades 9 to 12 (high school): 53
Here:
31.6%
Texas:
8.0%
Students in private undergraduate colleges: 167
Here:
53.8%
Texas:
16.2%
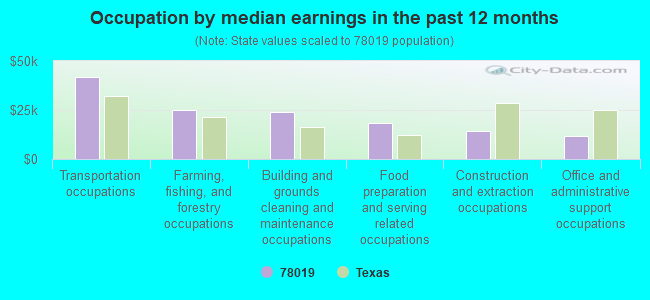
Occupation by median earnings in the past 12 months ($)
41,858Transportation occupations
25,190Farming, fishing, and forestry occupations
23,921Building and grounds cleaning and maintenance occupations
18,489Food preparation and serving related occupations
14,493Construction and extraction occupations
11,623Office and administrative support occupations
Top industries in this zip code by the number of employees in 2005:
Mining: Crude Petroleum and Natural Gas Extraction (250-499 employees: 1 establishment, 1-4 employees: 1 establishment)
Mining: Drilling Oil and Gas Wells (20-49: 1)
Health Care and Social Assistance: Offices of Physicians (except Mental Health Specialists) (10-19: 1)
Accommodation and Food Services: Full-Service Restaurants (5-9: 1)
Utilities: Water Supply and Irrigation Systems (1-4: 1)
Construction: Site Preparation Contractors (1-4: 1)
Other Services (except Public Administration): General Automotive Repair (1-4: 1)
People in group quarters in 2010:
995 people in federal detention centers
People in group quarters in 2000:
22 people in agriculture workers' dormitories on farms
Fatal accident statistics in 2014:
Fatal accident count: 4
Vehicles involved in fatal accidents: 5
Fatal accidents caused by drunken drivers: 0
Fatalities: 7
Persons involved in fatal accidents: 43
Pedestrians involved in fatal accidents: 1
Fatal accident statistics in 2013:
Fatal accident count: 5
Vehicles involved in fatal accidents: 8
Fatal accidents caused by drunken drivers: 0
Fatalities: 6
Persons involved in fatal accidents: 11
Pedestrians involved in fatal accidents: 0
Home Mortgage Disclosure Act Aggregated Statistics For Year 2009 (Based on 2 partial tracts)
A) FHA, FSA/RHS & VA Home Purchase Loans
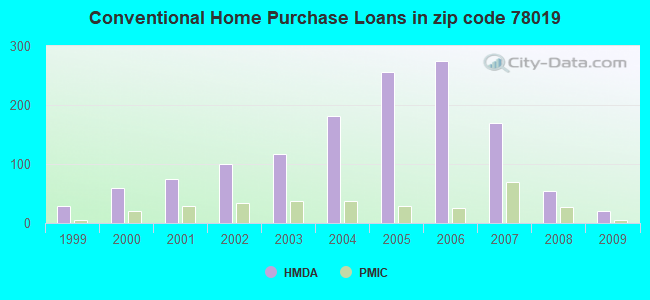
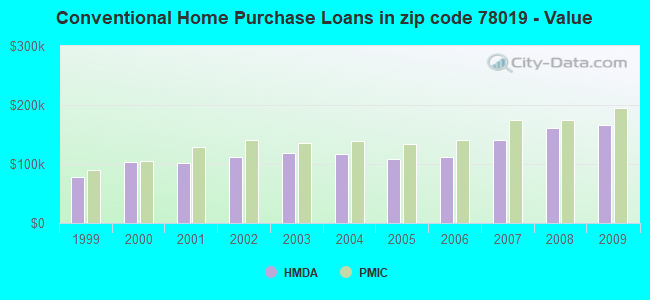
B) Conventional Home Purchase Loans
C) Refinancings
D) Home Improvement Loans
E) Loans on Dwellings For 5+ Families
F) Non-occupant Loans on < 5 Family Dwellings (A B C & D)
G) Loans On Manufactured Home Dwelling (A B C & D)
Number
Average Value
Number
Average Value
Number
Average Value
Number
Average Value
Number
Average Value
Number
Average Value
Number
Average Value
LOANS ORIGINATED
97
$161,262
21
$166,739
79
$155,153
5
$39,304
1
$363,560
7
$107,219
0
$0
APPLICATIONS APPROVED, NOT ACCEPTED
6
$152,882
2
$153,750
24
$155,036
0
$0
0
$0
1
$93,060
0
$0
APPLICATIONS DENIED
8
$158,805
5
$178,890
63
$152,500
16
$50,882
0
$0
3
$134,097
1
$79,190
APPLICATIONS WITHDRAWN
13
$148,279
5
$138,200
27
$136,783
4
$49,130
0
$0
2
$81,500
0
$0
FILES CLOSED FOR INCOMPLETENESS
1
$196,520
1
$92,480
9
$128,027
3
$104,617
0
$0
0
$0
0
$0
Aggregated Statistics For Year 2008 (Based on 2 partial tracts)
A) FHA, FSA/RHS & VA Home Purchase Loans
B) Conventional Home Purchase Loans
C) Refinancings
D) Home Improvement Loans
F) Non-occupant Loans on < 5 Family Dwellings (A B C & D)
G) Loans On Manufactured Home Dwelling (A B C & D)
Number
Average Value
Number
Average Value
Number
Average Value
Number
Average Value
Number
Average Value
Number
Average Value
LOANS ORIGINATED
48
$164,712
54
$160,507
49
$157,110
14
$41,761
12
$162,202
0
$0
APPLICATIONS APPROVED, NOT ACCEPTED
1
$186,120
8
$163,285
21
$152,826
1
$43,060
1
$51,440
0
$0
APPLICATIONS DENIED
12
$139,467
13
$135,274
78
$146,604
38
$66,151
4
$146,235
2
$69,215
APPLICATIONS WITHDRAWN
8
$158,950
4
$122,462
27
$144,939
5
$92,942
2
$112,855
0
$0
FILES CLOSED FOR INCOMPLETENESS
2
$159,960
4
$127,232
4
$168,775
5
$75,892
1
$136,120
0
$0
Aggregated Statistics For Year 2007 (Based on 2 partial tracts)
A) FHA, FSA/RHS & VA Home Purchase Loans
B) Conventional Home Purchase Loans
C) Refinancings
D) Home Improvement Loans
F) Non-occupant Loans on < 5 Family Dwellings (A B C & D)
G) Loans On Manufactured Home Dwelling (A B C & D)
Number
Average Value
Number
Average Value
Number
Average Value
Number
Average Value
Number
Average Value
Number
Average Value
LOANS ORIGINATED
37
$151,842
169
$140,196
58
$130,419
22
$33,576
18
$138,334
0
$0
APPLICATIONS APPROVED, NOT ACCEPTED
1
$171,380
33
$134,210
14
$104,618
3
$28,227
2
$41,615
0
$0
APPLICATIONS DENIED
5
$172,648
56
$121,767
97
$126,895
45
$43,510
6
$108,568
2
$89,155
APPLICATIONS WITHDRAWN
3
$129,280
22
$138,103
34
$123,139
6
$79,330
1
$158,080
0
$0
FILES CLOSED FOR INCOMPLETENESS
0
$0
10
$132,478
16
$142,892
6
$77,163
2
$88,435
0
$0
Aggregated Statistics For Year 2006 (Based on 2 partial tracts)
A) FHA, FSA/RHS & VA Home Purchase Loans
B) Conventional Home Purchase Loans
C) Refinancings
D) Home Improvement Loans
E) Loans on Dwellings For 5+ Families
F) Non-occupant Loans on < 5 Family Dwellings (A B C & D)
G) Loans On Manufactured Home Dwelling (A B C & D)
Number
Average Value
Number
Average Value
Number
Average Value
Number
Average Value
Number
Average Value
Number
Average Value
Number
Average Value
LOANS ORIGINATED
34
$144,628
275
$112,511
55
$141,442
18
$39,192
1
$409,800
17
$87,363
1
$37,860
APPLICATIONS APPROVED, NOT ACCEPTED
3
$129,567
41
$109,235
14
$136,139
4
$37,930
0
$0
1
$66,180
0
$0
APPLICATIONS DENIED
1
$202,590
86
$97,131
95
$124,988
34
$30,039
0
$0
10
$68,493
1
$17,920
APPLICATIONS WITHDRAWN
2
$159,385
27
$125,233
56
$120,286
6
$93,202
0
$0
3
$121,187
0
$0
FILES CLOSED FOR INCOMPLETENESS
0
$0
10
$116,005
17
$133,076
2
$116,035
0
$0
2
$63,145
0
$0
Aggregated Statistics For Year 2005 (Based on 2 partial tracts)
A) FHA, FSA/RHS & VA Home Purchase Loans
B) Conventional Home Purchase Loans
C) Refinancings
D) Home Improvement Loans
E) Loans on Dwellings For 5+ Families
F) Non-occupant Loans on < 5 Family Dwellings (A B C & D)
G) Loans On Manufactured Home Dwelling (A B C & D)
Number
Average Value
Number
Average Value
Number
Average Value
Number
Average Value
Number
Average Value
Number
Average Value
Number
Average Value
LOANS ORIGINATED
45
$139,407
256
$108,043
73
$120,248
17
$42,466
1
$277,440
26
$102,640
0
$0
APPLICATIONS APPROVED, NOT ACCEPTED
3
$128,510
50
$94,648
14
$121,690
2
$58,520
0
$0
3
$67,143
1
$49,710
APPLICATIONS DENIED
3
$131,687
68
$106,097
112
$117,804
28
$30,046
0
$0
6
$70,660
2
$39,160
APPLICATIONS WITHDRAWN
2
$133,375
49
$111,849
61
$135,299
12
$201,602
0
$0
4
$99,272
0
$0
FILES CLOSED FOR INCOMPLETENESS
0
$0
8
$125,931
25
$129,981
0
$0
0
$0
0
$0
0
$0
Aggregated Statistics For Year 2004 (Based on 2 partial tracts)
A) FHA, FSA/RHS & VA Home Purchase Loans
B) Conventional Home Purchase Loans
C) Refinancings
D) Home Improvement Loans
F) Non-occupant Loans on < 5 Family Dwellings (A B C & D)
G) Loans On Manufactured Home Dwelling (A B C & D)
Number
Average Value
Number
Average Value
Number
Average Value
Number
Average Value
Number
Average Value
Number
Average Value
LOANS ORIGINATED
60
$119,906
181
$116,668
88
$118,257
16
$22,759
14
$93,037
1
$46,820
APPLICATIONS APPROVED, NOT ACCEPTED
3
$104,810
32
$98,721
19
$106,976
3
$65,797
1
$113,870
0
$0
APPLICATIONS DENIED
6
$116,467
31
$94,736
114
$108,989
25
$22,103
7
$78,773
3
$34,390
APPLICATIONS WITHDRAWN
6
$114,203
23
$129,183
47
$114,542
2
$53,755
1
$65,600
0
$0
FILES CLOSED FOR INCOMPLETENESS
2
$113,430
9
$105,484
27
$117,891
1
$79,470
1
$78,030
0
$0
Aggregated Statistics For Year 2003 (Based on 2 partial tracts)
A) FHA, FSA/RHS & VA Home Purchase Loans
B) Conventional Home Purchase Loans
C) Refinancings
D) Home Improvement Loans
E) Loans on Dwellings For 5+ Families
F) Non-occupant Loans on < 5 Family Dwellings (A B C & D)
Number
Average Value
Number
Average Value
Number
Average Value
Number
Average Value
Number
Average Value
Number
Average Value
LOANS ORIGINATED
68
$115,575
117
$118,660
132
$114,234
11
$12,611
1
$239,870
12
$82,148
APPLICATIONS APPROVED, NOT ACCEPTED
4
$97,828
28
$117,871
25
$100,907
0
$0
0
$0
2
$81,645
APPLICATIONS DENIED
5
$100,398
26
$99,683
79
$91,394
16
$23,554
0
$0
5
$102,710
APPLICATIONS WITHDRAWN
5
$109,242
17
$114,189
66
$106,663
0
$0
0
$0
4
$105,775
FILES CLOSED FOR INCOMPLETENESS
1
$79,470
5
$107,624
7
$108,376
0
$0
0
$0
0
$0
Aggregated Statistics For Year 2002 (Based on 2 partial tracts)
A) FHA, FSA/RHS & VA Home Purchase Loans
B) Conventional Home Purchase Loans
C) Refinancings
D) Home Improvement Loans
F) Non-occupant Loans on < 5 Family Dwellings (A B C & D)
Number
Average Value
Number
Average Value
Number
Average Value
Number
Average Value
Number
Average Value
LOANS ORIGINATED
79
$103,832
100
$112,340
75
$112,255
10
$18,265
9
$89,204
APPLICATIONS APPROVED, NOT ACCEPTED
3
$94,503
10
$110,138
12
$104,835
2
$28,465
0
$0
APPLICATIONS DENIED
10
$100,052
14
$93,202
40
$87,726
9
$20,101
0
$0
APPLICATIONS WITHDRAWN
22
$94,845
13
$101,439
30
$108,982
1
$17,050
1
$132,940
FILES CLOSED FOR INCOMPLETENESS
1
$85,830
2
$119,210
12
$114,661
0
$0
0
$0
Aggregated Statistics For Year 2001 (Based on 2 partial tracts)
A) FHA, FSA/RHS & VA Home Purchase Loans
B) Conventional Home Purchase Loans
C) Refinancings
D) Home Improvement Loans
E) Loans on Dwellings For 5+ Families
F) Non-occupant Loans on < 5 Family Dwellings (A B C & D)
Number
Average Value
Number
Average Value
Number
Average Value
Number
Average Value
Number
Average Value
Number
Average Value
LOANS ORIGINATED
52
$104,957
74
$102,376
53
$98,980
11
$15,580
1
$73,980
16
$97,032
APPLICATIONS APPROVED, NOT ACCEPTED
2
$96,815
8
$76,658
9
$88,627
1
$7,220
0
$0
1
$80,920
APPLICATIONS DENIED
12
$111,722
34
$73,015
30
$95,996
8
$12,066
0
$0
3
$92,673
APPLICATIONS WITHDRAWN
16
$86,501
52
$89,045
17
$78,421
0
$0
0
$0
3
$126,583
FILES CLOSED FOR INCOMPLETENESS
1
$155,770
1
$260,970
3
$132,553
0
$0
0
$0
1
$72,540
Aggregated Statistics For Year 2000 (Based on 2 partial tracts)
A) FHA, FSA/RHS & VA Home Purchase Loans
B) Conventional Home Purchase Loans
C) Refinancings
D) Home Improvement Loans
F) Non-occupant Loans on < 5 Family Dwellings (A B C & D)
Number
Average Value
Number
Average Value
Number
Average Value
Number
Average Value
Number
Average Value
LOANS ORIGINATED
35
$95,486
60
$102,918
13
$98,860
6
$9,440
5
$110,398
APPLICATIONS APPROVED, NOT ACCEPTED
2
$94,215
14
$69,484
2
$97,395
2
$18,065
1
$65,600
APPLICATIONS DENIED
4
$87,782
25
$65,464
9
$54,428
6
$13,872
2
$60,110
APPLICATIONS WITHDRAWN
5
$98,838
13
$97,526
4
$75,790
1
$8,960
1
$43,350
FILES CLOSED FOR INCOMPLETENESS
1
$116,180
1
$65,600
5
$103,000
0
$0
0
$0
Aggregated Statistics For Year 1999 (Based on 1 partial tract)
A) FHA, FSA/RHS & VA Home Purchase Loans
B) Conventional Home Purchase Loans
C) Refinancings
D) Home Improvement Loans
F) Non-occupant Loans on < 5 Family Dwellings (A B C & D)


 Nearest zip codes: 78001, 78045, 78044, 78836, 78014, 78830.