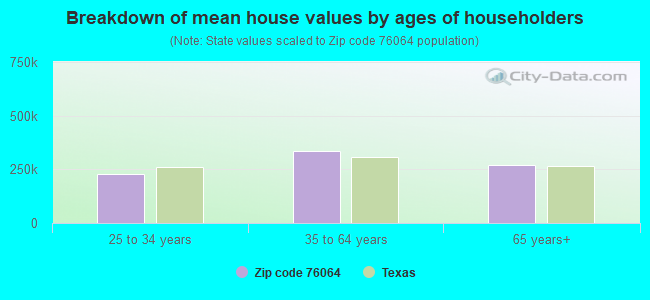
Estimated median house/condo value in 2022: $279,913
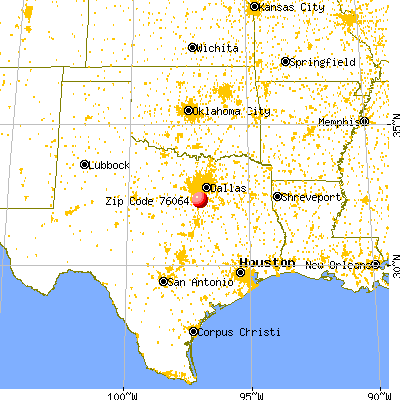
76064:
$279,913
Texas:
$275,400
According to our research of Texas and other state lists, there were 3 registered sex offenders living in 76064 zip code as of June 02, 2024. The ratio of all residents to sex offenders in zip code 76064 is 548 to 1. The ratio of registered sex offenders to all residents in this zip code is lower than the state average.
Median resident age:
This zip code:
47.7 years
Texas median age:
35.6 years
Average household size:
This zip code:
2.7 people
Texas:
2.6 people
Averages for the 2020 tax year for zip code 76064, filed in 2021:
Average Adjusted Gross Income (AGI) in 2020: $80,907 (Individual Income Tax Returns)
Here:
$80,907
State:
$77,054
Salary/wage: $68,521 (reported on 81.9% of returns)
Here:
$68,521
State:
$62,766
(% of AGI for various income ranges: 1108.3% for AGIs below $25k, 3697.9% for AGIs $25k-50k, 6750.0% for AGIs $50k-75k, 10397.5% for AGIs $75k-100k, 15625.7% for AGIs $100k-200k)
Taxable interest for individuals: $1,183 (reported on 31.9% of returns)
This zip code:
$1,183
Texas:
$2,665
(% of AGI for various income ranges: 6.1% for AGIs below $25k, 8.6% for AGIs $25k-50k, 47.3% for AGIs $50k-75k, 22.5% for AGIs $75k-100k, 138.6% for AGIs $100k-200k)
Ordinary dividends: $2,757 (reported on 14.9% of returns)
Here:
$2,757
State:
$10,044
(% of AGI for various income ranges: 83.6% for AGIs $25k-50k, 78.8% for AGIs $75k-100k, 98.6% for AGIs $100k-200k)
Net capital gain/loss in AGI: +$23,575 (reported on 17.0% of returns)
Here:
+$23,575
State:
+$39,590
(% of AGI for various income ranges: 250.0% for AGIs $50k-75k, 448.6% for AGIs $100k-200k)
Profit/loss from business: +$9,986 (reported on 22.3% of returns)
Here:
+$9,986
State:
+$10,888
(% of AGI for various income ranges: 182.2% for AGIs below $25k, 72.9% for AGIs $25k-50k, 80.0% for AGIs $50k-75k, 287.5% for AGIs $75k-100k, 963.6% for AGIs $100k-200k)
Taxable individual retirement arrangement distribution: $15,957 (reported on 7.4% of returns)
76064:
$15,957
Texas:
$24,740
(% of AGI for various income ranges: 299.3% for AGIs $25k-50k, 872.5% for AGIs $75k-100k)
Total itemized deductions: $35,983 (reported on 6.4% of returns)
Here:
$35,983
State:
$40,428
(% of AGI for various income ranges: 1542.1% for AGIs $100k-200k)
Charity contributions: $12,880 (reported on 5.3% of returns)
Here:
$12,880
State:
$18,201
(% of AGI for various income ranges: 460.0% for AGIs $100k-200k)
Taxes paid: $6,457 (reported on 7.4% of returns)
76064:
$6,457
State:
$7,821
(% of AGI for various income ranges: 322.9% for AGIs $100k-200k)
Earned income credit: $2,445 (reported on 11.7% of returns)
Here:
$2,445
State:
$2,584
(% of AGI for various income ranges: 78.3% for AGIs below $25k, 91.4% for AGIs $25k-50k)
Percentage of individuals using paid preparers for their 2020 taxes: 90.4%
Here:
90%
State:
92%
(% for various income ranges: 92.0% for AGIs below $25k, 88.2% for AGIs $25k-50k, 93.3% for AGIs $50k-75k, 91.7% for AGIs $75k-100k, 90.0% for AGIs $100k-200k, 80.0% for AGIs over 200k)
Averages for the 2012 tax year for zip code 76064, filed in 2013:
Average Adjusted Gross Income (AGI) in 2012: $62,492 (Individual Income Tax Returns)
Here:
$62,492
State:
$65,384
Salary/wage: $54,732 (reported on 85.7% of returns)
Here:
$54,732
State:
$52,524
(% of AGI for various income ranges: 75.3% for AGIs below $25k, 85.7% for AGIs $25k-50k, 79.0% for AGIs $50k-75k, 83.6% for AGIs $75k-100k, 99.7% for AGIs $100k-200k)
Taxable interest for individuals: $1,184 (reported on 29.8% of returns)
This zip code:
$1,184
Texas:
$2,372
(% of AGI for various income ranges: 1.3% for AGIs below $25k, 0.4% for AGIs $25k-50k, 0.5% for AGIs $50k-75k, 1.1% for AGIs $100k-200k)
Ordinary dividends: $1,764 (reported on 13.1% of returns)
Here:
$1,764
State:
$9,721
(% of AGI for various income ranges: 2.2% for AGIs below $25k, 0.5% for AGIs $50k-75k, 0.5% for AGIs $100k-200k)
Net capital gain/loss in AGI: +$5,829 (reported on 8.3% of returns)
Here:
+$5,829
State:
+$35,319
(% of AGI for various income ranges: 6.9% for AGIs below $25k, 2.4% for AGIs $100k-200k)
Profit/loss from business: +$10,021 (reported on 22.6% of returns)
Here:
+$10,021
State:
+$13,732
(% of AGI for various income ranges: 13.5% for AGIs below $25k, 3.2% for AGIs $25k-50k, 5.7% for AGIs $50k-75k, 4.8% for AGIs $100k-200k)
Taxable individual retirement arrangement distribution: $13,243 (reported on 8.3% of returns)
76064:
$13,243
Texas:
$19,511
Total itemized deductions: $21,312 (20% of AGI, reported on 29.8% of returns)
Here:
$21,312
State:
$24,724
Here:
20.4% of AGI
State:
15.9% of AGI
(% of AGI for various income ranges: 11.3% for AGIs $25k-50k, 9.7% for AGIs $50k-75k, 9.8% for AGIs $75k-100k, 16.7% for AGIs $100k-200k)
Charity contributions: $5,147 (reported on 22.6% of returns)
Here:
$5,147
State:
$6,808
(% of AGI for various income ranges: 1.6% for AGIs $25k-50k, 1.8% for AGIs $50k-75k, 1.6% for AGIs $75k-100k, 3.4% for AGIs $100k-200k)
Taxes paid: $4,936 (reported on 29.8% of returns)
76064:
$4,936
State:
$6,921
(% of AGI for various income ranges: 2.0% for AGIs $25k-50k, 1.7% for AGIs $50k-75k, 2.2% for AGIs $75k-100k, 4.4% for AGIs $100k-200k)
Earned income credit: $2,254 (reported on 15.5% of returns)
Here:
$2,254
State:
$2,570
(% of AGI for various income ranges: 7.2% for AGIs below $25k, 1.2% for AGIs $25k-50k)
Percentage of individuals using paid preparers for their 2012 taxes: 57.1%
Here:
57%
State:
51%
(% for various income ranges: 52.0% for AGIs below $25k, 60.0% for AGIs $25k-50k, 57.1% for AGIs $50k-75k, 50.0% for AGIs $75k-100k, 76.9% for AGIs $100k-200k)
Averages for the 2004 tax year for zip code 76064, filed in 2005:
Average Adjusted Gross Income (AGI) in 2004: $46,171 (Individual Income Tax Returns)
Here:
$46,171
State:
$47,881
Salary/wage: $44,933 (reported on 89.0% of returns)
Here:
$44,933
State:
$41,947
(% of AGI for various income ranges: 132.6% for AGIs below $10k, 78.1% for AGIs $10k-25k, 88.2% for AGIs $25k-50k, 92.6% for AGIs $50k-75k, 86.1% for AGIs $75k-100k, 80.1% for AGIs over 100k)
Taxable interest for individuals: $814 (reported on 36.6% of returns)
This zip code:
$814
Texas:
$2,255
(% of AGI for various income ranges: 4.6% for AGIs below $10k, 0.6% for AGIs $10k-25k, 1.0% for AGIs $25k-50k, 0.5% for AGIs $50k-75k, 0.3% for AGIs $75k-100k, 0.6% for AGIs over 100k)
Taxable dividends: $692 (reported on 11.3% of returns)
Here:
$692
State:
$4,261
(% of AGI for various income ranges: 1.0% for AGIs below $10k, 0.2% for AGIs $25k-50k, 0.1% for AGIs $50k-75k, 0.0% for AGIs $75k-100k, 0.3% for AGIs over 100k)
Net capital gain/loss: +$2,286 (reported on 11.1% of returns)
Here:
+$2,286
State:
+$16,110
(% of AGI for various income ranges: 1.7% for AGIs $10k-25k, -0.0% for AGIs $25k-50k, 1.0% for AGIs $50k-75k, 0.7% for AGIs over 100k)
Profit/loss from business: +$5,372 (reported on 17.5% of returns)
Here:
+$5,372
State:
+$11,013
(% of AGI for various income ranges: 10.7% for AGIs below $10k, 7.0% for AGIs $10k-25k, 3.4% for AGIs $25k-50k, 0.4% for AGIs $50k-75k, 2.2% for AGIs $75k-100k, 0.7% for AGIs over 100k)
Total itemized deductions: $17,421 (22% of AGI, reported on 28.5% of returns)
Here:
$17,421
State:
$19,631
Here:
21.9% of AGI
State:
18.9% of AGI
(% of AGI for various income ranges: 10.0% for AGIs $25k-50k, 10.8% for AGIs $50k-75k, 12.9% for AGIs $75k-100k, 13.2% for AGIs over 100k)
Charity contributions deductions: $4,238 (5% of AGI, reported on 23.2% of returns)
Here:
$4,238
State:
$4,753
Here:
5.3% of AGI
State:
4.2% of AGI
(% of AGI for various income ranges: 1.6% for AGIs $25k-50k, 2.3% for AGIs $50k-75k, 1.9% for AGIs $75k-100k, 3.2% for AGIs over 100k)
Total tax: $5,767 (reported on 76.6% of returns)
76064:
$5,767
State:
$9,058
(% of AGI for various income ranges: 4.3% for AGIs below $10k, 3.7% for AGIs $10k-25k, 6.1% for AGIs $25k-50k, 7.3% for AGIs $50k-75k, 10.2% for AGIs $75k-100k, 15.9% for AGIs over 100k)
Earned income credit: $1,917 (reported on 15.6% of returns)
Here:
$1,917
State:
$2,024
Percentage of individuals using paid preparers for their 2004 taxes: 56.6%
Here:
57%
State:
57%
(% for various income ranges: 46.8% for AGIs below $10k, 57.6% for AGIs $10k-25k, 58.5% for AGIs $25k-50k, 58.3% for AGIs $50k-75k, 57.0% for AGIs $75k-100k, 62.7% for AGIs over 100k)
Household received Food Stamps/SNAP in the past 12 months: 19 Household did not receive Food Stamps/SNAP in the past 12 months: 717
Women who had a birth in the past 12 months: 18 (18 now married, 0 unmarried) Women who did not have a birth in the past 12 months: 429 (322 now married, 103 unmarried)
Housing units in zip code 76064 with a mortgage: 222 Median monthly owner costs for units with a mortgage: $1,638 Median monthly owner costs for units without a mortgage: $474
Residents with income below the poverty level in 2022:
This zip code:
6.7%
Whole state:
14.0%
Residents with income below 50% of the poverty level in 2022:
This zip code:
1.3%
Whole state:
7.4%
Median number of rooms in houses and condos:
Here:
5.4
State:
6.3
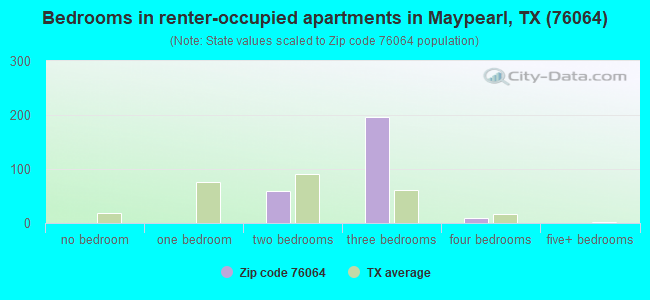
Median number of rooms in apartments:
Here:
5.2
State:
4.0
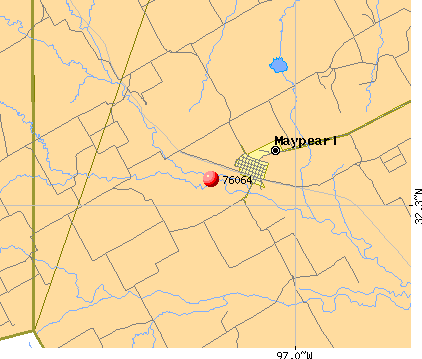
Notable locations in this zip code not listed on our city pages
Reservoirs: Wilemon Lake (A), Soil Conservation Service Site 54 Reservoir (B), Soil Conservation Service Site 75b Reservoir (C). Display/hide their locations on the map
Streams, rivers, and creeks: Weakly Branch (A), Valley Branch (B), South Fork Chambers Creek (C), North Fork Chambers Creek (D), East Fork Chambers Creek (E), Oak Branch (F), Cottonwood Creek (G), Coffee Branch (H), Armstrong Creek (I). Display/hide their locations on the map
Size of family households: 349 2-persons, 168 3-persons, 84 4-persons, 34 5-persons, 4 6-persons, 18 7-or-more-persons
Size of nonfamily households: 66 1-person, 10 2-persons, 4 4-persons
289 married couples with children.
48 single-parent households (38 men, 10 women).
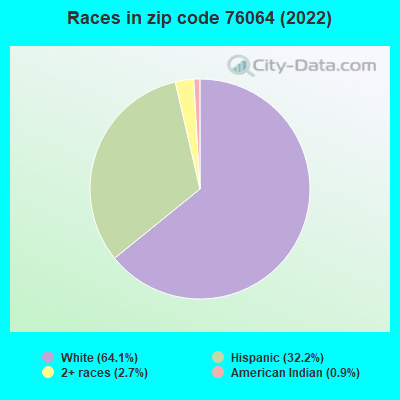
69.2% of residents of 76064 zip code speak English at home.
30.9% of residents speak Spanish at home (47% very well, 38% well, 14% not well, 1% not at all).
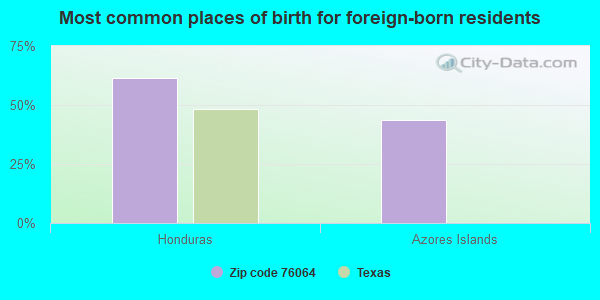
Foreign born population: 172 (8.6%) (64.4% of them are naturalized citizens)
This zip code:
8.6%
Whole state:
17.2%
61%Honduras
43%Azores Islands
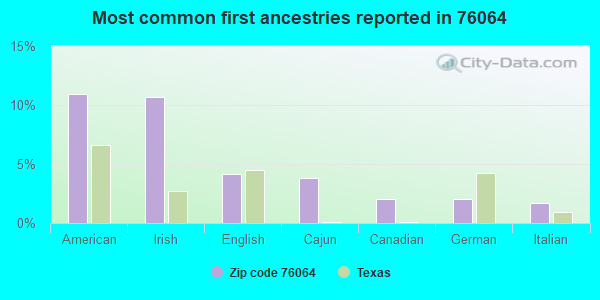
11%American
11%Irish
4%English
4%Cajun
2%Canadian
2%German
2%Italian
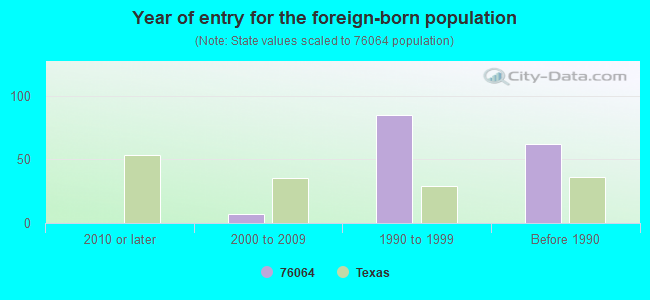
Year of entry for the foreign-born population
02010 or later
72000 to 2009
851990 to 1999
62Before 1990
Housing units lacking complete plumbing facilities: 1.6% Housing units lacking complete kitchen facilities: 2.4%
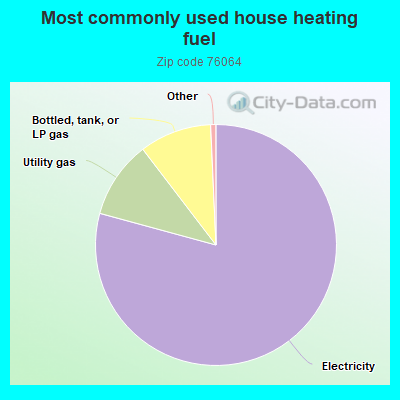
79.4%Electricity
10.4%Utility gas
9.7%Bottled, tank, or LP gas
Population in 1990: 2,842.
Place of birth for U.S.-born residents:
This state: 1,309
Northeast: 236
Midwest: 49
South: 66
West: 171
62% of the 76064 zip code residents lived in the same house 5 years ago. Out of people who lived in different houses, 47% lived in this county. Out of people who lived in different counties, 50% lived in Texas.
96% of the 76064 zip code residents lived in the same house 1 year ago. Out of people who lived in different houses, 59% moved from this county. Out of people who lived in different houses, 43% moved from different county within same state.
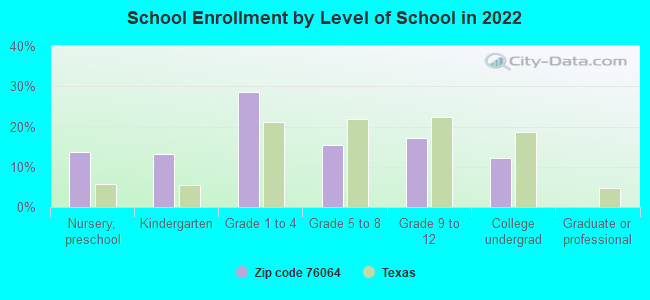
Private vs. public school enrollment:
Students in private schools in grades 1 to 8 (elementary and middle school): 9
Here:
6.2%
Texas:
8.8%
Students in private schools in grades 9 to 12 (high school):
Here:
0.0%
Texas:
8.0%
Students in private undergraduate colleges:
Here:
0.0%
Texas:
16.2%
Occupation by median earnings in the past 12 months ($)
101,627Law enforcement workers including supervisors
87,046Computer and mathematical occupations
65,550Business and financial operations occupations
65,246Management occupations
55,027Construction and extraction occupations
46,525Education, training, and library occupations
Top industries in this zip code by the number of employees in 2005:
Construction: Drywall and Insulation Contractors (20-49 employees: 1 establishment)
Health Care and Social Assistance: Child Day Care Services (20-49: 1)
Other Services (except Public Administration): Religious Organizations (5-9: 2, 1-4: 3)
Finance and Insurance: Commercial Banking (10-19: 1)
Construction: New Single-Family Housing Construction (except Operative Builders) (5-9: 1, 1-4: 1)
Construction: Framing Contractors (1-4: 1)
Home Mortgage Disclosure Act Aggregated Statistics For Year 2009 (Based on 2 partial tracts)
A) FHA, FSA/RHS & VA Home Purchase Loans
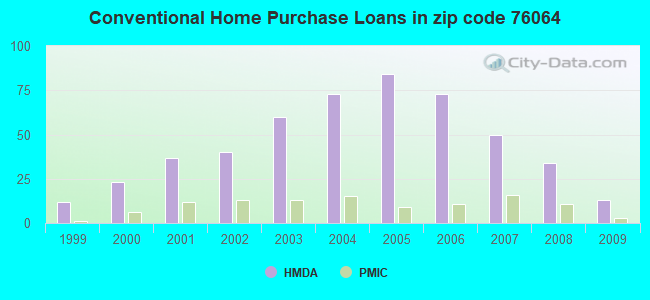
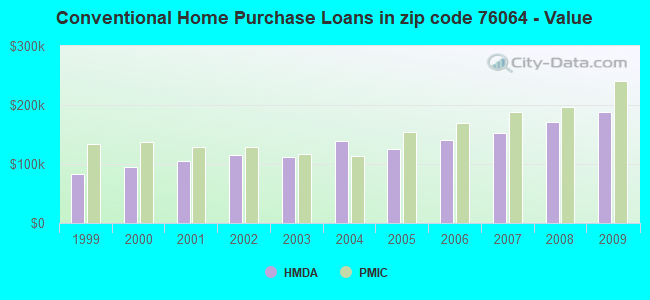
B) Conventional Home Purchase Loans
C) Refinancings
D) Home Improvement Loans
F) Non-occupant Loans on < 5 Family Dwellings (A B C & D)
G) Loans On Manufactured Home Dwelling (A B C & D)
Number
Average Value
Number
Average Value
Number
Average Value
Number
Average Value
Number
Average Value
Number
Average Value
LOANS ORIGINATED
15
$193,041
13
$188,228
50
$197,338
7
$47,206
2
$69,345
3
$69,747
APPLICATIONS APPROVED, NOT ACCEPTED
3
$191,150
2
$194,165
5
$138,932
2
$68,740
0
$0
0
$0
APPLICATIONS DENIED
4
$134,770
5
$134,348
28
$163,736
6
$66,532
1
$3,620
2
$39,195
APPLICATIONS WITHDRAWN
1
$113,360
4
$178,488
14
$187,231
2
$36,785
1
$119,390
0
$0
FILES CLOSED FOR INCOMPLETENESS
1
$141,100
1
$86,230
5
$209,482
1
$17,490
1
$86,230
1
$81,410
Aggregated Statistics For Year 2008 (Based on 2 partial tracts)
A) FHA, FSA/RHS & VA Home Purchase Loans
B) Conventional Home Purchase Loans
C) Refinancings
D) Home Improvement Loans
F) Non-occupant Loans on < 5 Family Dwellings (A B C & D)
G) Loans On Manufactured Home Dwelling (A B C & D)
Number
Average Value
Number
Average Value
Number
Average Value
Number
Average Value
Number
Average Value
Number
Average Value
LOANS ORIGINATED
10
$139,836
34
$170,915
39
$168,129
9
$23,584
9
$101,504
4
$70,400
APPLICATIONS APPROVED, NOT ACCEPTED
0
$0
4
$121,505
4
$163,262
2
$57,285
0
$0
2
$46,735
APPLICATIONS DENIED
2
$98,590
10
$137,363
28
$147,843
11
$24,394
3
$126,630
7
$76,581
APPLICATIONS WITHDRAWN
0
$0
5
$142,910
8
$140,650
1
$57,280
1
$49,450
0
$0
FILES CLOSED FOR INCOMPLETENESS
1
$142,910
1
$105,520
4
$231,402
1
$10,850
0
$0
1
$77,790
Aggregated Statistics For Year 2007 (Based on 2 partial tracts)
A) FHA, FSA/RHS & VA Home Purchase Loans
B) Conventional Home Purchase Loans
C) Refinancings
D) Home Improvement Loans
F) Non-occupant Loans on < 5 Family Dwellings (A B C & D)
G) Loans On Manufactured Home Dwelling (A B C & D)
Number
Average Value
Number
Average Value
Number
Average Value
Number
Average Value
Number
Average Value
Number
Average Value
LOANS ORIGINATED
15
$122,691
50
$152,077
42
$149,128
9
$35,376
6
$97,687
8
$101,455
APPLICATIONS APPROVED, NOT ACCEPTED
0
$0
8
$135,901
7
$182,364
3
$34,170
1
$8,440
0
$0
APPLICATIONS DENIED
3
$99,293
13
$141,427
30
$138,489
13
$46,895
2
$52,160
2
$25,325
APPLICATIONS WITHDRAWN
1
$63,920
8
$158,288
14
$136,623
4
$73,565
1
$120,600
0
$0
FILES CLOSED FOR INCOMPLETENESS
1
$62,110
2
$196,580
5
$166,910
0
$0
0
$0
1
$62,110
Aggregated Statistics For Year 2006 (Based on 2 partial tracts)
A) FHA, FSA/RHS & VA Home Purchase Loans
B) Conventional Home Purchase Loans
C) Refinancings
D) Home Improvement Loans
F) Non-occupant Loans on < 5 Family Dwellings (A B C & D)
G) Loans On Manufactured Home Dwelling (A B C & D)
Number
Average Value
Number
Average Value
Number
Average Value
Number
Average Value
Number
Average Value
Number
Average Value
LOANS ORIGINATED
19
$143,768
73
$140,392
57
$179,853
8
$51,029
11
$244,489
6
$100,400
APPLICATIONS APPROVED, NOT ACCEPTED
2
$99,195
19
$95,020
6
$162,608
3
$46,833
1
$216,480
3
$70,953
APPLICATIONS DENIED
4
$172,005
27
$125,223
35
$161,880
11
$52,461
2
$118,190
14
$81,405
APPLICATIONS WITHDRAWN
1
$148,340
10
$145,805
24
$164,016
4
$95,725
1
$81,410
1
$22,910
FILES CLOSED FOR INCOMPLETENESS
0
$0
5
$144,600
8
$147,208
1
$214,070
0
$0
0
$0
Aggregated Statistics For Year 2005 (Based on 2 partial tracts)
A) FHA, FSA/RHS & VA Home Purchase Loans
B) Conventional Home Purchase Loans
C) Refinancings
D) Home Improvement Loans
F) Non-occupant Loans on < 5 Family Dwellings (A B C & D)
G) Loans On Manufactured Home Dwelling (A B C & D)
Number
Average Value
Number
Average Value
Number
Average Value
Number
Average Value
Number
Average Value
Number
Average Value
LOANS ORIGINATED
12
$135,524
84
$125,690
60
$152,458
8
$69,571
6
$98,088
8
$88,114
APPLICATIONS APPROVED, NOT ACCEPTED
1
$124,220
8
$112,988
11
$195,646
2
$28,040
0
$0
2
$32,865
APPLICATIONS DENIED
4
$106,730
25
$136,374
53
$137,382
13
$64,660
3
$162,810
8
$75,074
APPLICATIONS WITHDRAWN
1
$102,510
16
$131,341
34
$179,073
10
$224,376
2
$124,820
1
$104,320
FILES CLOSED FOR INCOMPLETENESS
0
$0
5
$135,434
15
$159,192
1
$12,060
1
$115,780
0
$0
Aggregated Statistics For Year 2004 (Based on 2 partial tracts)
A) FHA, FSA/RHS & VA Home Purchase Loans
B) Conventional Home Purchase Loans
C) Refinancings
D) Home Improvement Loans
F) Non-occupant Loans on < 5 Family Dwellings (A B C & D)
G) Loans On Manufactured Home Dwelling (A B C & D)
Number
Average Value
Number
Average Value
Number
Average Value
Number
Average Value
Number
Average Value
Number
Average Value
LOANS ORIGINATED
10
$123,615
73
$138,318
77
$139,974
7
$25,411
7
$107,764
7
$87,349
APPLICATIONS APPROVED, NOT ACCEPTED
1
$110,350
13
$140,685
8
$187,684
3
$18,090
1
$80,800
1
$83,210
APPLICATIONS DENIED
3
$98,087
13
$111,323
57
$141,811
10
$110,409
2
$158,285
7
$65,296
APPLICATIONS WITHDRAWN
0
$0
7
$120,341
25
$118,092
1
$270,750
1
$97,690
0
$0
FILES CLOSED FOR INCOMPLETENESS
0
$0
1
$404,010
11
$148,284
0
$0
1
$43,420
0
$0
Aggregated Statistics For Year 2003 (Based on 2 partial tracts)
A) FHA, FSA/RHS & VA Home Purchase Loans
B) Conventional Home Purchase Loans
C) Refinancings
D) Home Improvement Loans
F) Non-occupant Loans on < 5 Family Dwellings (A B C & D)
Number
Average Value
Number
Average Value
Number
Average Value
Number
Average Value
Number
Average Value
LOANS ORIGINATED
14
$105,741
60
$111,364
147
$140,967
13
$32,376
4
$80,200
APPLICATIONS APPROVED, NOT ACCEPTED
1
$80,200
5
$119,514
25
$135,651
4
$43,415
2
$109,745
APPLICATIONS DENIED
3
$134,870
13
$90,172
57
$145,926
5
$20,260
2
$76,880
APPLICATIONS WITHDRAWN
2
$129,945
10
$107,696
44
$139,348
1
$123,010
2
$67,535
FILES CLOSED FOR INCOMPLETENESS
1
$74,770
3
$120,800
5
$88,882
1
$33,160
0
$0
Aggregated Statistics For Year 2002 (Based on 2 partial tracts)
A) FHA, FSA/RHS & VA Home Purchase Loans
B) Conventional Home Purchase Loans
C) Refinancings
D) Home Improvement Loans
F) Non-occupant Loans on < 5 Family Dwellings (A B C & D)
Number
Average Value
Number
Average Value
Number
Average Value
Number
Average Value
Number
Average Value
LOANS ORIGINATED
13
$100,748
40
$114,600
81
$129,273
11
$51,310
4
$69,345
APPLICATIONS APPROVED, NOT ACCEPTED
1
$84,420
4
$134,018
16
$137,371
1
$30,150
0
$0
APPLICATIONS DENIED
1
$156,780
17
$100,949
25
$210,230
7
$35,750
2
$22,010
APPLICATIONS WITHDRAWN
0
$0
7
$136,279
24
$160,423
1
$6,030
1
$83,820
FILES CLOSED FOR INCOMPLETENESS
1
$78,390
2
$169,445
8
$132,886
1
$25,330
0
$0
Aggregated Statistics For Year 2001 (Based on 2 partial tracts)
A) FHA, FSA/RHS & VA Home Purchase Loans
B) Conventional Home Purchase Loans
C) Refinancings
D) Home Improvement Loans
F) Non-occupant Loans on < 5 Family Dwellings (A B C & D)
Number
Average Value
Number
Average Value
Number
Average Value
Number
Average Value
Number
Average Value
LOANS ORIGINATED
10
$117,706
37
$104,661
52
$130,225
7
$57,543
2
$81,105
APPLICATIONS APPROVED, NOT ACCEPTED
1
$147,730
10
$138,811
10
$140,439
2
$13,265
1
$9,040
APPLICATIONS DENIED
2
$94,070
13
$60,439
23
$86,046
5
$11,096
1
$74,770
APPLICATIONS WITHDRAWN
1
$74,770
3
$103,917
15
$120,962
1
$4,820
0
$0
FILES CLOSED FOR INCOMPLETENESS
0
$0
1
$74,770
8
$101,605
1
$64,520
1
$44,620
Aggregated Statistics For Year 2000 (Based on 2 partial tracts)
A) FHA, FSA/RHS & VA Home Purchase Loans
B) Conventional Home Purchase Loans
C) Refinancings
D) Home Improvement Loans
F) Non-occupant Loans on < 5 Family Dwellings (A B C & D)
Number
Average Value
Number
Average Value
Number
Average Value
Number
Average Value
Number
Average Value
LOANS ORIGINATED
8
$70,099
23
$94,540
17
$97,296
3
$24,120
0
$0
APPLICATIONS APPROVED, NOT ACCEPTED
0
$0
8
$52,762
6
$91,555
2
$18,090
1
$22,910
APPLICATIONS DENIED
0
$0
8
$53,969
7
$78,046
7
$20,330
0
$0
APPLICATIONS WITHDRAWN
0
$0
5
$97,082
7
$91,829
0
$0
1
$19,300
FILES CLOSED FOR INCOMPLETENESS
1
$78,990
1
$84,420
2
$79,595
0
$0
0
$0
Aggregated Statistics For Year 1999 (Based on 1 partial tract)
A) FHA, FSA/RHS & VA Home Purchase Loans
B) Conventional Home Purchase Loans
C) Refinancings
D) Home Improvement Loans
F) Non-occupant Loans on < 5 Family Dwellings (A B C & D)
Detailed PMIC statistics for the following Tracts:0609.00
2002 - 2018 National Fire Incident Reporting System (NFIRS) incidents
According to the data from the years 2002 - 2018 the average number of fire incidents per year is 27. The highest number of reported fires - 64 took place in 2006, and the least - 3 in 2018. The data has a declining trend.
When looking into fire subcategories, the most incidents belonged to: Outside Fires (66.3%), and Structure Fires (18.9%).
Fire incident types reported to NFIRS in Zip Code 76064


 Nearest zip codes: 76050, 76084, 75167, 76670, 76065, 76055.


 According to the data from the years 2002 - 2018 the average number of fire incidents per year is 27. The highest number of reported fires - 64 took place in 2006, and the least - 3 in 2018. The data has a declining trend.
 When looking into fire subcategories, the most incidents belonged to: Outside Fires (66.3%), and Structure Fires (18.9%).