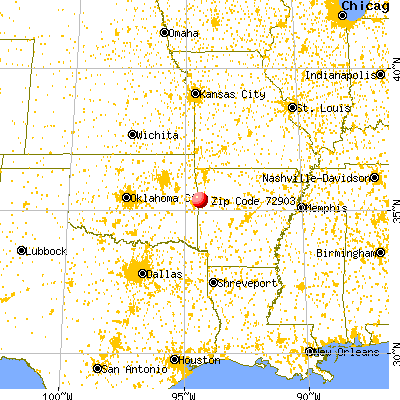
Estimated zip code population in 2022: 25,925 Zip code population in 2010: 26,148 Zip code population in 2000: 23,886
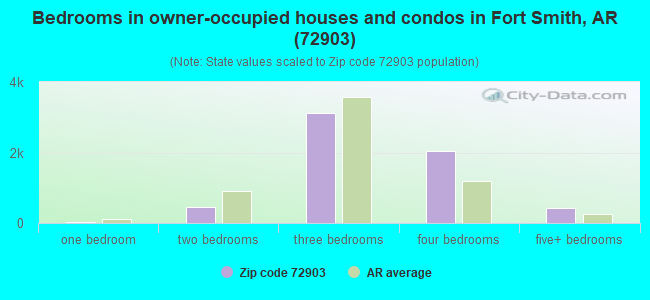
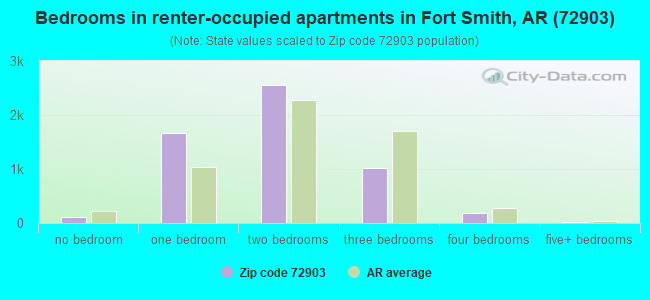
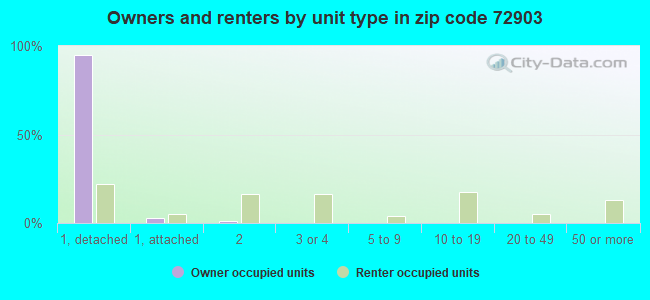
Houses and condos: 12,227 Renter-occupied apartments: 5,449
% of renters here:
47%
State:
34%
March 2022 cost of living index in zip code 72903: 80.2 (low, U.S. average is 100)
Land area: 16.8 sq. mi. Water area: 1.3 sq. mi.
Population density: 1,547 people per square mile
(low).
OSM Map
General Map
Google Map
MSN Map
OSM Map
General Map
Google Map
MSN Map
OSM Map
General Map
Google Map
MSN Map
OSM Map
General Map
Google Map
MSN Map
Please wait while loading the map...
Real estate property taxes paid for housing units in 2022:
This zip code:
0.6% ($1,468)
Arkansas:
0.5% ($977)
Median real estate property taxes paid for housing units with mortgages in 2022: $1,517 (0.6%) Median real estate property taxes paid for housing units with no mortgage in 2022: $1,452 (0.6%)
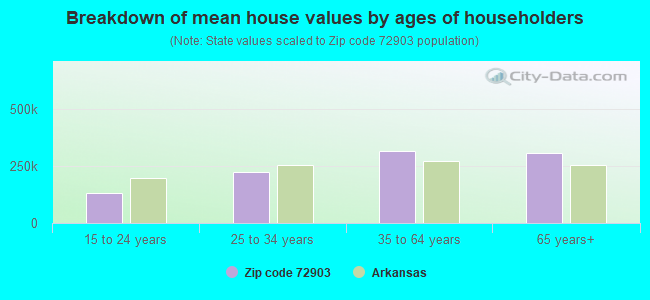
Estimated median house/condo value in 2022: $237,150
72903:
$237,150
Arkansas:
$179,800
According to our research of Arkansas and other state lists, there were 31 registered sex offenders living in 72903 zip code as of May 28, 2024. The ratio of all residents to sex offenders in zip code 72903 is 858 to 1. The ratio of registered sex offenders to all residents in this zip code is lower than the state average.
Median resident age:
This zip code:
39.1 years
Arkansas median age:
38.9 years
Average household size:
This zip code:
2.2 people
Arkansas:
2.4 people
Averages for the 2020 tax year for zip code 72903, filed in 2021:
Average Adjusted Gross Income (AGI) in 2020: $67,804 (Individual Income Tax Returns)
Here:
$67,804
State:
$64,872
Salary/wage: $53,991 (reported on 80.2% of returns)
Here:
$53,991
State:
$50,644
(% of AGI for various income ranges: 1237.1% for AGIs below $25k, 3631.2% for AGIs $25k-50k, 6650.9% for AGIs $50k-75k, 9129.6% for AGIs $75k-100k, 17445.7% for AGIs $100k-200k, 97479.3% for AGIs over 200k)
Taxable interest for individuals: $2,525 (reported on 28.9% of returns)
This zip code:
$2,525
Arkansas:
$1,857
(% of AGI for various income ranges: 17.7% for AGIs below $25k, 23.8% for AGIs $25k-50k, 94.9% for AGIs $50k-75k, 129.1% for AGIs $75k-100k, 254.4% for AGIs $100k-200k, 2616.7% for AGIs over 200k)
Ordinary dividends: $14,810 (reported on 18.2% of returns)
Here:
$14,810
State:
$21,681
(% of AGI for various income ranges: 26.3% for AGIs below $25k, 59.7% for AGIs $25k-50k, 150.2% for AGIs $50k-75k, 290.9% for AGIs $75k-100k, 578.6% for AGIs $100k-200k, 14347.3% for AGIs over 200k)
Net capital gain/loss in AGI: +$20,390 (reported on 16.6% of returns)
Here:
+$20,390
State:
+$22,815
(% of AGI for various income ranges: 11.8% for AGIs below $25k, 43.2% for AGIs $25k-50k, 109.2% for AGIs $50k-75k, 255.9% for AGIs $75k-100k, 980.8% for AGIs $100k-200k, 18782.7% for AGIs over 200k)
Profit/loss from business: +$10,442 (reported on 14.2% of returns)
Here:
+$10,442
State:
+$9,743
(% of AGI for various income ranges: 113.5% for AGIs below $25k, 82.5% for AGIs $25k-50k, 148.9% for AGIs $50k-75k, 318.8% for AGIs $75k-100k, 360.5% for AGIs $100k-200k, 3797.3% for AGIs over 200k)
Taxable individual retirement arrangement distribution: $22,224 (reported on 9.6% of returns)
72903:
$22,224
Arkansas:
$18,502
(% of AGI for various income ranges: 47.1% for AGIs below $25k, 114.0% for AGIs $25k-50k, 300.5% for AGIs $50k-75k, 505.4% for AGIs $75k-100k, 1278.1% for AGIs $100k-200k, 4192.0% for AGIs over 200k)
Self-employed (Keogh) retirement plans: $24,550 (reported on 0.4% of returns)
72903:
$24,550
Arkansas:
$24,438
(% of AGI for various income ranges: 654.7% for AGIs over 200k)
Total itemized deductions: $46,715 (reported on 7.5% of returns)
Here:
$46,715
State:
$52,840
(% of AGI for various income ranges: 44.1% for AGIs below $25k, 93.0% for AGIs $25k-50k, 301.2% for AGIs $50k-75k, 506.8% for AGIs $75k-100k, 1407.9% for AGIs $100k-200k, 14484.0% for AGIs over 200k)
Charity contributions: $22,142 (reported on 6.3% of returns)
Here:
$22,142
State:
$35,735
(% of AGI for various income ranges: 3.1% for AGIs below $25k, 17.9% for AGIs $25k-50k, 75.0% for AGIs $50k-75k, 169.5% for AGIs $75k-100k, 430.8% for AGIs $100k-200k, 7248.7% for AGIs over 200k)
Taxes paid: $7,234 (reported on 7.5% of returns)
72903:
$7,234
State:
$7,196
(% of AGI for various income ranges: 3.8% for AGIs below $25k, 10.5% for AGIs $25k-50k, 45.5% for AGIs $50k-75k, 99.6% for AGIs $75k-100k, 313.5% for AGIs $100k-200k, 1892.0% for AGIs over 200k)
Earned income credit: $2,341 (reported on 18.5% of returns)
Here:
$2,341
State:
$2,546
(% of AGI for various income ranges: 99.3% for AGIs below $25k, 71.8% for AGIs $25k-50k, 1.4% for AGIs $50k-75k)
Percentage of individuals using paid preparers for their 2020 taxes: 95.0%
Here:
95%
State:
94%
(% for various income ranges: 94.5% for AGIs below $25k, 95.7% for AGIs $25k-50k, 95.0% for AGIs $50k-75k, 95.5% for AGIs $75k-100k, 95.2% for AGIs $100k-200k, 92.6% for AGIs over 200k)
Averages for the 2012 tax year for zip code 72903, filed in 2013:
Average Adjusted Gross Income (AGI) in 2012: $66,236 (Individual Income Tax Returns)
Here:
$66,236
State:
$52,148
Salary/wage: $49,064 (reported on 82.5% of returns)
Here:
$49,064
State:
$41,669
(% of AGI for various income ranges: 77.9% for AGIs below $25k, 78.2% for AGIs $25k-50k, 73.1% for AGIs $50k-75k, 69.9% for AGIs $75k-100k, 66.8% for AGIs $100k-200k, 44.0% for AGIs over 200k)
Taxable interest for individuals: $3,642 (reported on 33.3% of returns)
This zip code:
$3,642
Arkansas:
$1,648
(% of AGI for various income ranges: 1.3% for AGIs below $25k, 1.1% for AGIs $25k-50k, 1.0% for AGIs $50k-75k, 1.4% for AGIs $75k-100k, 1.2% for AGIs $100k-200k, 2.8% for AGIs over 200k)
Ordinary dividends: $11,262 (reported on 20.7% of returns)
Here:
$11,262
State:
$20,675
(% of AGI for various income ranges: 1.6% for AGIs below $25k, 1.4% for AGIs $25k-50k, 2.0% for AGIs $50k-75k, 1.9% for AGIs $75k-100k, 2.1% for AGIs $100k-200k, 6.1% for AGIs over 200k)
Net capital gain/loss in AGI: +$15,502 (reported on 16.9% of returns)
Here:
+$15,502
State:
+$15,222
(% of AGI for various income ranges: 0.2% for AGIs $25k-50k, 0.6% for AGIs $50k-75k, 1.2% for AGIs $75k-100k, 1.7% for AGIs $100k-200k, 8.7% for AGIs over 200k)
Profit/loss from business: +$12,893 (reported on 13.2% of returns)
Here:
+$12,893
State:
+$9,665
(% of AGI for various income ranges: 4.8% for AGIs below $25k, 1.8% for AGIs $25k-50k, 1.4% for AGIs $50k-75k, 1.8% for AGIs $75k-100k, 2.6% for AGIs $100k-200k, 2.8% for AGIs over 200k)
Taxable individual retirement arrangement distribution: $20,398 (reported on 12.3% of returns)
72903:
$20,398
Arkansas:
$13,644
(% of AGI for various income ranges: 3.6% for AGIs below $25k, 3.2% for AGIs $25k-50k, 3.6% for AGIs $50k-75k, 4.1% for AGIs $75k-100k, 5.0% for AGIs $100k-200k, 3.4% for AGIs over 200k)
Self-employment retirement plans: $24,650 (reported on 0.6% of returns)
72903:
$24,650
Arkansas:
$20,153
(% of AGI for various income ranges: 0.4% for AGIs $100k-200k, 0.3% for AGIs over 200k)
Total itemized deductions: $30,668 (19% of AGI, reported on 28.4% of returns)
Here:
$30,668
State:
$23,276
Here:
19.3% of AGI
State:
19.1% of AGI
(% of AGI for various income ranges: 7.9% for AGIs below $25k, 8.8% for AGIs $25k-50k, 11.0% for AGIs $50k-75k, 12.4% for AGIs $75k-100k, 15.2% for AGIs $100k-200k, 15.4% for AGIs over 200k)
Charity contributions: $8,605 (reported on 24.5% of returns)
Here:
$8,605
State:
$5,996
(% of AGI for various income ranges: 0.9% for AGIs below $25k, 1.9% for AGIs $25k-50k, 2.3% for AGIs $50k-75k, 2.9% for AGIs $75k-100k, 3.7% for AGIs $100k-200k, 4.1% for AGIs over 200k)
Taxes paid: $11,447 (reported on 28.3% of returns)
72903:
$11,447
State:
$7,941
(% of AGI for various income ranges: 1.2% for AGIs below $25k, 1.8% for AGIs $25k-50k, 3.0% for AGIs $50k-75k, 3.8% for AGIs $75k-100k, 5.7% for AGIs $100k-200k, 7.1% for AGIs over 200k)
Earned income credit: $2,204 (reported on 19.7% of returns)
Here:
$2,204
State:
$2,455
(% of AGI for various income ranges: 6.3% for AGIs below $25k, 1.1% for AGIs $25k-50k)
Percentage of individuals using paid preparers for their 2012 taxes: 58.8%
Here:
59%
State:
61%
(% for various income ranges: 52.9% for AGIs below $25k, 57.9% for AGIs $25k-50k, 62.2% for AGIs $50k-75k, 63.0% for AGIs $75k-100k, 67.0% for AGIs $100k-200k, 87.8% for AGIs over 200k)
Averages for the 2004 tax year for zip code 72903, filed in 2005:
Average Adjusted Gross Income (AGI) in 2004: $58,702 (Individual Income Tax Returns)
Here:
$58,702
State:
$39,270
Salary/wage: $43,793 (reported on 82.0% of returns)
Here:
$43,793
State:
$34,079
(% of AGI for various income ranges: 273.2% for AGIs below $10k, 77.4% for AGIs $10k-25k, 78.8% for AGIs $25k-50k, 75.1% for AGIs $50k-75k, 72.8% for AGIs $75k-100k, 46.9% for AGIs over 100k)
Taxable interest for individuals: $2,919 (reported on 44.4% of returns)
This zip code:
$2,919
Arkansas:
$1,904
(% of AGI for various income ranges: 21.3% for AGIs below $10k, 3.2% for AGIs $10k-25k, 2.3% for AGIs $25k-50k, 1.9% for AGIs $50k-75k, 2.1% for AGIs $75k-100k, 2.0% for AGIs over 100k)
Taxable dividends: $5,429 (reported on 27.2% of returns)
Here:
$5,429
State:
$5,995
(% of AGI for various income ranges: 11.3% for AGIs below $10k, 1.7% for AGIs $10k-25k, 1.4% for AGIs $25k-50k, 1.5% for AGIs $50k-75k, 1.9% for AGIs $75k-100k, 3.2% for AGIs over 100k)
Net capital gain/loss: +$31,311 (reported on 22.5% of returns)
Here:
+$31,311
State:
+$10,430
(% of AGI for various income ranges: 3.9% for AGIs below $10k, 0.2% for AGIs $10k-25k, 0.4% for AGIs $25k-50k, 1.2% for AGIs $50k-75k, 1.9% for AGIs $75k-100k, 21.1% for AGIs over 100k)
Profit/loss from business: +$8,934 (reported on 14.7% of returns)
Here:
+$8,934
State:
+$7,823
(% of AGI for various income ranges: 10.5% for AGIs below $10k, 3.0% for AGIs $10k-25k, 1.7% for AGIs $25k-50k, 1.8% for AGIs $50k-75k, 0.8% for AGIs $75k-100k, 2.6% for AGIs over 100k)
IRA payment deduction: $3,472 (reported on 2.9% of returns)
72903:
$3,472
Arkansas:
$3,204
(% of AGI for various income ranges: 0.3% for AGIs $10k-25k, 0.3% for AGIs $25k-50k, 0.3% for AGIs $50k-75k, 0.3% for AGIs $75k-100k, 0.1% for AGIs over 100k)
Self-employed pension: $18,111 (reported on 0.7% of returns)
Here:
$18,111
Arkansas:
$14,742
Total itemized deductions: $22,675 (17% of AGI, reported on 31.7% of returns)
Here:
$22,675
State:
$18,389
Here:
16.7% of AGI
State:
21.0% of AGI
(% of AGI for various income ranges: 28.8% for AGIs below $10k, 8.8% for AGIs $10k-25k, 10.0% for AGIs $25k-50k, 13.0% for AGIs $50k-75k, 15.8% for AGIs $75k-100k, 12.3% for AGIs over 100k)
Charity contributions deductions: $6,644 (5% of AGI, reported on 28.8% of returns)
Here:
$6,644
State:
$4,725
Here:
4.6% of AGI
State:
5.1% of AGI
(% of AGI for various income ranges: 2.8% for AGIs below $10k, 1.6% for AGIs $10k-25k, 2.0% for AGIs $25k-50k, 2.9% for AGIs $50k-75k, 4.0% for AGIs $75k-100k, 3.8% for AGIs over 100k)
Total tax: $11,720 (reported on 73.6% of returns)
72903:
$11,720
State:
$6,047
(% of AGI for various income ranges: 6.9% for AGIs below $10k, 3.7% for AGIs $10k-25k, 6.8% for AGIs $25k-50k, 9.0% for AGIs $50k-75k, 10.3% for AGIs $75k-100k, 20.5% for AGIs over 100k)
Earned income credit: $1,779 (reported on 16.7% of returns)
Here:
$1,779
State:
$1,909
Percentage of individuals using paid preparers for their 2004 taxes: 67.3%
Here:
67%
State:
67%
(% for various income ranges: 60.2% for AGIs below $10k, 69.1% for AGIs $10k-25k, 68.7% for AGIs $25k-50k, 65.5% for AGIs $50k-75k, 67.1% for AGIs $75k-100k, 76.5% for AGIs over 100k)
Likely homosexual households (counted as self-reported same-sex unmarried-partner households)
Lesbian couples: 0.2% of all households
Gay men: 0.0% of all households
Household received Food Stamps/SNAP in the past 12 months: 845 Household did not receive Food Stamps/SNAP in the past 12 months: 10,689
Women who had a birth in the past 12 months: 226 (126 now married, 98 unmarried) Women who did not have a birth in the past 12 months: 5,701 (2,699 now married, 3,003 unmarried)
Housing units in zip code 72903 with a mortgage: 3,346 (362 second mortgage, 340 both second mortgage and home equity loan) Houses without a mortgage: 29
Median monthly owner costs for units with a mortgage: $1,358 Median monthly owner costs for units without a mortgage: $516
Residents with income below the poverty level in 2022:
This zip code:
10.4%
Whole state:
16.8%
Residents with income below 50% of the poverty level in 2022:
This zip code:
5.4%
Whole state:
8.5%
Median number of rooms in houses and condos:
Here:
6.9
State:
6.1
Median number of rooms in apartments:
Here:
4.0
State:
4.3
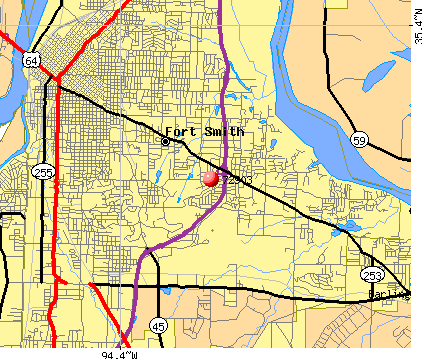
Notable locations in this zip code not listed on our city pages
Notable locations in zip code 72903: Hardscrabble Golf Course (A), Fort Smith Racquet Club (B), Federal Bureau of Investigation (C), 188th Fighter Wing Air National Guard Security Squadron (D), Westark Community College Security (E), Immigration Customs Enforcement (F), West Arkansas Gym (G), Fort Smith Fire Department Station 6 (H), Fort Smith Fire Department Station 7 (I). Display/hide their locations on the map
Shopping Centers: Central Mall Shopping Center (1), Colony Square Shopping Center (2), Green Pointe Shopping Center (3), Park Plaza Shopping Center (4), Stonewall Village Shopping Center (5), Waldron Square Shopping Center (6), Williamsburg Square Shopping Center (7), Town East Shopping Center (8), The Oaks Shopping Center (9). Display/hide their locations on the map
Churches in zip code 72903 include: West Arkansas Church (A), Bethel Lutheran Church (B), Church of Christ (C), Cliff Terrace Assembly of God Church (D), East Side Baptist Church (E), Faith Freewill Baptist Church (F), First Christian Church (G), First Church of Christ Scientist (H), First Cumberland Presbyterian Church (I). Display/hide their locations on the map
Parks in zip code 72903 include: Carol Ann Cross Park (1), Ben Geren Regional Park (2), West Arkansas Regional Park (3), Tilles Park (4), Creekmore Park (5). Display/hide their locations on the map
Tourist attractions (not listed on the city page) : Silverball Game Room (Arcades & Amusements; 5111 Rogers Avenue), B & E Paintball Supplies (Arcades & Amusements; 7320 Rogers Avenue).
3,575 married couples with children.
994 single-parent households (245 men, 749 women).
91.2% of residents of 72903 zip code speak English at home.
5.6% of residents speak Spanish at home (63% very well, 13% well, 7% not well, 18% not at all).
0.9% of residents speak other Indo-European language at home (94% very well, 6% well).
2.0% of residents speak Asian or Pacific Island language at home (49% very well, 12% well, 36% not well, 3% not at all).
0.3% of residents speak other language at home (89% very well, 11% well).
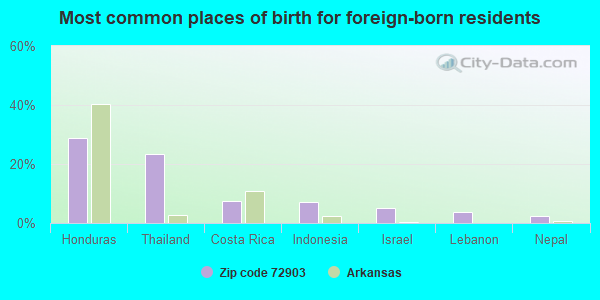
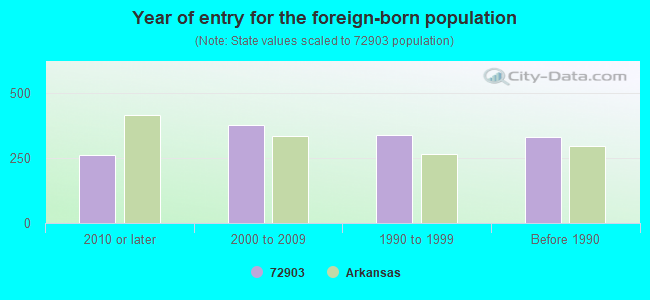
Foreign born population: 1,108 (4.3%) (46.6% of them are naturalized citizens)
Major facilities with environmental interests located in this zip code:
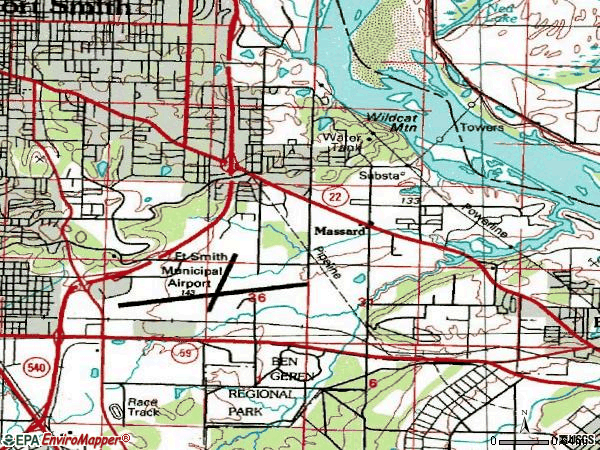
JOHN P. WOODS ELEM. SCHOOL (3201 MASSARD ROAD in FORT SMITH, AR)
(Integrated Compliance Information System) - ICIS-06-2006-6034, ENFORCEMENT/COMPLIANCE ACTIVITY FORMAL ENFORCEMENT ACTION (Integrated Compliance Information System) - ICIS-06-2006-6034, ENFORCEMENT/COMPLIANCE ACTIVITY (National Center for Education Statistics) - STATE ID-6601029 Organizations: FORT SMITH (SCHOOL DISTRICT)
Alternative names: WOODS ELEMENTARY SCHOOL
BRUCE S 66 (5700 ROGERS AVE in FORT SMITH, AR)
(Integrated Compliance Information System) - ICIS-06-1999-0256, FORMAL ENFORCEMENT ACTION STATE MASTER (PDS) - RST-66000186, FACILITY Business SIC classification: GROCERY STORES Organizations: FROST PETROLEUM EQUIPMENT LLC (CONTACT/GENERAL)
Alternative names: BRUCES PHILLIPS 66
KMART 7308 (7434 ROGERS AVE in FT SMITH, AR)
STATE MASTER (PDS) - RST-66000215, FACILITY (Resource Conservation and Recovery Act (tracking hazardous waste)) Business NAICS classification: DISCOUNT DEPARTMENT STORES. Organizations: KMART CORPORATION (CONTACT/GENERAL)
, KMART CORP (CONTACT/OPERATOR)
, ABRAMS PROPERTIES INC (CONTACT/OWNER)
SMITH CHEVROLET-CADILLAC (1215 HWY 71 S in FT SMITH, AR)
STATE MASTER (PDS) - RST-66000335, FACILITY Conditionally Exempt Small Quantity Generators, less than 100 kg/month of hazardous waste (Resource Conservation and Recovery Act (tracking hazardous waste)) - notification HAZARDOUS WASTE BIENNIAL REPORTER (Resource Conservation and Recovery Act (tracking hazardous waste)) Organizations: SMITH CHEVROLET-CADILLAC COMPANY (CONTACT/GENERAL)
, CHARLES BARROW (CONTACT/OPERATOR)
, SMITH JOHN & MARK (CONTACT/OWNER)
Alternative names: SMITH CHEVROLET OLDS CADILLAC
ALLEN TRANSFORMER (6107 ZERO ST in FORT SMITH, AR)
SUPERFUND (Superfund database) (Integrated Compliance Information System) - ICIS-06-1997-0266, FORMAL ENFORCEMENT ACTION, ICIS-06-1981-0011, COMPLIANCE ACTIVITY (Tracking inspections of insecticide, fungicide, and rodenticide, and toxic substances) Business SIC classification: POWER, DISTRIBUTION, AND SPECIALTY TRANSFORMERS; ELECTRICAL AND ELECTRONIC REPAIR SHOPS Alternative names: ALLEN (ARKANSAS) TRANSFORMER SERVICE
FOAMEX, L.P. (4401 S. SAVANNAH in FORT SMITH, AR)
STATE MASTER (PDS) - AIR-1617-AR-1, AIR PROGRAM, WATER-ARR00B804, NPDES STORMWATER PERMIT, WATER-ARR00B805, WATER-ARR00C016, WATER-ARR00C017, AIR-1122-A, AIR PROGRAM, AIR-1122-AR-1, AIR-1617-A, RST-66000080, FACILITY, RST-66000101, (Resource Conservation and Recovery Act (tracking hazardous waste)) TRI REPORTER (Tracking of toxic chemicals releasing facilities) Business SIC classification: PLASTICS FOAM PRODUCTS Organizations: CRAIN SOUTHWEST REBOND (CONTACT/GENERAL)
, FOAMEX LP A DELEWARE LTD PARTNERSHIP (CONTACT/OWNER)
Alternative names: FOAMEX LIMITED PARTNERSHIP
BASELINE DESIGN-CRAIN INDUSTR (6201 STATELINE RD in FORT SMITH, AR)
AIR SYNTHETIC MINOR (AIRS/AFS) STATE MASTER (PDS) - AIR-1536-A, AIR MINOR, RST-66001682, FACILITY (Resource Conservation and Recovery Act (tracking hazardous waste)) Business SIC classification: HOUSEHOLD FURNITURE Organizations: CRAIN HANGER-BUILDING #16 (CONTACT/GENERAL)
, CRAIN INDUSTRIES INC (CONTACT/OWNER)
Alternative names: CRAIN INDUSTRIES INCORPORATED D B A BASELINE DESIGN
EXXON-JON S SERVICE CENTER (5720 ROGERS AVE in FT SMITH, AR)
STATE MASTER (PDS) - RST-66000282, UNDERGROUND STORAGE TANK PROGRAM (Resource Conservation and Recovery Act (tracking hazardous waste)) Organizations: GARDNER, JERRY (CONTACT/GENERAL)
, MORRIS JON (CONTACT/OWNER)
Alternative names: JONS EXXON SERVICE CENTER
ARK AIR NAT GUARD 188TH FIGHT (4850 LEIGH in FORT SMITH, AR) . Federal Facility. U.S. AIR FORCE
STATE MASTER (PDS) - WATER-ARR00C121, NPDES STORMWATER PERMIT, RST-66000031, FACILITY, RST-66001714, HAZARDOUS WASTE BIENNIAL REPORTER (Resource Conservation and Recovery Act (tracking hazardous waste)) Small Quantity Generators, between 100 kg and 1000 kg of hazardous waste/month (Resource Conservation and Recovery Act (tracking hazardous waste)) - notification Organizations: US AIR FORCE-AR AIR NAT L *INA* (CONTACT/GENERAL)
, COL JOHN R DALLAS COMMANDER (CONTACT/OPERATOR)
, FEDERAL GOVERNMENT (CONTACT/OWNER)
Alternative names: AR AIR NATL GUARD / 188FW, AR AIR NATIONAL GUARD 188TH FIGHTER GRP
FEDERAL EXPRESS (4600 PHOENIX in FT SMITH, AR)
STATE MASTER (PDS) - WATER-ARR00C162, NPDES STORMWATER PERMIT (Resource Conservation and Recovery Act (tracking hazardous waste)) Organizations: FEDERAL EXPRESS CORPORATION (CONTACT/OWNER)
ABF FREIGHT SYSTEM INC (3801 OLD GREENWOOD RD in FT SMITH, AR)
STATE MASTER (PDS) - RST-66001621, UNDERGROUND STORAGE TANK PROGRAM Conditionally Exempt Small Quantity Generators, less than 100 kg/month of hazardous waste (Resource Conservation and Recovery Act (tracking hazardous waste)) - notification Organizations: ARKANSAS BEST CORPORATION (CONTACT/GENERAL)
, ABF FREIGHT SYSTEM NC (CONTACT/OWNER)
ARK ARMY NATIONAL GUARD (8400 ZERO ST OMS2 in FORT SMITH, AR) . Federal Facility. U.S. ARMY
STATE MASTER (PDS) - RST-66000327, FACILITY Conditionally Exempt Small Quantity Generators, less than 100 kg/month of hazardous waste (Resource Conservation and Recovery Act (tracking hazardous waste)) - notification Organizations: MILITARY DEPT OF AR, DCSEN-E (CONTACT/GENERAL)
, ARKANSAS MILITARY DEPARTMENT (CONTACT/OWNER)
Alternative names: AR ARMY NATL GUARD-OMS2
SCOTT CONSTRUCTION EQUIPMENT (6100 SOUTH ZERO STREET in FORT SMITH, AR)
National Pollutant Discharge Elimination System NON-MAJOR (Tracking pollutant discharge elimination systems) - permit STATE MASTER (PDS) - WATER-ARG750085, National Pollutant Discharge Elimination System Permit Business SIC classification: CONSTRUCTION AND MINING (EXCEPT PETROLEUM) MACHINERY AND EQUIPMENT Alternative names: SCOTT COMPANIES
Housing units lacking complete plumbing facilities: 1.7% Housing units lacking complete kitchen facilities: 3.2%
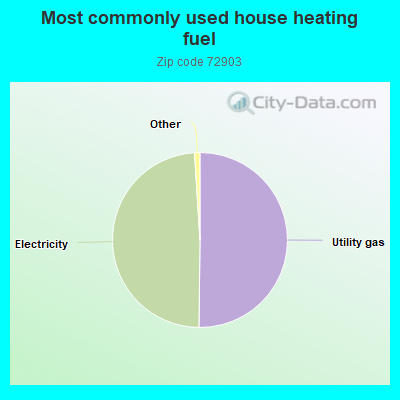
50.2%Utility gas
48.8%Electricity
Population in 1990: 32,809.
Place of birth for U.S.-born residents:
This state: 13,887
Northeast: 615
Midwest: 2,562
South: 5,022
West: 2,607
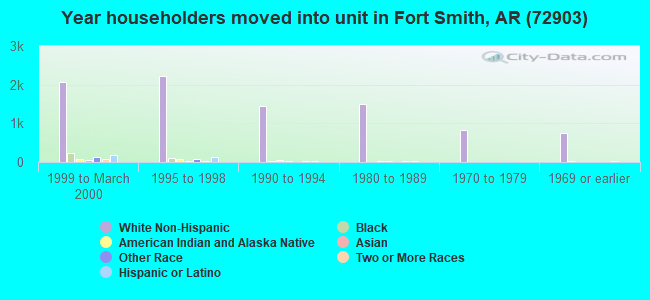
52% of the 72903 zip code residents lived in the same house 5 years ago. Out of people who lived in different houses, 54% lived in this county. Out of people who lived in different counties, 50% lived in Arkansas.
85% of the 72903 zip code residents lived in the same house 1 year ago. Out of people who lived in different houses, 38% moved from this county. Out of people who lived in different houses, 24% moved from different county within same state. Out of people who lived in different houses, 39% moved from different state. Out of people who lived in different houses, 1% moved from abroad.
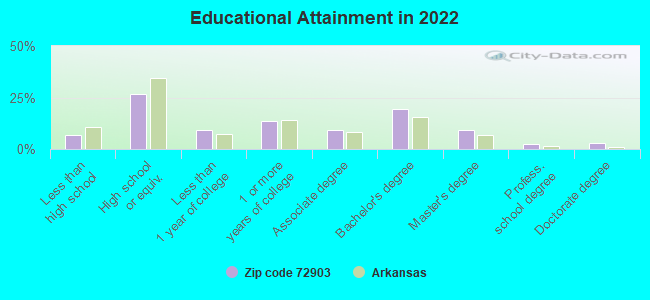
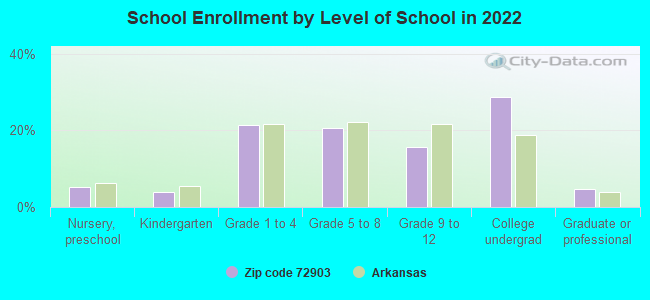
Private vs. public school enrollment:
Students in private schools in grades 1 to 8 (elementary and middle school): 700
Here:
27.6%
Arkansas:
10.5%
Students in private schools in grades 9 to 12 (high school): 1
Here:
0.2%
Arkansas:
8.7%
Students in private undergraduate colleges: 242
Here:
14.3%
Arkansas:
19.4%
Occupation by median earnings in the past 12 months ($)
161,961Legal occupations
102,988Computer and mathematical occupations
102,507Architecture and engineering occupations
97,896Health diagnosing and treating practitioners and other technical occupations
83,196Fire fighting and prevention, and other protective service workers including supervisors
80,888Management occupations
Companies with biggest federal contracts located in this zip code (FORT SMITH, AR):
TRUMAN ARNOLD COMPANIES (5300 AIRPORT BLVD BLDG 7; small business) : $12,588,309 in 4 contractsfrom 2001 to 2006
$6,418,344 with Defense Logistics Agency for Liquid Propellants and Fuels, Petroleum Base. Signed on 2003-11-18. Completion date: 2007-03-31.
$5,530,364, same as above.Signed on 2001-04-01. Completion date: 2004-03-31.
$622,942, same as above.Signed on 2003-11-20. Completion date: 2007-03-31.
$16,659 with Army for Liquid Propellants and Fuels, Petroleum Base. Signed on 2006-04-10. Completion date: 2006-05-05.
BOST, INC (1801 S 74TH ST) : $3,574,790 in 18 contractsfrom 2000 to 2006
Contracts for Clothing, Special Purpose, Household Furnishings, Fire Fighting Equipment by Defense Logistics Agency Signed by year:2000: $698,246; 2001: $990,775; 2002: $541,390; 2003: $454,400; 2004: $0; 2005: $815,903; 2006: $74,076.
Biggest contracts:
$582,000 with Defense Logistics Agency for Clothing, Special Purpose. Signed on 2005-01-18. Completion date: 2005-11-05.
$464,374, same as above.Signed on 2001-05-23. Completion date: 2002-04-18.
$454,400, same as above.Signed on 2003-10-24. Completion date: 2004-09-22.
$441,362, same as above.Signed on 2002-09-11. Completion date: 2003-08-02.
R & R RESOURCES INC (3907 MASSARD RD; small business) 50 employees, $0 revenue. : $333,811 in 9 contractsfrom 2002 to 2006
Contracts for Pyrotechnics, Operation Training Devices, Armament Training Devices, Specialized Ammunition Handling Servicing Equipment, and moreby Army Signed by year:2000: $0; 2001: $0; 2002: $49,958; 2003: $0; 2004: $0; 2005: $258,605; 2006: $25,248.
Biggest contracts:
$239,516 with Army for Pyrotechnics. Signed on 2005-08-05. Completion date: 2005-12-05.
$24,750 with Army for Operation Training Devices. Signed on 2002-09-29. Completion date: 2002-12-30.
$19,089 with Army for Armament Training Devices. Signed on 2005-03-18. Completion date: 2005-04-15.
$16,832 with Army for Specialized Ammunition Handling Servicing Equipment. Taking place in OR. Signed on 2006-05-23. Completion date: 2006-06-29.
FORT SMITH STRUCTURAL, INC (5028 SO 36TH; small business)
$298,900 with Army for Maintenance, Repair or Alteration of Real Property -- Other Administrative Facilities and Service Buildings. Signed on 2001-08-25. Completion date: 2001-08-25.
SPECIALIZED SERVICES (4209 DALLAS ST; small business) : $241,856 in 21 contractsfrom 2000 to 2006
Contracts for Installation of Equipment -- Communication, Detection, and Coherent Radiation Equipment, Maintenance, Repair or Alteration of Real Property -- Office Buildings, Facilities Operations Support Services, Construction of Structures and Facilities -- Restoration of real property, and moreby Army, Air Force, United States Coast Guard (disused code: now 7008), U.S. Coast Guard, and others Signed by year:2000: $43,200; 2001: $0; 2002: $87,328; 2003: $9,630; 2004: $61,940; 2005: $33,765; 2006: $5,993.
Biggest contracts:
$239,973 with Army for Installation of Equipment -- Communication, Detection, and Coherent Radiation Equipment. Taking place in TX. Signed on 2001-07-11. Completion date: 2001-09-30.
$32,300 with Air Force for Maintenance, Repair or Alteration of Real Property -- Office Buildings. Taking place in NM. Signed on 2004-08-09. Completion date: 2004-11-24.
$26,540 with Air Force for Facilities Operations Support Services. Taking place in GA. Signed on 2005-09-24. Completion date: 2005-12-15.
$25,000 with United States Coast Guard (disused code: now 7008) for Construction of Structures and Facilities -- Restoration of real property. Taking place in AK. Signed on 2002-08-15. Completion date: 2002-10-15.
MATLOCK ELECTRIC CO INC (3324 VICKSBURG ST; small business) : $101,990 in 3 contractsfrom 2001 to 2003
$48,761 with Army for Construction of Structures and Facilities -- Other Utilities. Taking place in NM. Signed on 2003-01-21. Completion date: 2003-02-18.
$27,601, same as above.Signed on 2001-06-05. Completion date: 2001-08-31.
$25,628 with Army for Maintenance, Repair or Alteration of Real Property -- Other Utilities. Taking place in NM. Signed on 2003-01-21. Completion date: 2003-02-18.
GOLDEN PARTNERS INC (1801 S WALDRON ROAD) : $39,131 in 2 contractsin 2003
$34,541 with Army for Food Services. Signed on 2003-01-31. Completion date: 2003-02-09.
$4,590 with Army for Food Items For Resale. Signed on 2003-04-16. Completion date: 2003-04-23.
RANDALL FORD INC (5500 ROGERS AVE; small business)
$32,330 with Army for Trucks and Truck Tractors, Wheeled. Signed on 2006-06-12. Completion date: 2006-07-07.
LOCKHART MEDICAL TRANSCRIPTION (5609 HARDSCRABBLE WAY; small business) : $22,147 in 2 contractsfrom 2004 to 2005
$14,672 with Air Force for Transcription Services. Signed on 2005-09-30. Completion date: 2005-09-30.
$7,475, same as above.Signed on 2004-10-01. Completion date: 2005-09-30.
THIELE, MARGARET DDS (3501 SOUTH GARY STREET; small business)
$17,500 with Army for Dentistry Services. Signed on 2005-08-03. Completion date: 2005-09-30.
Top industries in this zip code by the number of employees in 2005:
Health Care and Social Assistance: General Medical and Surgical Hospitals (over 1000 employees: 1 establishment)
Health Care and Social Assistance: Offices of Physicians (except Mental Health Specialists) (250-499: 1, 100-249: 1, 20-49: 5, 10-19: 7, 5-9: 12, 1-4: 28)
Management of Companies and Enterprises: Corporate, Subsidiary, and Regional Managing Offices (500-999: 1, 20-49: 1, 10-19: 1, 1-4: 2)
Health Care and Social Assistance: Nursing Care Facilities (100-249: 3, 50-99: 1, 20-49: 1, 1-4: 2)
People in group quarters in 2010:
450 people in college/university student housing
329 people in nursing facilities/skilled-nursing facilities
59 people in other noninstitutional facilities
16 people in residential treatment centers for juveniles (non-correctional)
10 people in group homes intended for adults
4 people in workers' group living quarters and job corps centers
People in group quarters in 2000:
442 people in nursing homes
260 people in state prisons
96 people in religious group quarters
18 people in residential treatment centers for emotionally disturbed children
12 people in other noninstitutional group quarters
10 people in homes for the mentally retarded
6 people in other group homes
Fatal accident statistics in 2014:
Fatal accident count: 1
Vehicles involved in fatal accidents: 1
Fatal accidents caused by drunken drivers: 1
Fatalities: 1
Persons involved in fatal accidents: 2
Pedestrians involved in fatal accidents: 0
Fatal accident statistics in 2012:
Fatal accident count: 2
Vehicles involved in fatal accidents: 2
Fatal accidents caused by drunken drivers: 2
Fatalities: 2
Persons involved in fatal accidents: 2
Pedestrians involved in fatal accidents: 0
Home Mortgage Disclosure Act Aggregated Statistics For Year 2009 (Based on 4 full and 12 partial tracts)
A) FHA, FSA/RHS & VA Home Purchase Loans
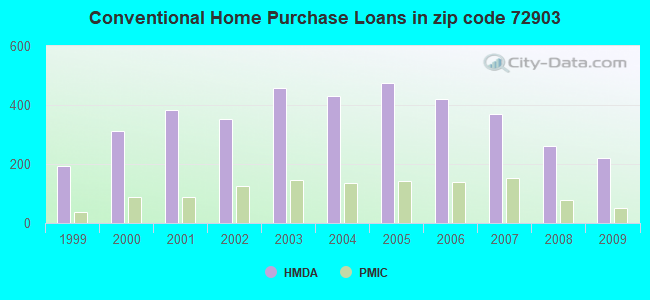
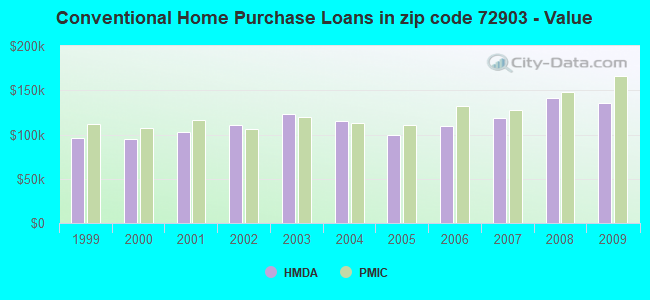
B) Conventional Home Purchase Loans
C) Refinancings
D) Home Improvement Loans
E) Loans on Dwellings For 5+ Families
F) Non-occupant Loans on < 5 Family Dwellings (A B C & D)
G) Loans On Manufactured Home Dwelling (A B C & D)
Number
Average Value
Number
Average Value
Number
Average Value
Number
Average Value
Number
Average Value
Number
Average Value
Number
Average Value
LOANS ORIGINATED
171
$110,785
219
$135,339
711
$141,867
106
$42,244
10
$1,165,681
134
$96,423
7
$4,830
APPLICATIONS APPROVED, NOT ACCEPTED
3
$125,867
9
$332,073
25
$178,795
13
$32,616
0
$0
1
$110,880
0
$0
APPLICATIONS DENIED
29
$99,851
16
$117,607
130
$151,819
25
$25,272
2
$317,755
7
$66,063
2
$22,645
APPLICATIONS WITHDRAWN
15
$111,187
9
$53,514
111
$137,457
10
$29,799
2
$284,310
12
$67,450
2
$23,240
FILES CLOSED FOR INCOMPLETENESS
4
$90,208
0
$0
25
$182,926
2
$9,545
0
$0
1
$106,620
0
$0
Aggregated Statistics For Year 2008 (Based on 4 full and 12 partial tracts)
A) FHA, FSA/RHS & VA Home Purchase Loans
B) Conventional Home Purchase Loans
C) Refinancings
D) Home Improvement Loans
E) Loans on Dwellings For 5+ Families
F) Non-occupant Loans on < 5 Family Dwellings (A B C & D)
G) Loans On Manufactured Home Dwelling (A B C & D)
Number
Average Value
Number
Average Value
Number
Average Value
Number
Average Value
Number
Average Value
Number
Average Value
Number
Average Value
LOANS ORIGINATED
181
$110,287
262
$140,816
429
$141,220
154
$38,764
10
$1,365,265
105
$94,496
0
$0
APPLICATIONS APPROVED, NOT ACCEPTED
5
$125,320
11
$362,643
36
$180,375
13
$26,062
0
$0
15
$443,975
7
$40,709
APPLICATIONS DENIED
28
$90,686
34
$117,051
126
$108,587
46
$26,522
0
$0
21
$108,486
7
$36,583
APPLICATIONS WITHDRAWN
13
$106,735
30
$121,126
82
$145,868
13
$23,259
0
$0
6
$70,867
0
$0
FILES CLOSED FOR INCOMPLETENESS
2
$139,695
9
$188,328
25
$103,643
0
$0
0
$0
4
$80,120
0
$0
Aggregated Statistics For Year 2007 (Based on 4 full and 12 partial tracts)
A) FHA, FSA/RHS & VA Home Purchase Loans
B) Conventional Home Purchase Loans
C) Refinancings
D) Home Improvement Loans
E) Loans on Dwellings For 5+ Families
F) Non-occupant Loans on < 5 Family Dwellings (A B C & D)
G) Loans On Manufactured Home Dwelling (A B C & D)
Number
Average Value
Number
Average Value
Number
Average Value
Number
Average Value
Number
Average Value
Number
Average Value
Number
Average Value
LOANS ORIGINATED
119
$100,560
370
$119,159
456
$137,987
137
$43,573
10
$552,254
160
$114,945
2
$31,260
APPLICATIONS APPROVED, NOT ACCEPTED
3
$125,063
24
$112,570
42
$117,848
11
$19,855
0
$0
4
$53,180
7
$62,060
APPLICATIONS DENIED
10
$98,457
49
$99,390
162
$116,650
71
$22,004
0
$0
25
$71,067
4
$75,260
APPLICATIONS WITHDRAWN
8
$55,595
29
$119,133
61
$108,969
15
$10,540
3
$990,650
8
$53,355
1
$55,900
FILES CLOSED FOR INCOMPLETENESS
0
$0
4
$65,090
20
$106,993
0
$0
0
$0
1
$95,250
0
$0
Aggregated Statistics For Year 2006 (Based on 4 full and 12 partial tracts)
A) FHA, FSA/RHS & VA Home Purchase Loans
B) Conventional Home Purchase Loans
C) Refinancings
D) Home Improvement Loans
E) Loans on Dwellings For 5+ Families
F) Non-occupant Loans on < 5 Family Dwellings (A B C & D)
G) Loans On Manufactured Home Dwelling (A B C & D)
Number
Average Value
Number
Average Value
Number
Average Value
Number
Average Value
Number
Average Value
Number
Average Value
Number
Average Value
LOANS ORIGINATED
117
$96,124
420
$109,328
400
$108,077
216
$39,571
17
$1,456,961
202
$78,160
4
$42,910
APPLICATIONS APPROVED, NOT ACCEPTED
3
$93,197
24
$103,854
65
$163,032
14
$38,351
0
$0
7
$70,407
10
$58,172
APPLICATIONS DENIED
11
$77,173
68
$116,299
147
$137,835
80
$18,907
0
$0
22
$91,210
16
$59,858
APPLICATIONS WITHDRAWN
19
$68,633
39
$131,794
147
$116,057
14
$38,133
0
$0
16
$120,008
0
$0
FILES CLOSED FOR INCOMPLETENESS
2
$51,010
9
$90,153
32
$127,942
1
$113,730
0
$0
2
$51,930
0
$0
Aggregated Statistics For Year 2005 (Based on 4 full and 12 partial tracts)
A) FHA, FSA/RHS & VA Home Purchase Loans
B) Conventional Home Purchase Loans
C) Refinancings
D) Home Improvement Loans
E) Loans on Dwellings For 5+ Families
F) Non-occupant Loans on < 5 Family Dwellings (A B C & D)
G) Loans On Manufactured Home Dwelling (A B C & D)
Number
Average Value
Number
Average Value
Number
Average Value
Number
Average Value
Number
Average Value
Number
Average Value
Number
Average Value
LOANS ORIGINATED
110
$87,860
476
$99,776
531
$131,703
234
$45,491
15
$499,872
177
$81,012
3
$31,300
APPLICATIONS APPROVED, NOT ACCEPTED
0
$0
27
$67,140
38
$139,740
7
$35,599
0
$0
4
$26,442
8
$54,799
APPLICATIONS DENIED
11
$78,004
83
$108,962
226
$105,873
66
$19,065
0
$0
15
$59,821
14
$43,725
APPLICATIONS WITHDRAWN
25
$81,976
73
$110,457
159
$110,917
10
$114,384
0
$0
8
$60,052
0
$0
FILES CLOSED FOR INCOMPLETENESS
8
$76,238
14
$169,833
35
$156,083
1
$19,720
0
$0
4
$116,185
0
$0
Aggregated Statistics For Year 2004 (Based on 4 full and 12 partial tracts)
A) FHA, FSA/RHS & VA Home Purchase Loans
B) Conventional Home Purchase Loans
C) Refinancings
D) Home Improvement Loans
E) Loans on Dwellings For 5+ Families
F) Non-occupant Loans on < 5 Family Dwellings (A B C & D)
G) Loans On Manufactured Home Dwelling (A B C & D)
Number
Average Value
Number
Average Value
Number
Average Value
Number
Average Value
Number
Average Value
Number
Average Value
Number
Average Value
LOANS ORIGINATED
140
$87,682
432
$115,781
700
$92,947
201
$36,322
14
$2,275,017
234
$82,913
2
$18,615
APPLICATIONS APPROVED, NOT ACCEPTED
6
$72,232
33
$97,191
65
$107,836
5
$41,220
0
$0
7
$41,539
7
$31,270
APPLICATIONS DENIED
35
$76,589
88
$84,985
234
$104,753
50
$18,800
0
$0
33
$62,393
21
$35,585
APPLICATIONS WITHDRAWN
18
$97,116
47
$121,824
149
$95,698
16
$52,139
0
$0
9
$75,589
0
$0
FILES CLOSED FOR INCOMPLETENESS
3
$115,343
6
$116,978
49
$86,286
0
$0
0
$0
1
$127,940
0
$0
Aggregated Statistics For Year 2003 (Based on 4 full and 12 partial tracts)
A) FHA, FSA/RHS & VA Home Purchase Loans
B) Conventional Home Purchase Loans
C) Refinancings
D) Home Improvement Loans
E) Loans on Dwellings For 5+ Families
F) Non-occupant Loans on < 5 Family Dwellings (A B C & D)
Number
Average Value
Number
Average Value
Number
Average Value
Number
Average Value
Number
Average Value
Number
Average Value
LOANS ORIGINATED
148
$83,678
458
$122,827
1,324
$114,218
204
$37,987
16
$1,252,500
262
$97,133
APPLICATIONS APPROVED, NOT ACCEPTED
2
$68,655
27
$90,446
102
$123,845
6
$80,973
0
$0
7
$51,136
APPLICATIONS DENIED
14
$91,557
54
$100,817
263
$91,008
43
$21,077
0
$0
28
$64,888
APPLICATIONS WITHDRAWN
14
$88,721
47
$106,464
142
$90,568
18
$28,568
0
$0
17
$71,332
FILES CLOSED FOR INCOMPLETENESS
4
$44,938
10
$82,027
40
$85,666
1
$71,080
0
$0
1
$91,020
Aggregated Statistics For Year 2002 (Based on 4 full and 12 partial tracts)
A) FHA, FSA/RHS & VA Home Purchase Loans
B) Conventional Home Purchase Loans
C) Refinancings
D) Home Improvement Loans
E) Loans on Dwellings For 5+ Families
F) Non-occupant Loans on < 5 Family Dwellings (A B C & D)
Number
Average Value
Number
Average Value
Number
Average Value
Number
Average Value
Number
Average Value
Number
Average Value
LOANS ORIGINATED
157
$79,623
354
$110,241
907
$117,196
249
$26,811
12
$1,643,640
216
$106,599
APPLICATIONS APPROVED, NOT ACCEPTED
4
$85,590
25
$60,684
110
$123,579
21
$18,059
0
$0
11
$427,310
APPLICATIONS DENIED
8
$84,791
60
$84,449
180
$105,831
60
$13,943
0
$0
15
$138,487
APPLICATIONS WITHDRAWN
20
$64,007
28
$82,679
115
$95,244
15
$19,179
0
$0
13
$42,917
FILES CLOSED FOR INCOMPLETENESS
2
$63,480
6
$75,702
41
$86,283
0
$0
0
$0
5
$133,478
Aggregated Statistics For Year 2001 (Based on 4 full and 12 partial tracts)
A) FHA, FSA/RHS & VA Home Purchase Loans
B) Conventional Home Purchase Loans
C) Refinancings
D) Home Improvement Loans
E) Loans on Dwellings For 5+ Families
F) Non-occupant Loans on < 5 Family Dwellings (A B C & D)
Number
Average Value
Number
Average Value
Number
Average Value
Number
Average Value
Number
Average Value
Number
Average Value
LOANS ORIGINATED
213
$78,164
382
$103,330
652
$117,989
234
$28,426
23
$749,613
125
$114,397
APPLICATIONS APPROVED, NOT ACCEPTED
4
$73,485
22
$77,255
79
$80,362
4
$21,035
0
$0
2
$56,025
APPLICATIONS DENIED
10
$60,251
97
$46,106
204
$75,826
81
$14,183
0
$0
28
$86,408
APPLICATIONS WITHDRAWN
15
$59,684
43
$80,721
168
$90,358
13
$44,232
0
$0
16
$70,229
FILES CLOSED FOR INCOMPLETENESS
0
$0
2
$88,635
34
$150,429
2
$20,905
0
$0
0
$0
Aggregated Statistics For Year 2000 (Based on 4 full and 12 partial tracts)
A) FHA, FSA/RHS & VA Home Purchase Loans
B) Conventional Home Purchase Loans
C) Refinancings
D) Home Improvement Loans
F) Non-occupant Loans on < 5 Family Dwellings (A B C & D)
Number
Average Value
Number
Average Value
Number
Average Value
Number
Average Value
Number
Average Value
LOANS ORIGINATED
179
$71,033
311
$94,996
204
$96,619
255
$20,328
98
$36,309
APPLICATIONS APPROVED, NOT ACCEPTED
14
$41,471
22
$43,145
42
$107,660
16
$24,499
4
$68,265
APPLICATIONS DENIED
18
$52,837
125
$57,644
194
$61,988
77
$20,126
10
$69,738
APPLICATIONS WITHDRAWN
27
$68,203
26
$82,358
122
$66,091
29
$22,445
5
$40,044
FILES CLOSED FOR INCOMPLETENESS
0
$0
1
$213,290
12
$74,108
0
$0
0
$0
Aggregated Statistics For Year 1999 (Based on 2 full and 7 partial tracts)
A) FHA, FSA/RHS & VA Home Purchase Loans
B) Conventional Home Purchase Loans
C) Refinancings
D) Home Improvement Loans
E) Loans on Dwellings For 5+ Families
F) Non-occupant Loans on < 5 Family Dwellings (A B C & D)
2003 - 2018 National Fire Incident Reporting System (NFIRS) incidents
According to the data from the years 2003 - 2018 the average number of fires per year is 70. The highest number of reported fires - 111 took place in 2006, and the least - 45 in 2018. The data has a dropping trend.
When looking into fire subcategories, the most reports belonged to: Outside Fires (39.6%), and Structure Fires (37.4%).
Fire incident types reported to NFIRS in Zip Code 72903


 Nearest zip codes: 72901, 72908, 72923, 72904, 74901, 72916.


 According to the data from the years 2003 - 2018 the average number of fires per year is 70. The highest number of reported fires - 111 took place in 2006, and the least - 45 in 2018. The data has a dropping trend.
 When looking into fire subcategories, the most reports belonged to: Outside Fires (39.6%), and Structure Fires (37.4%).