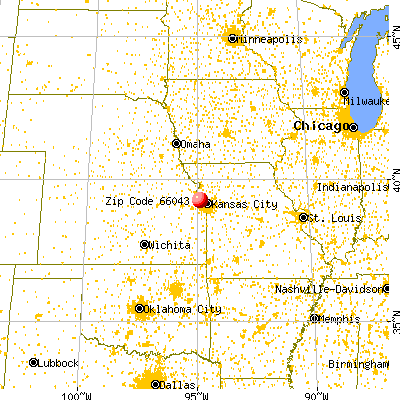
Estimated zip code population in 2022: 10,688 Zip code population in 2010: 10,787 Zip code population in 2000: 9,409
Houses and condos: 3,586 Renter-occupied apartments: 684
% of renters here:
20%
State:
32%
March 2022 cost of living index in zip code 66043: 86.3 (less than average, U.S. average is 100)
Land area: 13.1 sq. mi. Water area: 0.6 sq. mi.
Population density: 815 people per square mile
(low).
OSM Map
General Map
Google Map
MSN Map
OSM Map
General Map
Google Map
MSN Map
OSM Map
General Map
Google Map
MSN Map
OSM Map
General Map
Google Map
MSN Map
Please wait while loading the map...
Real estate property taxes paid for housing units in 2022:
This zip code:
1.3% ($3,373)
Kansas:
1.2% ($2,578)
Median real estate property taxes paid for housing units with mortgages in 2022: $3,743 (1.4%) Median real estate property taxes paid for housing units with no mortgage in 2022: $2,838 (1.2%)
Business Search- 14 Million verified businesses
Males: 6,453
(60.4%)
Females: 4,231
(39.6%)
For population 25 years and over in 66043:
High school or higher: 93.9%
Bachelor's degree or higher: 38.2%
Graduate or professional degree: 17.4%
Unemployed: 2.8%
Mean travel time to work (commute): 19.7 minutes
For population 15 years and over in 66043:
Never married: 36.6%
Now married: 45.5%
Separated: 1.2%
Widowed: 5.9%
Divorced: 10.8%
Zip code 66043 compared to state average:
Black race population percentage above state average.
Hispanic race population percentage below state average.
Foreign-born population percentage below state average.
Renting percentage below state average.
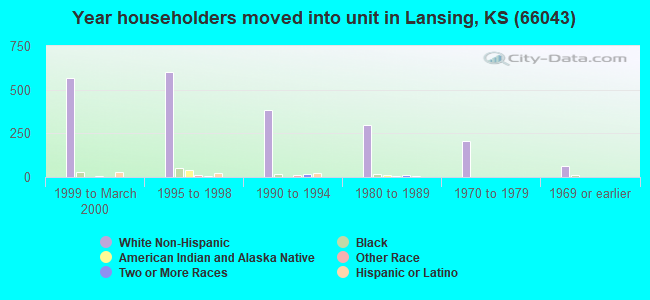
Length of stay since moving in significantly above state average.
Estimated median house/condo value in 2022: $256,258
66043:
$256,258
Kansas:
$206,600
According to our research of Kansas and other state lists, there were 31 registered sex offenders living in 66043 zip code as of May 26, 2024. The ratio of all residents to sex offenders in zip code 66043 is 363 to 1. The ratio of registered sex offenders to all residents in this zip code is lower than the state average.
Median resident age:
This zip code:
39.6 years
Kansas median age:
37.6 years
Average household size:
This zip code:
2.6 people
Kansas:
2.4 people
Averages for the 2020 tax year for zip code 66043, filed in 2021:
Average Adjusted Gross Income (AGI) in 2020: $67,860 (Individual Income Tax Returns)
Here:
$67,860
State:
$72,721
Salary/wage: $57,363 (reported on 83.1% of returns)
Here:
$57,363
State:
$58,641
(% of AGI for various income ranges: 1249.1% for AGIs below $25k, 3667.2% for AGIs $25k-50k, 5908.0% for AGIs $50k-75k, 8565.4% for AGIs $75k-100k, 16035.8% for AGIs $100k-200k, 48318.3% for AGIs over 200k)
Taxable interest for individuals: $872 (reported on 32.4% of returns)
This zip code:
$872
Kansas:
$1,625
(% of AGI for various income ranges: 10.9% for AGIs below $25k, 22.4% for AGIs $25k-50k, 33.3% for AGIs $50k-75k, 49.5% for AGIs $75k-100k, 90.8% for AGIs $100k-200k, 286.7% for AGIs over 200k)
Ordinary dividends: $3,425 (reported on 19.3% of returns)
Here:
$3,425
State:
$7,290
(% of AGI for various income ranges: 19.6% for AGIs below $25k, 18.5% for AGIs $25k-50k, 63.1% for AGIs $50k-75k, 107.0% for AGIs $75k-100k, 245.0% for AGIs $100k-200k, 1106.7% for AGIs over 200k)
Net capital gain/loss in AGI: +$8,315 (reported on 16.4% of returns)
Here:
+$8,315
State:
+$20,511
(% of AGI for various income ranges: 6.7% for AGIs below $25k, 17.6% for AGIs $25k-50k, 32.5% for AGIs $50k-75k, 156.5% for AGIs $75k-100k, 383.3% for AGIs $100k-200k, 5358.3% for AGIs over 200k)
Profit/loss from business: +$5,976 (reported on 9.3% of returns)
Here:
+$5,976
State:
+$13,852
(% of AGI for various income ranges: 47.9% for AGIs below $25k, 42.3% for AGIs $25k-50k, 71.0% for AGIs $50k-75k, 108.4% for AGIs $75k-100k, 139.4% for AGIs $100k-200k, 420.0% for AGIs over 200k)
Taxable individual retirement arrangement distribution: $20,070 (reported on 8.2% of returns)
66043:
$20,070
Kansas:
$19,921
(% of AGI for various income ranges: 31.1% for AGIs below $25k, 79.4% for AGIs $25k-50k, 131.2% for AGIs $50k-75k, 193.5% for AGIs $75k-100k, 425.0% for AGIs $100k-200k, 4868.3% for AGIs over 200k)
Total itemized deductions: $30,643 (reported on 6.2% of returns)
Here:
$30,643
State:
$36,939
(% of AGI for various income ranges: 151.1% for AGIs $25k-50k, 122.2% for AGIs $50k-75k, 318.1% for AGIs $75k-100k, 599.0% for AGIs $100k-200k, 4118.3% for AGIs over 200k)
Charity contributions: $12,150 (reported on 4.9% of returns)
Here:
$12,150
State:
$15,443
(% of AGI for various income ranges: 14.4% for AGIs $25k-50k, 27.1% for AGIs $50k-75k, 68.4% for AGIs $75k-100k, 203.5% for AGIs $100k-200k, 1850.0% for AGIs over 200k)
Taxes paid: $7,937 (reported on 6.0% of returns)
66043:
$7,937
State:
$8,001
(% of AGI for various income ranges: 27.5% for AGIs $25k-50k, 36.5% for AGIs $50k-75k, 79.7% for AGIs $75k-100k, 174.0% for AGIs $100k-200k, 900.0% for AGIs over 200k)
Earned income credit: $2,273 (reported on 12.2% of returns)
Here:
$2,273
State:
$2,267
(% of AGI for various income ranges: 74.8% for AGIs below $25k, 72.0% for AGIs $25k-50k)
Percentage of individuals using paid preparers for their 2020 taxes: 91.6%
Here:
92%
State:
95%
(% for various income ranges: 82.4% for AGIs below $25k, 95.9% for AGIs $25k-50k, 95.4% for AGIs $50k-75k, 96.0% for AGIs $75k-100k, 94.3% for AGIs $100k-200k, 94.7% for AGIs over 200k)
Averages for the 2012 tax year for zip code 66043, filed in 2013:
Average Adjusted Gross Income (AGI) in 2012: $59,897 (Individual Income Tax Returns)
Here:
$59,897
State:
$60,095
Salary/wage: $49,626 (reported on 88.5% of returns)
Here:
$49,626
State:
$48,770
(% of AGI for various income ranges: 82.1% for AGIs below $25k, 80.8% for AGIs $25k-50k, 77.7% for AGIs $50k-75k, 78.2% for AGIs $75k-100k, 72.2% for AGIs $100k-200k, 53.0% for AGIs over 200k)
Taxable interest for individuals: $794 (reported on 35.6% of returns)
This zip code:
$794
Kansas:
$1,506
(% of AGI for various income ranges: 0.7% for AGIs below $25k, 0.7% for AGIs $25k-50k, 0.6% for AGIs $50k-75k, 0.5% for AGIs $75k-100k, 0.4% for AGIs $100k-200k, 0.2% for AGIs over 200k)
Ordinary dividends: $2,861 (reported on 20.6% of returns)
Here:
$2,861
State:
$6,093
(% of AGI for various income ranges: 0.6% for AGIs below $25k, 0.6% for AGIs $25k-50k, 0.6% for AGIs $50k-75k, 0.8% for AGIs $75k-100k, 1.0% for AGIs $100k-200k, 2.3% for AGIs over 200k)
Net capital gain/loss in AGI: +$2,940 (reported on 14.5% of returns)
Here:
+$2,940
State:
+$14,598
(% of AGI for various income ranges: 2.1% for AGIs below $25k, 0.1% for AGIs $50k-75k, 0.2% for AGIs $75k-100k, 0.6% for AGIs $100k-200k, 3.6% for AGIs over 200k)
Profit/loss from business: +$7,374 (reported on 9.8% of returns)
Here:
+$7,374
State:
+$12,554
(% of AGI for various income ranges: 2.9% for AGIs below $25k, 1.4% for AGIs $25k-50k, 1.2% for AGIs $50k-75k, 0.8% for AGIs $75k-100k, 1.4% for AGIs $100k-200k)
Taxable individual retirement arrangement distribution: $11,939 (reported on 8.4% of returns)
66043:
$11,939
Kansas:
$14,098
(% of AGI for various income ranges: 2.1% for AGIs below $25k, 1.6% for AGIs $25k-50k, 1.6% for AGIs $50k-75k, 1.9% for AGIs $75k-100k, 2.1% for AGIs $100k-200k)
Total itemized deductions: $20,267 (18% of AGI, reported on 34.9% of returns)
Here:
$20,267
State:
$23,678
Here:
18.5% of AGI
State:
18.9% of AGI
(% of AGI for various income ranges: 5.7% for AGIs below $25k, 8.7% for AGIs $25k-50k, 11.5% for AGIs $50k-75k, 11.4% for AGIs $75k-100k, 14.0% for AGIs $100k-200k, 12.1% for AGIs over 200k)
Charity contributions: $3,927 (reported on 28.3% of returns)
Here:
$3,927
State:
$5,321
(% of AGI for various income ranges: 0.5% for AGIs below $25k, 0.8% for AGIs $25k-50k, 1.4% for AGIs $50k-75k, 1.7% for AGIs $75k-100k, 2.5% for AGIs $100k-200k, 2.3% for AGIs over 200k)
Taxes paid: $7,730 (reported on 34.9% of returns)
66043:
$7,730
State:
$9,548
(% of AGI for various income ranges: 1.1% for AGIs below $25k, 2.1% for AGIs $25k-50k, 3.8% for AGIs $50k-75k, 4.0% for AGIs $75k-100k, 5.7% for AGIs $100k-200k, 6.3% for AGIs over 200k)
Earned income credit: $2,133 (reported on 14.1% of returns)
Here:
$2,133
State:
$2,212
(% of AGI for various income ranges: 5.2% for AGIs below $25k, 1.2% for AGIs $25k-50k)
Percentage of individuals using paid preparers for their 2012 taxes: 43.6%
Here:
44%
State:
56%
(% for various income ranges: 34.6% for AGIs below $25k, 48.2% for AGIs $25k-50k, 51.8% for AGIs $50k-75k, 44.9% for AGIs $75k-100k, 47.9% for AGIs $100k-200k, 60.0% for AGIs over 200k)
Averages for the 2004 tax year for zip code 66043, filed in 2005:
Average Adjusted Gross Income (AGI) in 2004: $47,059 (Individual Income Tax Returns)
Here:
$47,059
State:
$45,726
Salary/wage: $41,912 (reported on 88.8% of returns)
Here:
$41,912
State:
$40,112
(% of AGI for various income ranges: 100.0% for AGIs below $10k, 78.3% for AGIs $10k-25k, 80.3% for AGIs $25k-50k, 84.2% for AGIs $50k-75k, 81.7% for AGIs $75k-100k, 73.5% for AGIs over 100k)
Taxable interest for individuals: $1,059 (reported on 46.7% of returns)
This zip code:
$1,059
Kansas:
$1,749
(% of AGI for various income ranges: 2.8% for AGIs below $10k, 1.9% for AGIs $10k-25k, 1.2% for AGIs $25k-50k, 0.8% for AGIs $50k-75k, 1.0% for AGIs $75k-100k, 0.9% for AGIs over 100k)
Taxable dividends: $1,582 (reported on 23.8% of returns)
Here:
$1,582
State:
$3,066
(% of AGI for various income ranges: 1.4% for AGIs below $10k, 0.7% for AGIs $10k-25k, 0.5% for AGIs $25k-50k, 0.8% for AGIs $50k-75k, 0.7% for AGIs $75k-100k, 1.0% for AGIs over 100k)
Net capital gain/loss: +$5,003 (reported on 16.2% of returns)
Here:
+$5,003
State:
+$7,555
(% of AGI for various income ranges: -0.9% for AGIs below $10k, 0.5% for AGIs $10k-25k, 0.3% for AGIs $25k-50k, 0.3% for AGIs $50k-75k, 0.6% for AGIs $75k-100k, 4.1% for AGIs over 100k)
Profit/loss from business: +$7,114 (reported on 10.4% of returns)
Here:
+$7,114
State:
+$9,571
(% of AGI for various income ranges: 3.6% for AGIs below $10k, 1.2% for AGIs $10k-25k, 1.7% for AGIs $25k-50k, 1.1% for AGIs $50k-75k, 1.2% for AGIs $75k-100k, 1.9% for AGIs over 100k)
IRA payment deduction: $2,739 (reported on 3.0% of returns)
66043:
$2,739
Kansas:
$2,922
(% of AGI for various income ranges: 0.6% for AGIs below $10k, 0.3% for AGIs $25k-50k, 0.2% for AGIs $50k-75k, 0.1% for AGIs $75k-100k, 0.1% for AGIs over 100k)
Self-employed pension: $12,500 (reported on 0.3% of returns)
Here:
$12,500
Kansas:
$14,209
Total itemized deductions: $17,281 (20% of AGI, reported on 38.0% of returns)
Here:
$17,281
State:
$18,779
Here:
20.4% of AGI
State:
20.5% of AGI
(% of AGI for various income ranges: 6.1% for AGIs below $10k, 7.2% for AGIs $10k-25k, 11.5% for AGIs $25k-50k, 14.8% for AGIs $50k-75k, 15.9% for AGIs $75k-100k, 15.1% for AGIs over 100k)
Charity contributions deductions: $2,723 (3% of AGI, reported on 33.8% of returns)
Here:
$2,723
State:
$3,892
Here:
3.1% of AGI
State:
4.0% of AGI
(% of AGI for various income ranges: 0.4% for AGIs below $10k, 0.8% for AGIs $10k-25k, 1.4% for AGIs $25k-50k, 1.7% for AGIs $50k-75k, 2.1% for AGIs $75k-100k, 2.5% for AGIs over 100k)
Total tax: $6,171 (reported on 75.3% of returns)
66043:
$6,171
State:
$7,203
(% of AGI for various income ranges: 1.6% for AGIs below $10k, 3.7% for AGIs $10k-25k, 6.3% for AGIs $25k-50k, 7.5% for AGIs $50k-75k, 9.7% for AGIs $75k-100k, 14.4% for AGIs over 100k)
Earned income credit: $1,495 (reported on 12.3% of returns)
Here:
$1,495
State:
$1,674
Percentage of individuals using paid preparers for their 2004 taxes: 52.1%
Here:
52%
State:
63%
(% for various income ranges: 35.3% for AGIs below $10k, 50.1% for AGIs $10k-25k, 63.0% for AGIs $25k-50k, 60.5% for AGIs $50k-75k, 56.1% for AGIs $75k-100k, 54.1% for AGIs over 100k)
Household received Food Stamps/SNAP in the past 12 months: 295 Household did not receive Food Stamps/SNAP in the past 12 months: 3,187
Women who had a birth in the past 12 months: 49 (32 now married, 16 unmarried) Women who did not have a birth in the past 12 months: 1,854 (757 now married, 1,098 unmarried)
Housing units in zip code 66043 with a mortgage: 1,920 (123 second mortgage, 90 both second mortgage and home equity loan) Median monthly owner costs for units with a mortgage: $1,907 Median monthly owner costs for units without a mortgage: $604
Residents with income below the poverty level in 2022:
This zip code:
4.9%
Whole state:
12.0%
Residents with income below 50% of the poverty level in 2022:
This zip code:
1.8%
Whole state:
6.4%
Median number of rooms in houses and condos:
Here:
7.8
State:
6.9
Median number of rooms in apartments:
Here:
4.7
State:
4.4
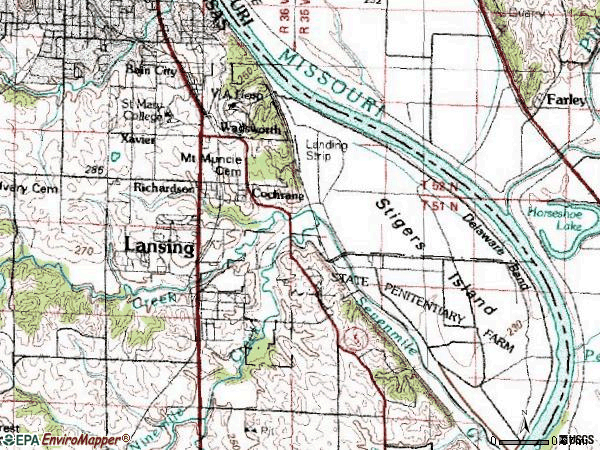
Notable locations in this zip code not listed on our city pages
Notable locations in zip code 66043: Leavenworth Country Club (A), Lansing Light Industrial Park (B), Lansing Business Center (C), Lansing Wastewater Treatment Plant (D), Lansing Police Department (E), Lansing Correctional Facility (F), Lansing Historical Museum (G), City of Lansing Administrative Offices (H), Lansing Community Library (I), Kansas Historical Museum (J), Twin Oaks Assisted Living Facility (K), Colonial Manor Nursing and Care Center (L), Twin Oaks Retirement Center (M), Leavenworth County Fire District 1 Station 1 (N), Lansing City Hall (O). Display/hide their locations on the map
Churches in zip code 66043 include: Saint Francis de Sales Church (A), Lansing Missionary Baptist Church (B), Lansing United Methodist Church (C). Display/hide their locations on the map
In group quarters: 1,623 (-1 institutionalized population)
Size of family households: 1,037 2-persons, 591 3-persons, 492 4-persons, 177 5-persons, 183 6-persons, 23 7-or-more-persons
Size of nonfamily households: 860 1-person, 98 2-persons, 17 4-persons
1,738 married couples with children.
563 single-parent households (172 men, 391 women).
94.8% of residents of 66043 zip code speak English at home.
2.5% of residents speak Spanish at home (87% very well, 12% well, 1% not well).
1.2% of residents speak other Indo-European language at home (50% very well, 20% not well, 30% not at all).
0.7% of residents speak Asian or Pacific Island language at home (31% very well, 69% well).
0.9% of residents speak other language at home (91% very well, 9% well).
Foreign born population: 403 (3.8%) (55.0% of them are naturalized citizens)
This zip code:
3.8%
Whole state:
7.1%
22%Austria
11%Grenada
9%Malaysia
9%Iraq
9%Honduras
7%France
6%Haiti
20%English
16%German
10%American
9%European
7%Irish
4%Jamaican
2%Dutch
Year of entry for the foreign-born population
1932010 or later
1612000 to 2009
851990 to 1999
347Before 1990
Major facilities with environmental interests located in this zip code:
LANSING CORRECTIONAL FACILITY (301 EAST KANSAS STREET in LANSING, KS)
AIR SYNTHETIC MINOR (AIRS/AFS) SUPERFUND (Superfund database) STATE MASTER (Kansas Facility Profiler) - TANKS-00247, UNDERGROUND STORAGE TANK PROGRAM, ISTEPS-10300001, AIR MINOR, ISL-C405200028, STATE CLEANUP SITE STATE MASTER (Kansas Facility Profiler) - SOLWASTE-783, REFUSE DISPOSAL COMPLIANCE ACTIVITY (Tracking inspections of insecticide, fungicide, and rodenticide, and toxic substances) CRITERIA AND HAZARDOUS AIR POLLUTANT INVENTORY (Inventory of air pollution sources) COMMUNITY WATER SYSTEM (SDWIS) - SDWIS-KS2010312 1T, WATER TREATMENT PLANT Business SIC and NAICS classification: CORRECTIONAL INSTITUTIONS Organizations: KANSAS DEPARTMENT OF CORRECTIONS (CONTACT/OWNER)
Alternative names: MERCURY-LANSING CORRECTIONAL FACILITY MAXIMUM SECURITY MEDICAL CLINIC
LEAVENWORTH COUNTY COOPERATIVE (1205 N MAIN in LANSING, KS)
STATE MASTER (Kansas Facility Profiler) - TANKS-02717, UNDERGROUND STORAGE TANK PROGRAM STATE MASTER (Kansas Facility Profiler) - RTK-LV00008, EPCRA COMPLIANCE ACTIVITY (Tracking inspections of insecticide, fungicide, and rodenticide, and toxic substances) (Resource Conservation and Recovery Act (tracking hazardous waste)) Business SIC classification: FARM SUPPLIES Alternative names: LEAVENWORTH CO COOP, LEAVENWORTH COUNTY COOP ASSN, LEAVENWORTH COUNTY COOP-LANSING
7-ELEVEN #19930 (501 NORTH MAIN STREET in LANSING, KS)
STATE MASTER (Kansas Facility Profiler) - TANKS-26000, UNDERGROUND STORAGE TANK PROGRAM, RTK-LV00147, EPCRA (Resource Conservation and Recovery Act (tracking hazardous waste)) Business SIC classification: GASOLINE SERVICE STATIONS Organizations: 7-ELEVEN INC (CONTACT/OPERATOR)
, THE SOUTHLAND CORP (CONTACT/OPERATOR)
, 7-ELEVEN, INC. - %R. FULENCHEK (OWNER/OPERATOR)
, 7-ELEVEN INC (RTK PARENT ORGANIZATION)
Alternative names: 7-ELEVEN 19930
KANSAS CORRECTIONAL INDUSTRIES (4TH STREET & KANSAS STREET in LANSING, KS)
AIR MAJOR (AIRS/AFS) COMPLIANCE ACTIVITY (Tracking inspections of insecticide, fungicide, and rodenticide, and toxic substances) National Pollutant Discharge Elimination System NON-MAJOR (Tracking pollutant discharge elimination systems) - permit HAZARDOUS WASTE BIENNIAL REPORTER (Resource Conservation and Recovery Act (tracking hazardous waste)) Large Quantity Generators, more that 1000 kg of hazardous waste/month (Resource Conservation and Recovery Act (tracking hazardous waste)) - notification Business SIC classification: HOGS; PAINTS, VARNISHES, LACQUERS, ENAMELS, AND ALLIED PRODUCTS Business NAICS classification: COMMERCIAL SCREEN PRINTING.; SOAP AND OTHER DETERGENT MANUFACTURING.; ALL OTHER MISCELLANEOUS FABRICATED METAL PRODUCT MANUFACTURING. Organizations: STATE OF KANSAS (CONTACT/OWNER)
Alternative names: KANSAS STATE PENITENTARY, KANSAS STATE PENITENTIARY
LANSING AMOCO (200 N MAIN in LANSING, KS)
STATE MASTER (Kansas Facility Profiler) - TANKS-25198, UNDERGROUND STORAGE TANK PROGRAM (Resource Conservation and Recovery Act (tracking hazardous waste)) Organizations: JIM DRISCOLL (CONTACT/OPERATOR)
, VINCENT & FRANCES MCEVOY (CONTACT/OWNER)
, MCEVOY TRUST, VINCENT D. & FRA (OWNER/OPERATOR)
J & F DISPOSAL INC (100 AMERICAN AVE in LANSING, KS)
STATE MASTER (Kansas Facility Profiler) - TANKS-25541, UNDERGROUND STORAGE TANK PROGRAM (Resource Conservation and Recovery Act (tracking hazardous waste)) Organizations: LARRY FULTZ (CONTACT/OWNER)
LANSING, CITY OF (800 1ST TER in LANSING, KS)
STATE MASTER (Kansas Facility Profiler) - WWT-M-MO11-OO02, WASTEWATER FACILITY National Pollutant Discharge Elimination System MAJOR (Tracking pollutant discharge elimination systems) - permit Business SIC classification: SEWERAGE SYSTEMS Organizations: LANSICG. CITY OF (CONTACT/OWNER)
Alternative names: LANSICG. CITY OF, LANSING WWTP
LANSING ELEM K-3 (210 EAST MARY STREET in LANSING, KS)
(National Center for Education Statistics) - STATE ID-7428
LANSING HIGH 9-12 (220 LION LANE in LANSING, KS)
(National Center for Education Statistics) - STATE ID-7426
LANSING INTERMEDIATE 4-5TH (300 E OLIVE in LANSING, KS)
(National Center for Education Statistics) - STATE ID-7422
LANSING MIDDLE 6-8 (509 W IDA ST in LANSING, KS)
(National Center for Education Statistics) - STATE ID-7420
TRACTOR SUPPLY COMPANY (1111 N MAIN ST, HWY 7 AND 73 in LANSING, KS)
(Integrated Compliance Information System) - ICIS-07-2003-0102, FORMAL ENFORCEMENT ACTION
ARAMARK UNIFORM & CAREER APPAREL (123 AMERICAN AVE in LANSING, KS)
(Resource Conservation and Recovery Act (tracking hazardous waste)) Business NAICS classification: INDUSTRIAL LAUNDERERS. Organizations: ARAMARK UNIFORM AND CAREER APPAREL (CONTACT/OPERATOR)
Housing units lacking complete plumbing facilities: 1.0% Housing units lacking complete kitchen facilities: 1.3%
80.4%Utility gas
18.4%Electricity
0.9%Bottled, tank, or LP gas
Population in 1990: 8,145. Population change in the 1990s: +1,264 (+15.5%).
Place of birth for U.S.-born residents:
This state: 4,847
Northeast: 574
Midwest: 1,836
South: 1,528
West: 1,094
48% of the 66043 zip code residents lived in the same house 5 years ago. Out of people who lived in different houses, 39% lived in this county. Out of people who lived in different counties, 50% lived in Kansas.
78% of the 66043 zip code residents lived in the same house 1 year ago. Out of people who lived in different houses, 22% moved from this county. Out of people who lived in different houses, 50% moved from different county within same state. Out of people who lived in different houses, 22% moved from different state. Out of people who lived in different houses, 7% moved from abroad.
Private vs. public school enrollment:
Students in private schools in grades 1 to 8 (elementary and middle school): 111
Here:
10.1%
Kansas:
14.1%
Students in private schools in grades 9 to 12 (high school): 20
Here:
3.1%
Kansas:
10.8%
Students in private undergraduate colleges: 17
Here:
3.0%
Kansas:
15.4%
Occupation by median earnings in the past 12 months ($)
96,723Management occupations
93,757Health diagnosing and treating practitioners and other technical occupations
86,011Business and financial operations occupations
85,682Computer and mathematical occupations
68,009Installation, maintenance, and repair occupations
52,071Community and social service occupations
Companies with biggest federal contracts located in this zip code:
CONDOTELS, INC (801 EISENHOWER ROAD in LANSING, KS; small business) : $559,040 in 6 contractsfrom 2000 to 2002
Contracts for Lodging - Hotel/Motel by Army Signed by year:2000: $151,875; 2001: $228,195; 2002: $178,970; 2003: $0; 2004: $0; 2005: $0; 2006: $0.
Biggest contracts:
$165,330 with Army for Lodging - Hotel/Motel. Signed on 2002-03-01. Completion date: 2002-05-17.
$151,875, same as above.Signed on 2000-06-29. Completion date: 2000-09-12.
$83,100, same as above.Signed on 2001-12-26. Completion date: 2002-06-14.
$76,545, same as above.Signed on 2001-05-18. Completion date: 2001-11-17.
UNIVERSITY OF SAINT MARY, INC (4100 S 4TH ST TRAFFICWAY in LEAVENWORTH, KS) : $140,960 in 8 contractsfrom 2003 to 2005
Contracts for Education Services, Educational Services, Tuition, Registration, and Membership Fees by Department of Veterans Affairs, Army, Air Force Signed by year:2000: $0; 2001: $0; 2002: $0; 2003: $46,876; 2004: $13,380; 2005: $80,704; 2006: $0.
Biggest contracts:
$37,444 with Department of Veterans Affairs for Education Services. Signed on 2005-07-01. Effective on 2005-10-01. Completion date: 2006-09-30.
$33,948, same as above.Signed on 2003-10-01. Completion date: 2004-09-30.
$29,380 with Army for Educational Services. Signed on 2005-08-15. Completion date: 2005-08-15.
$13,380, same as above.Signed on 2004-04-05. Completion date: 2004-04-05.
CARL NORWOOD (205 CANYON VIEW DR in LANSING, KS; small business) : $130,089 in 16 contractsfrom 2002 to 2006
Contracts for Custodial Janitorial Services, Landscaping/Groundskeeping Services, Clean Work Stations, Controlled Environment and Related Equipment by Army, Department of Veterans Affairs Signed by year:2000: $0; 2001: $0; 2002: $24,374; 2003: $27,380; 2004: $34,915; 2005: $34,915; 2006: $8,505.
Biggest contracts:
$19,470 with Army for Custodial Janitorial Services. Signed on 2003-11-08. Completion date: 2004-11-30.
$18,500, same as above.Signed on 2005-11-30. Completion date: 2006-11-30.
$18,500, same as above.Signed on 2004-11-04. Completion date: 2005-11-30.
$18,500, same as above.Signed on 2002-11-27. Completion date: 2003-11-30.
ANN SOBY (802 COTTONWOOD DR in LANSING, KS; small business) : $91,308 in 21 contractsfrom 2002 to 2006
Contracts for Education Services by Army Signed by year:2000: $0; 2001: $0; 2002: $5,433; 2003: $30,507; 2004: $27,489; 2005: $11,644; 2006: $16,235.
Biggest contracts:
$29,988 with Army for Education Services. Signed on 2003-10-01. Completion date: 2004-09-30.
$27,489, same as above.Signed on 2004-11-16. Completion date: 2003-09-30.
$13,427, same as above.Signed on 2006-02-28. Completion date: 2006-08-31.
$2,808, same as above.Signed on 2006-01-27. Completion date: 2006-02-28.
JUNE FOLEY (993 N HWY 5 in LANSING, KS; small business) : $86,207 in 28 contractsfrom 2003 to 2006
Contracts for Other Professional Services, Other Special Studies and Analyses by Army Signed by year:2000: $0; 2001: $0; 2002: $0; 2003: $22,886; 2004: $29,637; 2005: $25,014; 2006: $8,670.
Biggest contracts:
$18,542 with Army for Other Professional Services. Signed on 2004-08-25. Completion date: 2004-10-05.
$7,090, same as above.Signed on 2003-09-30. Completion date: 2003-06-14.
$5,948, same as above.Signed on 2004-03-02. Completion date: 2006-06-14.
$4,468, same as above.Signed on 2003-09-30. Completion date: 2003-06-14.
BARBARA HARRISON (127 ROCK CREEK LOOP in LANSING, KS; small business) : $78,724 in 28 contractsfrom 2003 to 2006
Contracts for Other Professional Services by Army Signed by year:2000: $0; 2001: $0; 2002: $0; 2003: $21,862; 2004: $27,611; 2005: $22,492; 2006: $6,759.
Biggest contracts:
$17,147 with Army for Other Professional Services. Signed on 2004-08-25. Completion date: 2004-10-05.
$11,436, same as above.Signed on 2003-09-30. Completion date: 2005-03-15.
$5,612, same as above.Signed on 2004-03-03. Completion date: 2005-03-15.
$3,323, same as above.Signed on 2005-06-02. Completion date: 2005-06-17.
MARY L BRODERSEN (620 S BITTERSWEET LN in LANSING, KS; small business) : $61,238 in 3 contractsfrom 2001 to 2004
$31,513 with Army for Education Services. Signed on 2003-10-01. Completion date: 2004-09-30.
$28,200, same as above.Signed on 2001-10-31. Completion date: 2004-10-31.
$1,525 with Army for Other Social Services. Signed on 2004-06-03. Completion date: 2004-10-31.
CATHY L GRIFFITH (981 PEBBLE BEACH DRIVE in LANSING, KS; small business) : $31,283 in 12 contractsfrom 2003 to 2004
Contracts for Patent and Trademark Services, Other Professional Services by Army Signed by year:2000: $0; 2001: $0; 2002: $0; 2003: $17,086; 2004: $14,197; 2005: $0; 2006: $0.
Biggest contracts:
$10,203 with Army for Patent and Trademark Services. Signed on 2004-08-25. Completion date: 2004-10-05.
$4,837 with Army for Other Professional Services. Signed on 2003-09-30. Completion date: 2006-06-14.
$3,994, same as above.Signed on 2004-03-03. Completion date: 2006-06-14.
$3,663, same as above.Signed on 2003-09-30. Completion date: 2003-06-14.
EBEL, KELLEY (710 COTTONWOOD DR in LANSING, KS; small business) : $28,072 in 10 contractsfrom 2003 to 2006
Contracts for Other Professional Services by Army Signed by year:2000: $0; 2001: $0; 2002: $0; 2003: $2,736; 2004: $7,460; 2005: $12,136; 2006: $5,740.
Biggest contracts:
$6,542 with Army for Other Professional Services. Signed on 2004-08-25. Completion date: 2004-10-05.
$5,257, same as above.Signed on 2005-06-02. Completion date: 2005-06-24.
$2,949, same as above.Signed on 2005-04-08. Completion date: 2005-04-29.
$2,736, same as above.Signed on 2003-09-30. Completion date: 2006-06-14.
LEARNING ENTERPRISES MILITARY (1519 SYCAMORE RIDGE DR in LANSING, KS; small business) : $14,000 in 2 contractsin 2006
$7,000 with Air Force for Other Education and Training Services. Taking place in AL. Signed on 2006-02-07. Completion date: 2006-03-04.
$7,000 with Army for Training/Curriculum Development. Taking place in TN. Signed on 2006-04-19. Completion date: 2006-02-25.
Top industries in this zip code by the number of employees in 2005:
Health Care and Social Assistance: Offices of Physicians (except Mental Health Specialists) (100-249 employees: 1 establishment, 50-99 employees: 1 establishment, 1-4 employees: 3 establishments)
Accommodation and Food Services: Full-Service Restaurants (50-99: 1, 20-49: 3)
Construction: Poured Concrete Foundation and Structure Contractors (100-249: 1, 5-9: 1)
Health Care and Social Assistance: HMO Medical Centers (100-249: 1)
Other Services (except Public Administration): Industrial Launderers (20-49: 2)
Health Care and Social Assistance: Nursing Care Facilities (20-49: 1, 10-19: 1)
Arts, Entertainment, and Recreation: Golf Courses and Country Clubs (20-49: 1)
People in group quarters in 2010:
2,342 people in state prisons
59 people in nursing facilities/skilled-nursing facilities
People in group quarters in 2000:
2,324 people in state prisons
147 people in mental (psychiatric) hospitals or wards
74 people in nursing homes
7 people in wards in general hospitals for patients who have no usual home elsewhere
6 people in other noninstitutional group quarters
5 people in unknown juvenile institutions
Fatal accident statistics in 2013:
Fatal accident count: 1
Vehicles involved in fatal accidents: 2
Fatal accidents caused by drunken drivers: 0
Fatalities: 1
Persons involved in fatal accidents: 4
Pedestrians involved in fatal accidents: 0
Home Mortgage Disclosure Act Aggregated Statistics For Year 2009 (Based on 4 partial tracts)
A) FHA, FSA/RHS & VA Home Purchase Loans
B) Conventional Home Purchase Loans
C) Refinancings
D) Home Improvement Loans
E) Loans on Dwellings For 5+ Families
F) Non-occupant Loans on < 5 Family Dwellings (A B C & D)
G) Loans On Manufactured Home Dwelling (A B C & D)
Number
Average Value
Number
Average Value
Number
Average Value
Number
Average Value
Number
Average Value
Number
Average Value
Number
Average Value
LOANS ORIGINATED
77
$197,871
35
$173,820
243
$169,536
26
$75,617
0
$0
22
$139,211
0
$0
APPLICATIONS APPROVED, NOT ACCEPTED
1
$154,680
1
$132,660
16
$172,552
2
$11,170
0
$0
1
$52,610
0
$0
APPLICATIONS DENIED
4
$181,030
6
$163,635
47
$169,483
8
$11,716
1
$320,210
3
$161,597
1
$85,670
APPLICATIONS WITHDRAWN
3
$216,907
2
$109,490
42
$165,372
1
$2,420
0
$0
3
$155,337
0
$0
FILES CLOSED FOR INCOMPLETENESS
0
$0
0
$0
10
$170,143
2
$47,430
0
$0
0
$0
0
$0
Aggregated Statistics For Year 2008 (Based on 4 partial tracts)
A) FHA, FSA/RHS & VA Home Purchase Loans
B) Conventional Home Purchase Loans
C) Refinancings
D) Home Improvement Loans
E) Loans on Dwellings For 5+ Families
F) Non-occupant Loans on < 5 Family Dwellings (A B C & D)
G) Loans On Manufactured Home Dwelling (A B C & D)
Number
Average Value
Number
Average Value
Number
Average Value
Number
Average Value
Number
Average Value
Number
Average Value
Number
Average Value
LOANS ORIGINATED
61
$195,367
66
$163,317
125
$158,713
16
$56,396
1
$648,990
16
$116,380
2
$17,725
APPLICATIONS APPROVED, NOT ACCEPTED
1
$141,990
1
$85,190
15
$149,403
4
$30,818
0
$0
2
$169,080
0
$0
APPLICATIONS DENIED
5
$162,540
9
$124,483
65
$165,876
18
$57,411
0
$0
4
$135,490
5
$27,034
APPLICATIONS WITHDRAWN
3
$138,303
8
$177,284
32
$144,438
2
$97,580
0
$0
2
$124,765
0
$0
FILES CLOSED FOR INCOMPLETENESS
1
$111,780
1
$158,300
6
$149,987
1
$11,440
0
$0
0
$0
0
$0
Aggregated Statistics For Year 2007 (Based on 4 partial tracts)
A) FHA, FSA/RHS & VA Home Purchase Loans
B) Conventional Home Purchase Loans
C) Refinancings
D) Home Improvement Loans
E) Loans on Dwellings For 5+ Families
F) Non-occupant Loans on < 5 Family Dwellings (A B C & D)
G) Loans On Manufactured Home Dwelling (A B C & D)
Number
Average Value
Number
Average Value
Number
Average Value
Number
Average Value
Number
Average Value
Number
Average Value
Number
Average Value
LOANS ORIGINATED
47
$214,163
97
$149,860
131
$132,662
30
$65,936
1
$56,610
21
$136,466
3
$40,370
APPLICATIONS APPROVED, NOT ACCEPTED
0
$0
8
$136,846
30
$142,766
5
$60,290
0
$0
2
$171,290
1
$16,310
APPLICATIONS DENIED
2
$182,120
17
$171,111
102
$145,863
13
$73,751
0
$0
7
$94,926
5
$34,192
APPLICATIONS WITHDRAWN
4
$161,665
9
$179,842
51
$132,985
6
$93,880
0
$0
1
$202,410
0
$0
FILES CLOSED FOR INCOMPLETENESS
1
$103,920
1
$223,550
15
$146,947
0
$0
0
$0
1
$87,610
0
$0
Aggregated Statistics For Year 2006 (Based on 4 partial tracts)
A) FHA, FSA/RHS & VA Home Purchase Loans
B) Conventional Home Purchase Loans
C) Refinancings
D) Home Improvement Loans
F) Non-occupant Loans on < 5 Family Dwellings (A B C & D)
G) Loans On Manufactured Home Dwelling (A B C & D)
Number
Average Value
Number
Average Value
Number
Average Value
Number
Average Value
Number
Average Value
Number
Average Value
LOANS ORIGINATED
48
$204,645
159
$129,532
139
$125,925
28
$36,861
33
$95,446
1
$132,920
APPLICATIONS APPROVED, NOT ACCEPTED
0
$0
17
$80,681
26
$133,834
7
$39,891
4
$77,338
2
$32,790
APPLICATIONS DENIED
1
$67,470
23
$103,721
108
$135,015
25
$57,244
5
$97,734
2
$98,245
APPLICATIONS WITHDRAWN
4
$200,442
15
$156,447
95
$130,501
5
$95,398
7
$203,656
0
$0
FILES CLOSED FOR INCOMPLETENESS
0
$0
4
$117,682
16
$138,409
0
$0
1
$51,960
0
$0
Aggregated Statistics For Year 2005 (Based on 4 partial tracts)
A) FHA, FSA/RHS & VA Home Purchase Loans
B) Conventional Home Purchase Loans
C) Refinancings
D) Home Improvement Loans
E) Loans on Dwellings For 5+ Families
F) Non-occupant Loans on < 5 Family Dwellings (A B C & D)
G) Loans On Manufactured Home Dwelling (A B C & D)
Number
Average Value
Number
Average Value
Number
Average Value
Number
Average Value
Number
Average Value
Number
Average Value
Number
Average Value
LOANS ORIGINATED
60
$195,699
189
$129,370
185
$129,448
31
$37,747
1
$1,686,810
46
$120,727
7
$40,577
APPLICATIONS APPROVED, NOT ACCEPTED
2
$164,620
17
$99,155
27
$138,183
7
$36,943
0
$0
8
$76,166
1
$16,310
APPLICATIONS DENIED
1
$199,390
25
$114,202
105
$137,146
25
$60,386
0
$0
5
$110,612
5
$45,204
APPLICATIONS WITHDRAWN
8
$209,478
24
$161,343
94
$139,095
9
$147,441
0
$0
10
$106,111
0
$0
FILES CLOSED FOR INCOMPLETENESS
0
$0
5
$170,194
13
$119,924
1
$25,980
0
$0
2
$179,580
0
$0
Aggregated Statistics For Year 2004 (Based on 4 partial tracts)
A) FHA, FSA/RHS & VA Home Purchase Loans
B) Conventional Home Purchase Loans
C) Refinancings
D) Home Improvement Loans
E) Loans on Dwellings For 5+ Families
F) Non-occupant Loans on < 5 Family Dwellings (A B C & D)
G) Loans On Manufactured Home Dwelling (A B C & D)
Number
Average Value
Number
Average Value
Number
Average Value
Number
Average Value
Number
Average Value
Number
Average Value
Number
Average Value
LOANS ORIGINATED
37
$181,061
130
$136,235
230
$129,763
38
$52,828
1
$1,179,430
24
$154,067
5
$46,108
APPLICATIONS APPROVED, NOT ACCEPTED
1
$132,320
6
$120,465
33
$120,038
4
$47,205
0
$0
1
$129,300
1
$65,190
APPLICATIONS DENIED
4
$100,095
18
$107,366
119
$134,255
14
$37,961
0
$0
5
$124,864
4
$32,505
APPLICATIONS WITHDRAWN
4
$161,322
19
$125,501
99
$125,516
9
$58,868
0
$0
7
$98,494
0
$0
FILES CLOSED FOR INCOMPLETENESS
0
$0
3
$87,003
23
$133,852
0
$0
0
$0
1
$96,810
0
$0
Aggregated Statistics For Year 2003 (Based on 4 partial tracts)
A) FHA, FSA/RHS & VA Home Purchase Loans
B) Conventional Home Purchase Loans
C) Refinancings
D) Home Improvement Loans
F) Non-occupant Loans on < 5 Family Dwellings (A B C & D)
Number
Average Value
Number
Average Value
Number
Average Value
Number
Average Value
Number
Average Value
LOANS ORIGINATED
47
$160,718
123
$134,354
476
$125,881
16
$22,044
28
$97,831
APPLICATIONS APPROVED, NOT ACCEPTED
3
$166,187
10
$171,460
43
$117,165
5
$15,140
2
$80,660
APPLICATIONS DENIED
0
$0
8
$124,925
103
$119,465
9
$27,774
2
$84,655
APPLICATIONS WITHDRAWN
6
$191,765
8
$116,730
106
$125,021
5
$41,924
3
$92,437
FILES CLOSED FOR INCOMPLETENESS
0
$0
1
$109,210
18
$126,593
1
$12,080
2
$93,650
Aggregated Statistics For Year 1999 (Based on 1 partial tract)
A) FHA, FSA/RHS & VA Home Purchase Loans
B) Conventional Home Purchase Loans
C) Refinancings
D) Home Improvement Loans
F) Non-occupant Loans on < 5 Family Dwellings (A B C & D)
Detailed PMIC statistics for the following Tracts:0711.01
, 0711.02
2002 - 2018 National Fire Incident Reporting System (NFIRS) incidents
According to the data from the years 2002 - 2018 the average number of fires per year is 41. The highest number of fires - 98 took place in 2002, and the least - 6 in 2011. The data has a dropping trend.
When looking into fire subcategories, the most incidents belonged to: Outside Fires (51.6%), and Structure Fires (30.2%).
Fire incident types reported to NFIRS in Zip Code 66043


 Nearest zip codes: 64092, 66109, 66007, 66048, 66027, 64079.


 According to the data from the years 2002 - 2018 the average number of fires per year is 41. The highest number of fires - 98 took place in 2002, and the least - 6 in 2011. The data has a dropping trend.
 When looking into fire subcategories, the most incidents belonged to: Outside Fires (51.6%), and Structure Fires (30.2%).