Estimated zip code population in 2022: 1,238 Zip code population in 2010: 1,376 Zip code population in 2000: 1,327
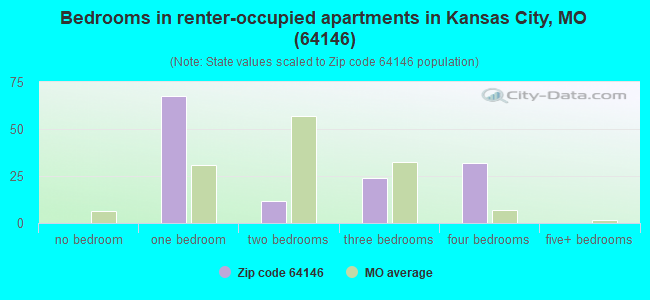
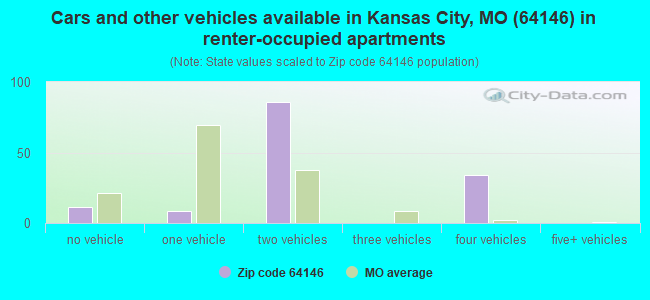
Houses and condos: 762 Renter-occupied apartments: 137
% of renters here:
18%
State:
32%
March 2022 cost of living index in zip code 64146: 89.0 (less than average, U.S. average is 100)
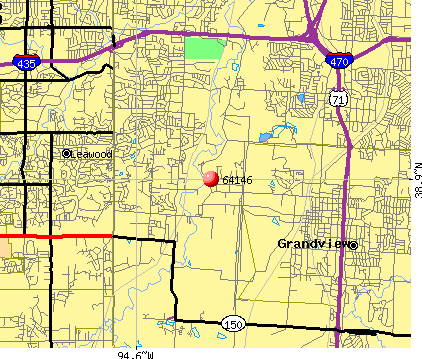
Land area: 4.8 sq. mi. Water area: 0.0 sq. mi.
Population density: 257 people per square mile
(very low).
OSM Map
General Map
Google Map
MSN Map
OSM Map
General Map
Google Map
MSN Map
OSM Map
General Map
Google Map
MSN Map
OSM Map
General Map
Google Map
MSN Map
Please wait while loading the map...
Real estate property taxes paid for housing units in 2022:
This zip code:
1.0% ($2,111)
Missouri:
0.8% ($1,810)
Median real estate property taxes paid for housing units with mortgages in 2022: $1,694 (0.7%) Median real estate property taxes paid for housing units with no mortgage in 2022: $2,244 (1.1%)
Business Search- 14 Million verified businesses
Males: 567
(45.8%)
Females: 671
(54.2%)
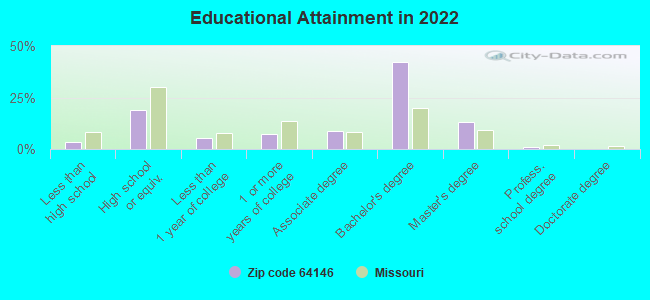
For population 25 years and over in 64146:
High school or higher: 97.4%
Bachelor's degree or higher: 56.5%
Graduate or professional degree: 14.0%
Mean travel time to work (commute): 19.8 minutes
For population 15 years and over in 64146:
Never married: 21.4%
Now married: 46.3%
Separated: 0.0%
Widowed: 10.2%
Divorced: 22.1%
Zip code 64146 compared to state average:
Unemployed percentage significantly below state average.
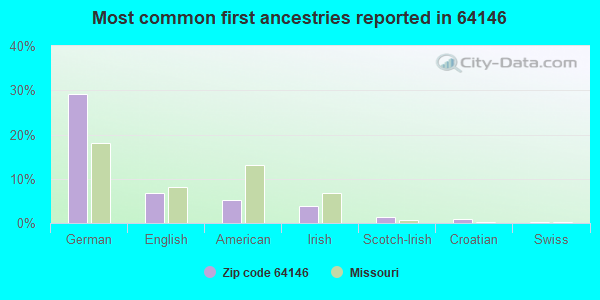
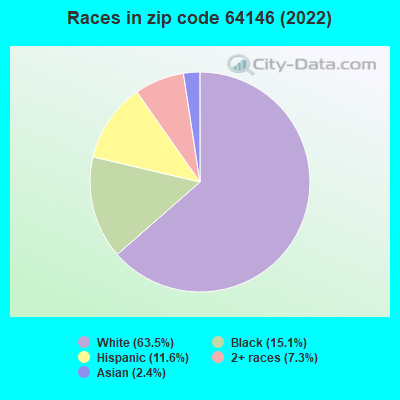
Hispanic race population percentage above state average.
Median age significantly above state average.
Renting percentage below state average.
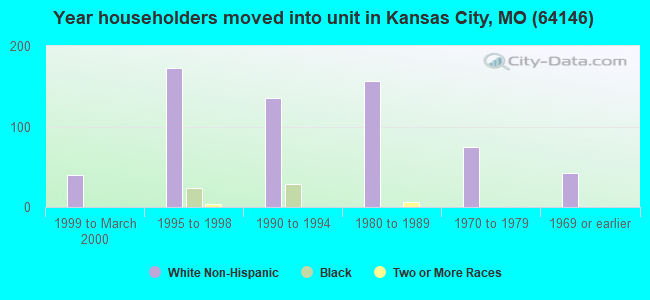
Length of stay since moving in significantly above state average.
Number of college students below state average.
Percentage of population with a bachelor's degree or higher above state average.
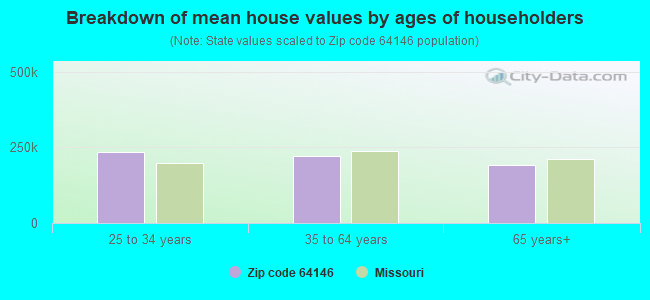
Estimated median house/condo value in 2022: $205,337
64146:
$205,337
Missouri:
$221,200
Median resident age:
This zip code:
54.1 years
Missouri median age:
39.1 years
Average household size:
This zip code:
1.6 people
Missouri:
2.4 people
Averages for the 2020 tax year for zip code 64146, filed in 2021:
Average Adjusted Gross Income (AGI) in 2020: $62,034 (Individual Income Tax Returns)
Here:
$62,034
State:
$68,151
Salary/wage: $56,731 (reported on 77.5% of returns)
Here:
$56,731
State:
$56,131
(% of AGI for various income ranges: 1176.4% for AGIs below $25k, 3239.3% for AGIs $25k-50k, 6300.0% for AGIs $50k-75k, 10568.3% for AGIs $75k-100k, 18506.7% for AGIs $100k-200k)
Taxable interest for individuals: $723 (reported on 37.5% of returns)
This zip code:
$723
Missouri:
$1,586
(% of AGI for various income ranges: 20.0% for AGIs below $25k, 24.0% for AGIs $25k-50k, 34.4% for AGIs $50k-75k, 48.3% for AGIs $75k-100k, 103.3% for AGIs $100k-200k)
Ordinary dividends: $3,729 (reported on 26.2% of returns)
Here:
$3,729
State:
$10,947
(% of AGI for various income ranges: 65.7% for AGIs below $25k, 63.3% for AGIs $25k-50k, 75.6% for AGIs $50k-75k, 288.3% for AGIs $75k-100k, 394.4% for AGIs $100k-200k)
Net capital gain/loss in AGI: +$3,681 (reported on 20.0% of returns)
Here:
+$3,681
State:
+$18,453
(% of AGI for various income ranges: 17.1% for AGIs below $25k, 22.0% for AGIs $25k-50k, 85.6% for AGIs $50k-75k, 228.3% for AGIs $75k-100k, 353.3% for AGIs $100k-200k)
Profit/loss from business: +$10,233 (reported on 15.0% of returns)
Here:
+$10,233
State:
+$12,260
(% of AGI for various income ranges: 74.3% for AGIs below $25k, 177.3% for AGIs $25k-50k, 728.9% for AGIs $50k-75k, 224.4% for AGIs $100k-200k)
Taxable individual retirement arrangement distribution: $14,850 (reported on 15.0% of returns)
64146:
$14,850
Missouri:
$19,719
(% of AGI for various income ranges: 160.7% for AGIs below $25k, 296.0% for AGIs $25k-50k, 431.1% for AGIs $50k-75k, 805.6% for AGIs $100k-200k)
Total itemized deductions: $21,080 (reported on 12.5% of returns)
Here:
$21,080
State:
$36,651
(% of AGI for various income ranges: 526.7% for AGIs $25k-50k, 606.7% for AGIs $75k-100k, 1060.0% for AGIs $100k-200k)
Charity contributions: $6,357 (reported on 8.8% of returns)
Here:
$6,357
State:
$15,671
(% of AGI for various income ranges: 205.6% for AGIs $50k-75k, 288.9% for AGIs $100k-200k)
Taxes paid: $6,630 (reported on 12.5% of returns)
64146:
$6,630
State:
$7,608
(% of AGI for various income ranges: 108.7% for AGIs $25k-50k, 261.7% for AGIs $75k-100k, 381.1% for AGIs $100k-200k)
Earned income credit: $1,350 (reported on 7.5% of returns)
Here:
$1,350
State:
$2,315
(% of AGI for various income ranges: 57.9% for AGIs below $25k)
Percentage of individuals using paid preparers for their 2020 taxes: 95.0%
Here:
95%
State:
93%
(% for various income ranges: 95.2% for AGIs below $25k, 95.0% for AGIs $25k-50k, 92.9% for AGIs $50k-75k, 90.0% for AGIs $75k-100k, 100.0% for AGIs $100k-200k)
Averages for the 2012 tax year for zip code 64146, filed in 2013:
Average Adjusted Gross Income (AGI) in 2012: $50,770 (Individual Income Tax Returns)
Here:
$50,770
State:
$55,896
Salary/wage: $45,914 (reported on 78.9% of returns)
Here:
$45,914
State:
$46,205
(% of AGI for various income ranges: 62.1% for AGIs below $25k, 71.5% for AGIs $25k-50k, 73.0% for AGIs $50k-75k, 70.8% for AGIs $75k-100k, 72.6% for AGIs $100k-200k)
Taxable interest for individuals: $1,339 (reported on 39.4% of returns)
This zip code:
$1,339
Missouri:
$1,559
(% of AGI for various income ranges: 1.5% for AGIs below $25k, 0.6% for AGIs $25k-50k, 0.9% for AGIs $50k-75k, 0.5% for AGIs $75k-100k, 1.6% for AGIs $100k-200k)
Ordinary dividends: $3,719 (reported on 22.5% of returns)
Here:
$3,719
State:
$7,410
(% of AGI for various income ranges: 2.2% for AGIs below $25k, 1.7% for AGIs $25k-50k, 0.5% for AGIs $50k-75k, 2.7% for AGIs $75k-100k, 1.8% for AGIs $100k-200k)
Net capital gain/loss in AGI: +$3,700 (reported on 16.9% of returns)
Here:
+$3,700
State:
+$11,579
(% of AGI for various income ranges: 0.5% for AGIs $25k-50k, 1.3% for AGIs $50k-75k, 2.8% for AGIs $100k-200k)
Profit/loss from business: +$6,388 (reported on 11.3% of returns)
Here:
+$6,388
State:
+$11,688
(% of AGI for various income ranges: 6.3% for AGIs below $25k, 3.3% for AGIs $25k-50k, 0.3% for AGIs $50k-75k, 1.2% for AGIs $75k-100k)
Taxable individual retirement arrangement distribution: $13,021 (reported on 19.7% of returns)
64146:
$13,021
Missouri:
$14,773
(% of AGI for various income ranges: 7.5% for AGIs below $25k, 6.8% for AGIs $25k-50k, 6.2% for AGIs $50k-75k, 10.1% for AGIs $75k-100k)
Total itemized deductions: $17,753 (25% of AGI, reported on 47.9% of returns)
Here:
$17,753
State:
$22,730
Here:
24.8% of AGI
State:
19.2% of AGI
(% of AGI for various income ranges: 17.8% for AGIs below $25k, 14.3% for AGIs $25k-50k, 14.4% for AGIs $50k-75k, 17.3% for AGIs $75k-100k, 19.4% for AGIs $100k-200k)
Charity contributions: $3,737 (reported on 38.0% of returns)
Here:
$3,737
State:
$4,745
(% of AGI for various income ranges: 2.2% for AGIs below $25k, 1.9% for AGIs $25k-50k, 2.0% for AGIs $50k-75k, 3.5% for AGIs $75k-100k, 3.7% for AGIs $100k-200k)
Taxes paid: $6,347 (reported on 47.9% of returns)
64146:
$6,347
State:
$8,399
(% of AGI for various income ranges: 3.8% for AGIs below $25k, 4.7% for AGIs $25k-50k, 5.5% for AGIs $50k-75k, 6.1% for AGIs $75k-100k, 7.6% for AGIs $100k-200k)
Earned income credit: $2,233 (reported on 8.5% of returns)
Here:
$2,233
State:
$2,288
(% of AGI for various income ranges: 4.5% for AGIs below $25k)
Percentage of individuals using paid preparers for their 2012 taxes: 52.1%
Here:
52%
State:
55%
(% for various income ranges: 50.0% for AGIs below $25k, 50.0% for AGIs $25k-50k, 50.0% for AGIs $50k-75k, 57.1% for AGIs $75k-100k, 62.5% for AGIs $100k-200k)
Averages for the 2004 tax year for zip code 64146, filed in 2005:
Average Adjusted Gross Income (AGI) in 2004: $53,048 (Individual Income Tax Returns)
Here:
$53,048
State:
$44,591
Salary/wage: $41,281 (reported on 77.8% of returns)
Here:
$41,281
State:
$38,941
(% of AGI for various income ranges: 61.2% for AGIs below $10k, 58.3% for AGIs $10k-25k, 72.6% for AGIs $25k-50k, 76.5% for AGIs $50k-75k, 77.4% for AGIs $75k-100k, 38.7% for AGIs over 100k)
Taxable interest for individuals: $1,969 (reported on 54.8% of returns)
This zip code:
$1,969
Missouri:
$1,801
(% of AGI for various income ranges: 12.6% for AGIs below $10k, 2.9% for AGIs $10k-25k, 3.6% for AGIs $25k-50k, 0.8% for AGIs $50k-75k, 1.0% for AGIs $75k-100k, 1.8% for AGIs over 100k)
Taxable dividends: $2,645 (reported on 32.4% of returns)
Here:
$2,645
State:
$3,677
(% of AGI for various income ranges: 6.7% for AGIs below $10k, 2.4% for AGIs $10k-25k, 1.8% for AGIs $25k-50k, 1.1% for AGIs $50k-75k, 1.5% for AGIs $75k-100k, 1.6% for AGIs over 100k)
Net capital gain/loss: +$1,508 (reported on 26.3% of returns)
Here:
+$1,508
State:
+$8,915
(% of AGI for various income ranges: -9.9% for AGIs below $10k, -0.6% for AGIs $10k-25k, 0.7% for AGIs $25k-50k, -0.3% for AGIs $50k-75k, 0.3% for AGIs $75k-100k, 2.1% for AGIs over 100k)
Profit/loss from business: +$6,211 (reported on 15.5% of returns)
Here:
+$6,211
State:
+$9,793
(% of AGI for various income ranges: 5.5% for AGIs below $10k, 6.5% for AGIs $10k-25k, 3.0% for AGIs $25k-50k, 2.3% for AGIs $50k-75k, 0.7% for AGIs over 100k)
IRA payment deduction: $2,417 (reported on 1.7% of returns)
64146:
$2,417
Missouri:
$2,972
Total itemized deductions: $16,615 (25% of AGI, reported on 51.3% of returns)
Here:
$16,615
State:
$18,261
Here:
24.5% of AGI
State:
20.5% of AGI
(% of AGI for various income ranges: 25.4% for AGIs below $10k, 14.5% for AGIs $10k-25k, 17.7% for AGIs $25k-50k, 21.4% for AGIs $50k-75k, 16.3% for AGIs $75k-100k, 12.0% for AGIs over 100k)
Charity contributions deductions: $3,773 (5% of AGI, reported on 43.9% of returns)
Here:
$3,773
State:
$3,665
Here:
5.3% of AGI
State:
3.9% of AGI
(% of AGI for various income ranges: 2.0% for AGIs $10k-25k, 2.2% for AGIs $25k-50k, 3.6% for AGIs $50k-75k, 2.5% for AGIs $75k-100k, 3.9% for AGIs over 100k)
Total tax: $7,448 (reported on 81.5% of returns)
64146:
$7,448
State:
$6,999
(% of AGI for various income ranges: 2.3% for AGIs below $10k, 5.0% for AGIs $10k-25k, 8.2% for AGIs $25k-50k, 9.8% for AGIs $50k-75k, 11.2% for AGIs $75k-100k, 15.6% for AGIs over 100k)
Earned income credit: $1,472 (reported on 7.5% of returns)
Here:
$1,472
State:
$1,728
Percentage of individuals using paid preparers for their 2004 taxes: 60.5%
Here:
61%
State:
62%
(% for various income ranges: 45.6% for AGIs below $10k, 60.7% for AGIs $10k-25k, 68.7% for AGIs $25k-50k, 63.3% for AGIs $50k-75k, 60.6% for AGIs $75k-100k, 55.7% for AGIs over 100k)
Household received Food Stamps/SNAP in the past 12 months: 53 Household did not receive Food Stamps/SNAP in the past 12 months: 695
Women who had a birth in the past 12 months: 16 (15 now married, 0 unmarried) Women who did not have a birth in the past 12 months: 142 (64 now married, 78 unmarried)
Housing units in zip code 64146 with a mortgage: 352 (9 second mortgage) Median monthly owner costs for units with a mortgage: $1,406 Median monthly owner costs for units without a mortgage: $613
Residents with income below the poverty level in 2022:
This zip code:
7.6%
Whole state:
13.2%
Residents with income below 50% of the poverty level in 2022:
This zip code:
4.8%
Whole state:
6.8%
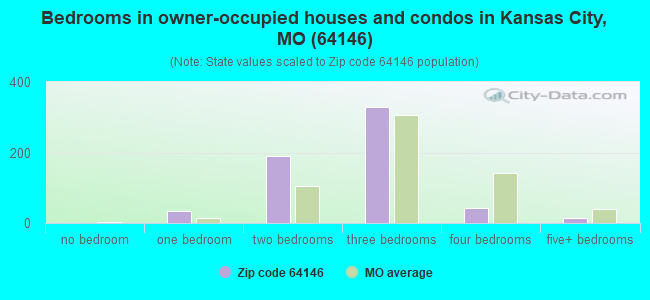
Median number of rooms in houses and condos:
Here:
5.2
State:
6.4
Median number of rooms in apartments:
Here:
5.9
State:
4.4
Notable locations in this zip code not listed on our city pages
Churches in zip code 64146 include: Faith Temple Church (A), Faith Ministries World Outreach Center (B), Deeper Life Christian Ministries (C), Word of Faith Christian Center (D). Display/hide their locations on the map
Size of family households: 273 2-persons, 63 3-persons, 17 4-persons, 11 5-persons
Size of nonfamily households: 353 1-person, 34 2-persons
98 married couples with children.
63 single-parent households (63 men).
94.1% of residents of 64146 zip code speak English at home.
3.1% of residents speak Spanish at home (17% very well, 83% well).
1.6% of residents speak other Indo-European language at home (100% very well).
2.3% of residents speak Asian or Pacific Island language at home (81% very well, 19% not well).
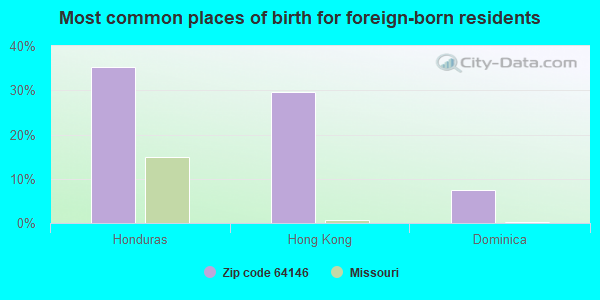
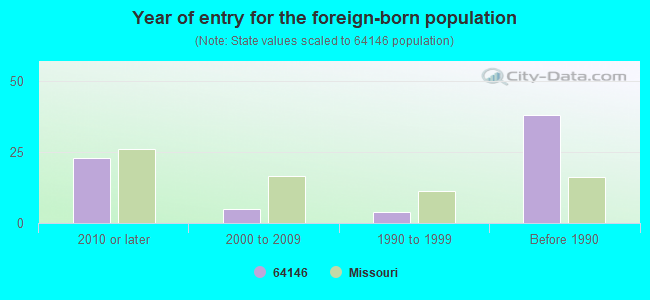
Foreign born population: 55 (4.4%) (89.4% of them are naturalized citizens)
Facilities with environmental interests located in this zip code:
AGRI LAWN (1515 E 131ST ST in KANSAS CITY, MO)
STATE MASTER (Missouri monitoring and compilance) - RCRAINFO-MOP000019695, NOT IN A UNIVERSE (Resource Conservation and Recovery Act (tracking hazardous waste)) Organizations: JAMES TEEFEY (CONTACT/OWNER)
AMOCO OIL SS #3626 (13611 HOLMES RD in KANSAS CITY, MO)
STATE MASTER (Missouri monitoring and compilance) - RCRAINFO-MOD985808906, SQG (Resource Conservation and Recovery Act (tracking hazardous waste)) Organizations: PAUL E MONTEER (CONTACT/OWNER)
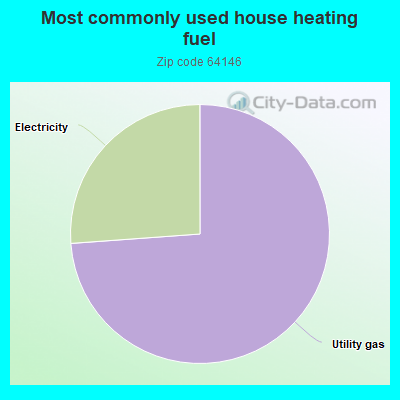
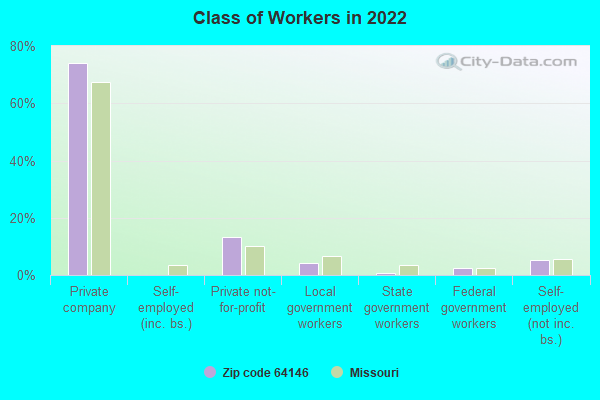
74.0%Utility gas
26.2%Electricity
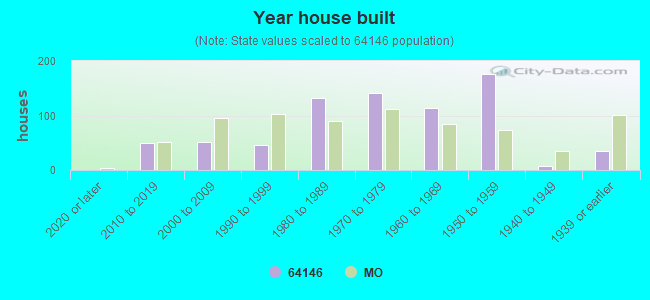
Population in 1990: 1,417.
Place of birth for U.S.-born residents:
This state: 659
Northeast: 7
Midwest: 316
South: 146
West: 37
73% of the 64146 zip code residents lived in the same house 5 years ago. Out of people who lived in different houses, 73% lived in this county. Out of people who lived in different counties, 50% lived in Missouri.
93% of the 64146 zip code residents lived in the same house 1 year ago. Out of people who lived in different houses, 111% moved from different state.
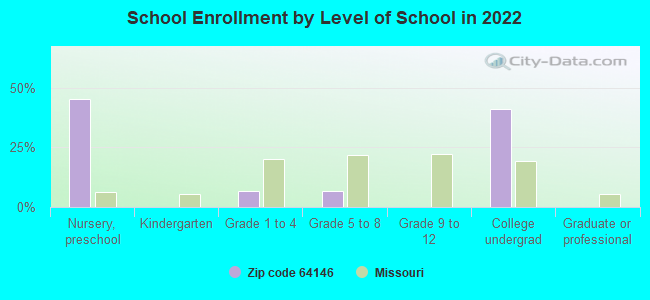
Private vs. public school enrollment:
Students in private schools in grades 1 to 8 (elementary and middle school): 5
Here:
50.3%
Missouri:
15.4%
Students in private undergraduate colleges:
Here:
2.9%
Missouri:
22.6%
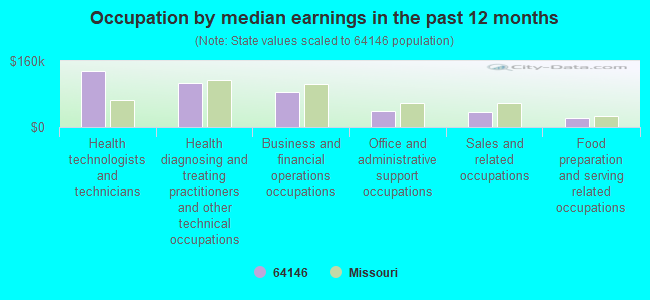
Occupation by median earnings in the past 12 months ($)
136,234Health technologists and technicians
106,681Health diagnosing and treating practitioners and other technical occupations
83,668Business and financial operations occupations
38,896Office and administrative support occupations
37,213Sales and related occupations
22,421Food preparation and serving related occupations
Companies with federal contracts located in this zip code:
AGRI-LAWN INC (1515 E 131ST ST in KANSAS CITY, MO; small business) : $24,930 in 6 contractsfrom 2003 to 2006
Contracts for Insect and Rodent Control Services by Army Signed by year:2000: $0; 2001: $0; 2002: $0; 2003: $4,960; 2004: $3,990; 2005: $7,990; 2006: $7,990.
Biggest contracts:
$7,990 with Army for Insect and Rodent Control Services. Taking place in OK. Signed on 2006-03-06. Completion date: 2007-03-31.
$7,990, same as above.Signed on 2005-04-15. Completion date: 2006-03-31.
$5,990, same as above.Signed on 2004-03-31. Completion date: 2005-03-31.
$4,960, same as above.Signed on 2003-04-22. Completion date: 2003-04-01.
FRONTIER BAG, INC (5720 E 150TH ST in KANSAS CITY, MO; small business)
$3,345 with U.S. Army Corps of Engineers - civil program financing only for Bags and Sacks. Signed on 2003-07-10. Completion date: 2003-07-31.
Top industries in this zip code by the number of employees in 2005:
Finance and Insurance: Securities Brokerage (50-99 employees: 1 establishment)
Health Care and Social Assistance: Services for the Elderly and Persons with Disabilities (20-49: 1)
Wholesale Trade: Other Chemical and Allied Products Merchant Wholesalers (20-49: 1)
Administrative and Support and Waste Management and Remediation Services: Landscaping Services (10-19: 1, 1-4: 1)
Other Services (except Public Administration): Other Similar Organizations (except Business, Professional, Labor, and Political Organizations) (10-19: 1)
Accommodation and Food Services: Limited-Service Restaurants (10-19: 1)
Other Services (except Public Administration): Pet Care (except Veterinary) Services (10-19: 1)
Other Services (except Public Administration): Religious Organizations (5-9: 1, 1-4: 2)
Professional, Scientific, and Technical Services: Veterinary Services (5-9: 1)
Fatal accident statistics in 2014:
Fatal accident count: 1
Vehicles involved in fatal accidents: 1
Fatal accidents caused by drunken drivers: 1
Fatalities: 1
Persons involved in fatal accidents: 1
Pedestrians involved in fatal accidents: 0
Fatal accident statistics in 2013:
Fatal accident count: 1
Vehicles involved in fatal accidents: 1
Fatal accidents caused by drunken drivers: 1
Fatalities: 1
Persons involved in fatal accidents: 1
Pedestrians involved in fatal accidents: 0
Home Mortgage Disclosure Act Aggregated Statistics For Year 2009 (Based on 4 partial tracts)
A) FHA, FSA/RHS & VA Home Purchase Loans
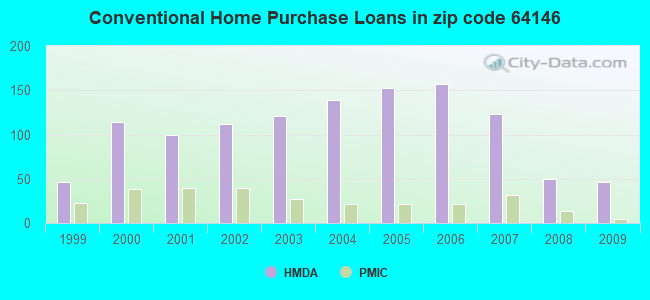
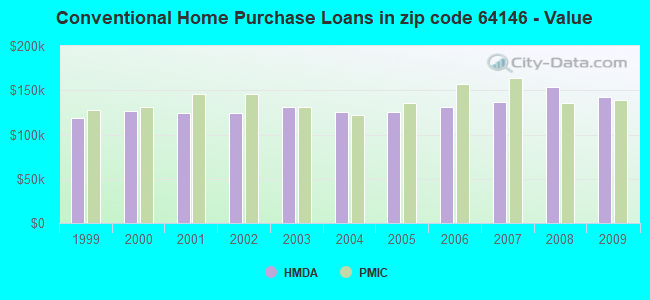
B) Conventional Home Purchase Loans
C) Refinancings
D) Home Improvement Loans
F) Non-occupant Loans on < 5 Family Dwellings (A B C & D)
G) Loans On Manufactured Home Dwelling (A B C & D)
Number
Average Value
Number
Average Value
Number
Average Value
Number
Average Value
Number
Average Value
Number
Average Value
LOANS ORIGINATED
39
$153,691
46
$142,741
200
$151,902
3
$160,050
19
$103,200
1
$156,230
APPLICATIONS APPROVED, NOT ACCEPTED
1
$75,420
0
$0
14
$175,439
0
$0
0
$0
0
$0
APPLICATIONS DENIED
3
$269,240
5
$152,930
46
$178,026
4
$46,645
3
$56,100
0
$0
APPLICATIONS WITHDRAWN
5
$168,800
3
$188,503
40
$161,040
1
$80,020
3
$121,993
0
$0
FILES CLOSED FOR INCOMPLETENESS
1
$198,460
0
$0
8
$157,098
0
$0
1
$63,880
0
$0
Aggregated Statistics For Year 2008 (Based on 4 partial tracts)
A) FHA, FSA/RHS & VA Home Purchase Loans
B) Conventional Home Purchase Loans
C) Refinancings
D) Home Improvement Loans
F) Non-occupant Loans on < 5 Family Dwellings (A B C & D)
Number
Average Value
Number
Average Value
Number
Average Value
Number
Average Value
Number
Average Value
LOANS ORIGINATED
15
$160,121
50
$154,185
85
$164,497
6
$63,655
17
$127,715
APPLICATIONS APPROVED, NOT ACCEPTED
2
$266,215
7
$135,050
11
$146,091
2
$14,930
3
$122,813
APPLICATIONS DENIED
0
$0
4
$173,120
37
$157,195
8
$77,521
8
$119,340
APPLICATIONS WITHDRAWN
2
$202,195
5
$249,830
27
$129,116
2
$101,365
1
$75,760
FILES CLOSED FOR INCOMPLETENESS
0
$0
1
$290,220
6
$141,925
0
$0
2
$152,765
Aggregated Statistics For Year 2007 (Based on 4 partial tracts)
A) FHA, FSA/RHS & VA Home Purchase Loans
B) Conventional Home Purchase Loans
C) Refinancings
D) Home Improvement Loans
E) Loans on Dwellings For 5+ Families
F) Non-occupant Loans on < 5 Family Dwellings (A B C & D)
G) Loans On Manufactured Home Dwelling (A B C & D)
Number
Average Value
Number
Average Value
Number
Average Value
Number
Average Value
Number
Average Value
Number
Average Value
Number
Average Value
LOANS ORIGINATED
11
$155,374
123
$136,793
103
$151,225
18
$50,581
1
$514,090
21
$129,252
0
$0
APPLICATIONS APPROVED, NOT ACCEPTED
0
$0
12
$175,937
13
$153,508
4
$13,565
0
$0
2
$145,645
1
$24,630
APPLICATIONS DENIED
2
$171,255
18
$199,138
55
$136,190
10
$84,708
0
$0
3
$214,857
0
$0
APPLICATIONS WITHDRAWN
1
$134,680
9
$126,024
31
$150,650
1
$32,010
0
$0
1
$89,630
0
$0
FILES CLOSED FOR INCOMPLETENESS
0
$0
2
$205,930
12
$140,460
1
$42,680
0
$0
1
$65,090
0
$0
Aggregated Statistics For Year 2006 (Based on 4 partial tracts)
A) FHA, FSA/RHS & VA Home Purchase Loans
B) Conventional Home Purchase Loans
C) Refinancings
D) Home Improvement Loans
E) Loans on Dwellings For 5+ Families
F) Non-occupant Loans on < 5 Family Dwellings (A B C & D)
Number
Average Value
Number
Average Value
Number
Average Value
Number
Average Value
Number
Average Value
Number
Average Value
LOANS ORIGINATED
12
$147,935
157
$131,397
119
$120,597
17
$71,579
1
$307,840
14
$128,655
APPLICATIONS APPROVED, NOT ACCEPTED
0
$0
14
$132,697
31
$218,595
2
$56,020
0
$0
6
$74,292
APPLICATIONS DENIED
0
$0
13
$118,345
77
$134,809
15
$31,406
0
$0
2
$205,395
APPLICATIONS WITHDRAWN
2
$130,175
16
$101,232
34
$141,799
1
$213,400
0
$0
5
$150,020
FILES CLOSED FOR INCOMPLETENESS
0
$0
5
$124,446
8
$159,591
0
$0
0
$0
0
$0
Aggregated Statistics For Year 2005 (Based on 4 partial tracts)
A) FHA, FSA/RHS & VA Home Purchase Loans
B) Conventional Home Purchase Loans
C) Refinancings
D) Home Improvement Loans
E) Loans on Dwellings For 5+ Families
F) Non-occupant Loans on < 5 Family Dwellings (A B C & D)
G) Loans On Manufactured Home Dwelling (A B C & D)
Number
Average Value
Number
Average Value
Number
Average Value
Number
Average Value
Number
Average Value
Number
Average Value
Number
Average Value
LOANS ORIGINATED
6
$148,687
153
$125,612
164
$127,082
18
$39,099
2
$3,342,220
39
$146,064
1
$3,200
APPLICATIONS APPROVED, NOT ACCEPTED
0
$0
10
$150,143
19
$115,931
2
$25,780
0
$0
1
$65,420
0
$0
APPLICATIONS DENIED
0
$0
26
$137,259
86
$133,148
13
$40,528
0
$0
4
$106,070
0
$0
APPLICATIONS WITHDRAWN
1
$120,060
17
$146,698
68
$117,996
9
$105,603
0
$0
5
$72,160
0
$0
FILES CLOSED FOR INCOMPLETENESS
0
$0
5
$143,192
7
$110,530
1
$29,880
0
$0
1
$60,820
0
$0
Aggregated Statistics For Year 2004 (Based on 4 partial tracts)
A) FHA, FSA/RHS & VA Home Purchase Loans
B) Conventional Home Purchase Loans
C) Refinancings
D) Home Improvement Loans
E) Loans on Dwellings For 5+ Families
F) Non-occupant Loans on < 5 Family Dwellings (A B C & D)
G) Loans On Manufactured Home Dwelling (A B C & D)
Number
Average Value
Number
Average Value
Number
Average Value
Number
Average Value
Number
Average Value
Number
Average Value
Number
Average Value
LOANS ORIGINATED
11
$121,119
139
$125,092
191
$132,421
14
$58,687
1
$723,420
32
$111,059
0
$0
APPLICATIONS APPROVED, NOT ACCEPTED
1
$89,630
21
$170,016
35
$147,549
2
$77,360
0
$0
5
$180,370
0
$0
APPLICATIONS DENIED
1
$80,040
27
$114,551
84
$134,916
8
$41,259
0
$0
13
$150,563
2
$82,340
APPLICATIONS WITHDRAWN
0
$0
25
$133,904
49
$133,374
2
$53,350
0
$0
5
$122,704
0
$0
FILES CLOSED FOR INCOMPLETENESS
0
$0
3
$202,547
25
$156,329
0
$0
0
$0
6
$205,868
0
$0
Aggregated Statistics For Year 2003 (Based on 4 partial tracts)
A) FHA, FSA/RHS & VA Home Purchase Loans
B) Conventional Home Purchase Loans
C) Refinancings
D) Home Improvement Loans
F) Non-occupant Loans on < 5 Family Dwellings (A B C & D)
Number
Average Value
Number
Average Value
Number
Average Value
Number
Average Value
Number
Average Value
LOANS ORIGINATED
5
$142,890
121
$130,606
444
$122,056
12
$27,798
46
$157,480
APPLICATIONS APPROVED, NOT ACCEPTED
0
$0
12
$156,737
38
$126,163
1
$5,390
2
$48,015
APPLICATIONS DENIED
1
$84,290
18
$132,953
79
$149,495
6
$67,150
11
$157,539
APPLICATIONS WITHDRAWN
1
$133,140
15
$116,015
70
$132,908
3
$25,607
3
$173,297
FILES CLOSED FOR INCOMPLETENESS
0
$0
2
$128,040
14
$139,266
1
$16,000
1
$204,860
Aggregated Statistics For Year 2002 (Based on 4 partial tracts)
A) FHA, FSA/RHS & VA Home Purchase Loans
B) Conventional Home Purchase Loans
C) Refinancings
D) Home Improvement Loans
F) Non-occupant Loans on < 5 Family Dwellings (A B C & D)
Number
Average Value
Number
Average Value
Number
Average Value
Number
Average Value
Number
Average Value
LOANS ORIGINATED
14
$119,232
112
$124,654
277
$129,483
11
$20,973
16
$149,716
APPLICATIONS APPROVED, NOT ACCEPTED
0
$0
3
$57,033
32
$145,032
1
$16,930
0
$0
APPLICATIONS DENIED
1
$132,310
8
$117,304
58
$144,218
9
$20,020
2
$978,160
APPLICATIONS WITHDRAWN
1
$43,100
9
$152,827
52
$130,337
4
$22,445
3
$110,967
FILES CLOSED FOR INCOMPLETENESS
1
$145,110
2
$74,400
16
$127,795
1
$74,690
2
$142,445
Aggregated Statistics For Year 2001 (Based on 4 partial tracts)
A) FHA, FSA/RHS & VA Home Purchase Loans
B) Conventional Home Purchase Loans
C) Refinancings
D) Home Improvement Loans
E) Loans on Dwellings For 5+ Families
F) Non-occupant Loans on < 5 Family Dwellings (A B C & D)
Number
Average Value
Number
Average Value
Number
Average Value
Number
Average Value
Number
Average Value
Number
Average Value
LOANS ORIGINATED
16
$107,866
100
$124,284
223
$121,899
15
$17,575
1
$430,980
19
$115,411
APPLICATIONS APPROVED, NOT ACCEPTED
1
$85,430
12
$121,304
13
$113,007
6
$58,443
0
$0
0
$0
APPLICATIONS DENIED
1
$76,820
10
$202,954
28
$104,652
6
$12,982
0
$0
2
$164,320
APPLICATIONS WITHDRAWN
1
$187,790
4
$345,238
35
$121,359
3
$56,197
0
$0
3
$158,627
FILES CLOSED FOR INCOMPLETENESS
1
$49,250
0
$0
6
$138,355
0
$0
0
$0
0
$0
Aggregated Statistics For Year 2000 (Based on 4 partial tracts)
A) FHA, FSA/RHS & VA Home Purchase Loans
B) Conventional Home Purchase Loans
C) Refinancings
D) Home Improvement Loans
F) Non-occupant Loans on < 5 Family Dwellings (A B C & D)
Number
Average Value
Number
Average Value
Number
Average Value
Number
Average Value
Number
Average Value
LOANS ORIGINATED
18
$122,324
114
$126,200
62
$100,626
9
$29,953
13
$87,287
APPLICATIONS APPROVED, NOT ACCEPTED
0
$0
12
$228,459
14
$115,811
4
$12,520
2
$97,630
APPLICATIONS DENIED
0
$0
7
$124,489
29
$126,844
8
$10,431
2
$60,145
APPLICATIONS WITHDRAWN
1
$36,940
12
$127,448
17
$82,246
2
$33,075
1
$83,120
FILES CLOSED FOR INCOMPLETENESS
1
$60,800
3
$175,667
6
$97,808
0
$0
0
$0
Aggregated Statistics For Year 1999 (Based on 2 partial tracts)
A) FHA, FSA/RHS & VA Home Purchase Loans
B) Conventional Home Purchase Loans
C) Refinancings
D) Home Improvement Loans
F) Non-occupant Loans on < 5 Family Dwellings (A B C & D)

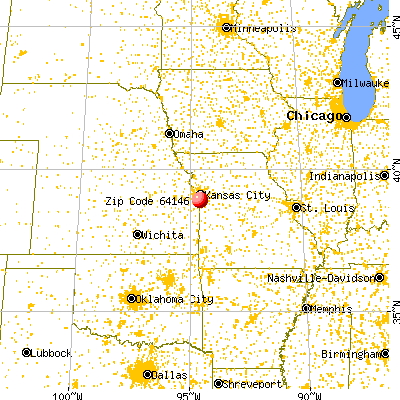


 Nearest zip codes: 64145, 64147, 64030, 64131, 66224, 64137.