Estimated zip code population in 2022: 8,344 Zip code population in 2010: 7,658 Zip code population in 2000: 4,431
Houses and condos: 3,575 Renter-occupied apartments: 495
% of renters here:
14%
State:
33%
March 2022 cost of living index in zip code 62062: 95.4 (near average, U.S. average is 100)
Land area: 6.4 sq. mi. Water area: 0.1 sq. mi.
Population density: 1,299 people per square mile
(low).
OSM Map
General Map
Google Map
MSN Map
OSM Map
General Map
Google Map
MSN Map
OSM Map
General Map
Google Map
MSN Map
OSM Map
General Map
Google Map
MSN Map
Please wait while loading the map...
Real estate property taxes paid for housing units in 2022:
This zip code:
1.8% ($4,520)
Illinois:
2.0% ($4,912)
Median real estate property taxes paid for housing units with mortgages in 2022: $4,407 (1.8%) Median real estate property taxes paid for housing units with no mortgage in 2022: $4,807 (1.9%)
Averages for the 2020 tax year for zip code 62062, filed in 2021:
Average Adjusted Gross Income (AGI) in 2020: $88,837 (Individual Income Tax Returns)
Here:
$88,837
State:
$82,626
Salary/wage: $73,506 (reported on 78.6% of returns)
Here:
$73,506
State:
$66,640
(% of AGI for various income ranges: 1116.3% for AGIs below $25k, 3314.7% for AGIs $25k-50k, 5496.7% for AGIs $50k-75k, 8431.8% for AGIs $75k-100k, 15744.5% for AGIs $100k-200k, 53710.0% for AGIs over 200k)
Taxable interest for individuals: $1,476 (reported on 47.3% of returns)
This zip code:
$1,476
Illinois:
$2,376
(% of AGI for various income ranges: 29.0% for AGIs below $25k, 41.6% for AGIs $25k-50k, 47.2% for AGIs $50k-75k, 105.6% for AGIs $75k-100k, 123.6% for AGIs $100k-200k, 1031.8% for AGIs over 200k)
Ordinary dividends: $5,414 (reported on 31.2% of returns)
Here:
$5,414
State:
$9,061
(% of AGI for various income ranges: 49.0% for AGIs below $25k, 77.5% for AGIs $25k-50k, 100.4% for AGIs $50k-75k, 300.3% for AGIs $75k-100k, 276.8% for AGIs $100k-200k, 2811.8% for AGIs over 200k)
Net capital gain/loss in AGI: +$9,508 (reported on 27.5% of returns)
Here:
+$9,508
State:
+$31,684
(% of AGI for various income ranges: 14.4% for AGIs below $25k, 32.7% for AGIs $25k-50k, 90.7% for AGIs $50k-75k, 230.0% for AGIs $75k-100k, 330.7% for AGIs $100k-200k, 6780.0% for AGIs over 200k)
Profit/loss from business: +$13,463 (reported on 12.1% of returns)
Here:
+$13,463
State:
+$12,175
(% of AGI for various income ranges: 93.0% for AGIs below $25k, 65.3% for AGIs $25k-50k, 149.3% for AGIs $50k-75k, 134.1% for AGIs $75k-100k, 338.3% for AGIs $100k-200k, 2285.5% for AGIs over 200k)
Taxable individual retirement arrangement distribution: $22,849 (reported on 15.6% of returns)
62062:
$22,849
Illinois:
$21,613
(% of AGI for various income ranges: 91.7% for AGIs below $25k, 184.7% for AGIs $25k-50k, 312.6% for AGIs $50k-75k, 692.1% for AGIs $75k-100k, 960.7% for AGIs $100k-200k, 2937.3% for AGIs over 200k)
Total itemized deductions: $29,778 (reported on 9.3% of returns)
Here:
$29,778
State:
$34,948
(% of AGI for various income ranges: 150.2% for AGIs $25k-50k, 280.9% for AGIs $50k-75k, 388.5% for AGIs $75k-100k, 639.0% for AGIs $100k-200k, 3693.6% for AGIs over 200k)
Charity contributions: $10,331 (reported on 7.5% of returns)
Here:
$10,331
State:
$13,122
(% of AGI for various income ranges: 9.6% for AGIs below $25k, 39.1% for AGIs $50k-75k, 75.0% for AGIs $75k-100k, 199.7% for AGIs $100k-200k, 1296.4% for AGIs over 200k)
Taxes paid: $8,272 (reported on 9.1% of returns)
62062:
$8,272
State:
$8,563
(% of AGI for various income ranges: 28.4% for AGIs $25k-50k, 82.2% for AGIs $50k-75k, 131.2% for AGIs $75k-100k, 208.4% for AGIs $100k-200k, 734.5% for AGIs over 200k)
Earned income credit: $1,812 (reported on 5.8% of returns)
Here:
$1,812
State:
$2,311
(% of AGI for various income ranges: 41.1% for AGIs below $25k, 30.0% for AGIs $25k-50k)
Percentage of individuals using paid preparers for their 2020 taxes: 93.7%
Here:
94%
State:
93%
(% for various income ranges: 92.2% for AGIs below $25k, 91.7% for AGIs $25k-50k, 95.2% for AGIs $50k-75k, 96.1% for AGIs $75k-100k, 94.6% for AGIs $100k-200k, 93.5% for AGIs over 200k)
Averages for the 2012 tax year for zip code 62062, filed in 2013:
Average Adjusted Gross Income (AGI) in 2012: $79,876 (Individual Income Tax Returns)
Here:
$79,876
State:
$68,058
Salary/wage: $69,442 (reported on 83.3% of returns)
Here:
$69,442
State:
$55,396
(% of AGI for various income ranges: 69.1% for AGIs below $25k, 68.6% for AGIs $25k-50k, 70.6% for AGIs $50k-75k, 76.9% for AGIs $75k-100k, 80.4% for AGIs $100k-200k, 59.3% for AGIs over 200k)
Taxable interest for individuals: $1,848 (reported on 54.0% of returns)
This zip code:
$1,848
Illinois:
$1,969
(% of AGI for various income ranges: 2.3% for AGIs below $25k, 1.1% for AGIs $25k-50k, 1.1% for AGIs $50k-75k, 0.8% for AGIs $75k-100k, 0.7% for AGIs $100k-200k, 2.4% for AGIs over 200k)
Ordinary dividends: $3,272 (reported on 30.8% of returns)
Here:
$3,272
State:
$7,786
(% of AGI for various income ranges: 2.3% for AGIs below $25k, 1.3% for AGIs $25k-50k, 1.3% for AGIs $50k-75k, 1.0% for AGIs $75k-100k, 1.1% for AGIs $100k-200k, 1.5% for AGIs over 200k)
Net capital gain/loss in AGI: +$4,648 (reported on 22.4% of returns)
Here:
+$4,648
State:
+$22,183
(% of AGI for various income ranges: 0.2% for AGIs $25k-50k, 0.5% for AGIs $75k-100k, 0.9% for AGIs $100k-200k, 3.9% for AGIs over 200k)
Profit/loss from business: +$13,963 (reported on 11.8% of returns)
Here:
+$13,963
State:
+$12,903
(% of AGI for various income ranges: 4.8% for AGIs below $25k, 4.0% for AGIs $25k-50k, 1.9% for AGIs $50k-75k, 1.5% for AGIs $75k-100k, 2.0% for AGIs $100k-200k, 1.6% for AGIs over 200k)
Taxable individual retirement arrangement distribution: $14,727 (reported on 14.1% of returns)
62062:
$14,727
Illinois:
$17,929
(% of AGI for various income ranges: 6.3% for AGIs below $25k, 4.1% for AGIs $25k-50k, 3.4% for AGIs $50k-75k, 2.9% for AGIs $75k-100k, 2.1% for AGIs $100k-200k, 1.7% for AGIs over 200k)
Self-employment retirement plans: $14,350 (reported on 0.5% of returns)
62062:
$14,350
Illinois:
$24,666
Total itemized deductions: $22,166 (18% of AGI, reported on 50.6% of returns)
Here:
$22,166
State:
$26,433
Here:
18.1% of AGI
State:
19.2% of AGI
(% of AGI for various income ranges: 14.5% for AGIs below $25k, 13.1% for AGIs $25k-50k, 15.0% for AGIs $50k-75k, 14.8% for AGIs $75k-100k, 15.5% for AGIs $100k-200k, 11.0% for AGIs over 200k)
Charity contributions: $3,316 (reported on 41.4% of returns)
Here:
$3,316
State:
$4,525
(% of AGI for various income ranges: 0.9% for AGIs below $25k, 1.4% for AGIs $25k-50k, 1.6% for AGIs $50k-75k, 1.7% for AGIs $75k-100k, 1.9% for AGIs $100k-200k, 1.7% for AGIs over 200k)
Taxes paid: $10,297 (reported on 50.6% of returns)
62062:
$10,297
State:
$11,968
(% of AGI for various income ranges: 3.9% for AGIs below $25k, 4.5% for AGIs $25k-50k, 6.2% for AGIs $50k-75k, 6.6% for AGIs $75k-100k, 7.5% for AGIs $100k-200k, 6.2% for AGIs over 200k)
Earned income credit: $1,938 (reported on 7.5% of returns)
Here:
$1,938
State:
$2,349
(% of AGI for various income ranges: 3.7% for AGIs below $25k, 0.5% for AGIs $25k-50k)
Percentage of individuals using paid preparers for their 2012 taxes: 57.1%
Here:
57%
State:
57%
(% for various income ranges: 48.6% for AGIs below $25k, 57.6% for AGIs $25k-50k, 61.7% for AGIs $50k-75k, 57.4% for AGIs $75k-100k, 60.9% for AGIs $100k-200k, 70.6% for AGIs over 200k)
Averages for the 2004 tax year for zip code 62062, filed in 2005:
Average Adjusted Gross Income (AGI) in 2004: $63,549 (Individual Income Tax Returns)
Here:
$63,549
State:
$54,625
Salary/wage: $55,962 (reported on 86.8% of returns)
Here:
$55,962
State:
$46,811
(% of AGI for various income ranges: 111.4% for AGIs below $10k, 69.2% for AGIs $10k-25k, 75.7% for AGIs $25k-50k, 81.8% for AGIs $50k-75k, 85.9% for AGIs $75k-100k, 70.1% for AGIs over 100k)
Taxable interest for individuals: $1,528 (reported on 61.0% of returns)
This zip code:
$1,528
Illinois:
$2,101
(% of AGI for various income ranges: 4.8% for AGIs below $10k, 3.9% for AGIs $10k-25k, 2.2% for AGIs $25k-50k, 0.9% for AGIs $50k-75k, 0.9% for AGIs $75k-100k, 1.5% for AGIs over 100k)
Taxable dividends: $1,963 (reported on 35.2% of returns)
Here:
$1,963
State:
$4,306
(% of AGI for various income ranges: 3.4% for AGIs below $10k, 2.4% for AGIs $10k-25k, 0.9% for AGIs $25k-50k, 0.8% for AGIs $50k-75k, 0.8% for AGIs $75k-100k, 1.2% for AGIs over 100k)
Net capital gain/loss: +$5,026 (reported on 26.1% of returns)
Here:
+$5,026
State:
+$17,321
(% of AGI for various income ranges: -1.9% for AGIs below $10k, 0.7% for AGIs $10k-25k, 0.7% for AGIs $25k-50k, 0.2% for AGIs $50k-75k, 0.8% for AGIs $75k-100k, 3.9% for AGIs over 100k)
Profit/loss from business: +$19,861 (reported on 13.6% of returns)
Here:
+$19,861
State:
+$11,771
(% of AGI for various income ranges: 3.3% for AGIs below $10k, 2.9% for AGIs $10k-25k, 2.7% for AGIs $25k-50k, 2.1% for AGIs $50k-75k, 1.9% for AGIs $75k-100k, 6.7% for AGIs over 100k)
Profit/loss from farming: +$1,818 (reported on 0.4% of returns)
Here:
+$1,818
State:
+$2,327
IRA payment deduction: $3,261 (reported on 3.0% of returns)
62062:
$3,261
Illinois:
$3,087
(% of AGI for various income ranges: 0.5% for AGIs $25k-50k, 0.2% for AGIs $50k-75k, 0.1% for AGIs $75k-100k, 0.1% for AGIs over 100k)
Self-employed pension: $13,300 (reported on 0.6% of returns)
Here:
$13,300
Illinois:
$16,965
Total itemized deductions: $17,371 (18% of AGI, reported on 48.9% of returns)
Here:
$17,371
State:
$20,239
Here:
17.7% of AGI
State:
19.5% of AGI
(% of AGI for various income ranges: 9.7% for AGIs below $10k, 11.4% for AGIs $10k-25k, 12.0% for AGIs $25k-50k, 14.8% for AGIs $50k-75k, 15.1% for AGIs $75k-100k, 12.6% for AGIs over 100k)
Charity contributions deductions: $2,770 (3% of AGI, reported on 42.2% of returns)
Here:
$2,770
State:
$3,719
Here:
2.7% of AGI
State:
3.4% of AGI
(% of AGI for various income ranges: 0.8% for AGIs below $10k, 1.0% for AGIs $10k-25k, 1.1% for AGIs $25k-50k, 1.8% for AGIs $50k-75k, 1.7% for AGIs $75k-100k, 2.2% for AGIs over 100k)
Total tax: $10,180 (reported on 84.3% of returns)
62062:
$10,180
State:
$9,882
(% of AGI for various income ranges: 2.4% for AGIs below $10k, 4.6% for AGIs $10k-25k, 7.9% for AGIs $25k-50k, 9.5% for AGIs $50k-75k, 10.8% for AGIs $75k-100k, 18.7% for AGIs over 100k)
Earned income credit: $1,280 (reported on 7.0% of returns)
Here:
$1,280
State:
$1,788
Percentage of individuals using paid preparers for their 2004 taxes: 58.8%
Here:
59%
State:
61%
(% for various income ranges: 44.8% for AGIs below $10k, 60.3% for AGIs $10k-25k, 63.1% for AGIs $25k-50k, 60.6% for AGIs $50k-75k, 58.2% for AGIs $75k-100k, 64.2% for AGIs over 100k)
Likely homosexual households (counted as self-reported same-sex unmarried-partner households)
Lesbian couples: 0.0% of all households
Gay men: 0.4% of all households
Household received Food Stamps/SNAP in the past 12 months: 169 Household did not receive Food Stamps/SNAP in the past 12 months: 3,324
Women who had a birth in the past 12 months: 97 (96 now married, 0 unmarried) Women who did not have a birth in the past 12 months: 1,538 (743 now married, 789 unmarried)
Housing units in zip code 62062 with a mortgage: 2,222 (224 second mortgage, 139 both second mortgage and home equity loan) Median monthly owner costs for units with a mortgage: $1,539 Median monthly owner costs for units without a mortgage: $729
Residents with income below the poverty level in 2022:
This zip code:
3.3%
Whole state:
11.9%
Residents with income below 50% of the poverty level in 2022:
This zip code:
2.3%
Whole state:
5.7%
Median number of rooms in houses and condos:
Here:
6.4
State:
6.4
Median number of rooms in apartments:
Here:
3.8
State:
4.1
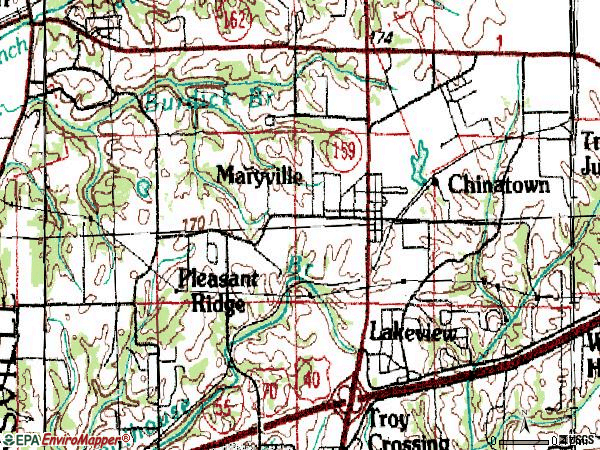
Notable locations in this zip code not listed on our city pages
Churches in zip code 62062 include: Saint Johns Lutheran Church (A), Maryville First Baptist Church (B), First Baptist Church (C), Saint Lukes Methodist Church (D), Saint Marys Catholic Church (E), Maryville Assembly of God Church (F), Lords Lutheran Church (G). Display/hide their locations on the map
Cemeteries: Saint John Lutheran Cemetery (1), Cook Family Cemetery (2), Krome Family Cemetery (3), Old Saint Johns Cemetery (4), Peters Cemetery (5), Buck Road Cemetery (6). Display/hide their locations on the map
In group quarters: 192 (-1 institutionalized population)
Size of family households: 1,142 2-persons, 488 3-persons, 322 4-persons, 227 5-persons, 45 6-persons
Size of nonfamily households: 1,042 1-person, 268 2-persons
1,105 married couples with children.
159 single-parent households (85 men, 74 women).
96.9% of residents of 62062 zip code speak English at home.
0.9% of residents speak Spanish at home (96% very well, 4% well).
2.0% of residents speak Asian or Pacific Island language at home (63% very well, 32% well, 6% not well).
Foreign born population: 237 (2.9%) (62.6% of them are naturalized citizens)
This zip code:
2.9%
Whole state:
14.4%
37%Malaysia
18%Taiwan
14%Bhutan
11%Indonesia
26%German
14%English
13%European
10%American
6%Irish
3%Czech
2%Swiss
Year of entry for the foreign-born population
1072010 or later
02000 to 2009
941990 to 1999
164Before 1990
Facilities with environmental interests located in this zip code:
ANDERSON HOSPITAL (RT. 162 AND OLD EDWARDSVILLE RD in MARYVILLE, IL)
STATE MASTER (Illinois EPA Project) - SOLID WASTE PROGRAM, HAZARDOUS WASTE PROGRAM, AIR PROGRAM AIR MINOR (AIRS/AFS) COMPLIANCE ACTIVITY (Tracking inspections of insecticide, fungicide, and rodenticide, and toxic substances) CRITERIA AND HAZARDOUS AIR POLLUTANT INVENTORY (Inventory of air pollution sources) Small Quantity Generators, between 100 kg and 1000 kg of hazardous waste/month (Resource Conservation and Recovery Act (tracking hazardous waste)) - notification Business SIC and NAICS classification: GENERAL MEDICAL AND SURGICAL HOSPITALS Alternative names: SOUTHWESTERN ILLINOIS HEALTH FACILITIES
ILLINOIS POWER CO (2600 N CENTER in MARYVILLE, IL)
STATE MASTER (Illinois EPA Project) - SOLID WASTE PROGRAM, HAZARDOUS WASTE PROGRAM, AIR PROGRAM AIR MINOR (AIRS/AFS) CRITERIA AND HAZARDOUS AIR POLLUTANT INVENTORY (Inventory of air pollution sources) Business SIC classification: ELECTRIC AND OTHER SERVICES COMBINED Alternative names: ILLINOIS POWER COMPANY MARYVILLE SERVICE
PEYLA AUTO BODY (18 SCHRIEBER CT in MARYVILLE, IL)
STATE MASTER (Illinois EPA Project) - SOLID WASTE PROGRAM (Resource Conservation and Recovery Act (tracking hazardous waste))
KURTS CARSTAR COLLISION CTR (1 MUELLER DR in MARYVILLE, IL)
STATE MASTER (Illinois EPA Project) - SOLID WASTE PROGRAM, HAZARDOUS WASTE PROGRAM Conditionally Exempt Small Quantity Generators, less than 100 kg/month of hazardous waste (Resource Conservation and Recovery Act (tracking hazardous waste)) Organizations: KURT MUELLER (CONTACT/OPERATOR)
Alternative names: KURTS AUTO BODY
MARYVILLE WTP (ILLINOIS ROUTE 157 in MARYVILLE, IL)
STATE MASTER (Illinois EPA Project) - National Pollutant Discharge Elimination System Permit National Pollutant Discharge Elimination System NON-MAJOR (Tracking pollutant discharge elimination systems) - permit Business SIC classification: WATER SUPPLY Alternative names: MARYVILLE WTP, VILLAGE OF
IL BELL (505 N CENTER in MARYVILLE, IL)
STATE MASTER (Illinois EPA Project) - HAZARDOUS WASTE PROGRAM Small Quantity Generators, between 100 kg and 1000 kg of hazardous waste/month (Resource Conservation and Recovery Act (tracking hazardous waste)) - notification Organizations: IL BELL TELEPHONE (CONTACT/OWNER)
Alternative names: ILL BELL TEL
IL BELL (2501 N CENTER AVE in MARYVILLE, IL)
STATE MASTER (Illinois EPA Project) - HAZARDOUS WASTE PROGRAM Small Quantity Generators, between 100 kg and 1000 kg of hazardous waste/month (Resource Conservation and Recovery Act (tracking hazardous waste)) - notification Organizations: ILL BELL TEL CO (CONTACT/OWNER)
Alternative names: ILL BELL TEL CO
MARYVILLE HHW COLLECTION (2600 N CENTER ST SITE B in MARYVILLE, IL)
STATE MASTER (Illinois EPA Project) - HAZARDOUS WASTE PROGRAM Small Quantity Generators, between 100 kg and 1000 kg of hazardous waste/month (Resource Conservation and Recovery Act (tracking hazardous waste)) - notification Organizations: IL EPA (CONTACT/OWNER)
MARYVILLE ELEM SCHOOL (6900 W MAIN ST in MARYVILLE, IL)
(National Center for Education Statistics) - STATE ID-4105701002022 Organizations: COLLINSVILLE C U SCH DIST 10 (SCHOOL DISTRICT)
ILLINOIS POWER CO (RTE 159 N in MARYVILLE, IL)
Large Quantity Generators, more that 1000 kg of hazardous waste/month (Resource Conservation and Recovery Act (tracking hazardous waste)) - notification USED OIL PROGRAM (Resource Conservation and Recovery Act (tracking hazardous waste))
AKZO NOBEL (7 SCHIBER CT in MARYVILLE, IL)
Small Quantity Generators, between 100 kg and 1000 kg of hazardous waste/month (Resource Conservation and Recovery Act (tracking hazardous waste)) - notification Alternative names: MID STATES AUTO BODY SUPPLY
70.6%Utility gas
26.4%Electricity
2.5%Bottled, tank, or LP gas
0.6%Other fuel
Place of birth for U.S.-born residents:
This state: 4,791
Northeast: 70
Midwest: 2,449
South: 450
West: 235
52% of the 62062 zip code residents lived in the same house 5 years ago. Out of people who lived in different houses, 60% lived in this county. Out of people who lived in different counties, 50% lived in Illinois.
93% of the 62062 zip code residents lived in the same house 1 year ago. Out of people who lived in different houses, 48% moved from this county. Out of people who lived in different houses, 20% moved from different county within same state. Out of people who lived in different houses, 34% moved from different state.
Private vs. public school enrollment:
Students in private schools in grades 1 to 8 (elementary and middle school): 532
Here:
74.2%
Illinois:
13.3%
Students in private schools in grades 9 to 12 (high school): 60
Here:
16.7%
Illinois:
9.9%
Students in private undergraduate colleges: 25
Here:
5.8%
Illinois:
27.4%
Occupation by median earnings in the past 12 months ($)
225,393Legal occupations
137,450Computer and mathematical occupations
135,448Life, physical, and social science occupations
106,249Architecture and engineering occupations
100,992Construction and extraction occupations
91,572Health diagnosing and treating practitioners and other technical occupations
Companies with federal contracts located in this zip code:
DOYLE E BRADY (7650 STONEBRIDGE GOLF DRIV in MARYVILLE, IL; small business)
$50,448 with Air Force for Miscellaneous Items. Signed on 2003-09-08. Completion date: 2003-09-30.
Top industries in this zip code by the number of employees in 2005:
Health Care and Social Assistance: General Medical and Surgical Hospitals (500-999 employees: 1 establishment)
Health Care and Social Assistance: Offices of Physicians (except Mental Health Specialists) (20-49: 2, 10-19: 3, 5-9: 9, 1-4: 9)
Utilities: Electric Power Distribution (100-249: 1, 1-4: 2)
Other Services (except Public Administration): Civic and Social Organizations (100-249: 1, 1-4: 1)
Accommodation and Food Services: Full-Service Restaurants (50-99: 1, 20-49: 2)
Other Services (except Public Administration): Religious Organizations (50-99: 1, 5-9: 4, 1-4: 3)
Educational Services: Elementary and Secondary Schools (50-99: 1, 1-4: 1)
Health Care and Social Assistance: Nursing Care Facilities (50-99: 1, 1-4: 1)
Health Care and Social Assistance: Continuing Care Retirement Communities (50-99: 1)
Health Care and Social Assistance: Residential Mental Health and Substance Abuse Facilities (50-99: 1)
People in group quarters in 2010:
145 people in nursing facilities/skilled-nursing facilities
People in group quarters in 2000:
207 people in nursing homes
28 people in homes or halfway houses for drug/alcohol abuse
Home Mortgage Disclosure Act Aggregated Statistics For Year 2009 (Based on 2 partial tracts)
A) FHA, FSA/RHS & VA Home Purchase Loans
B) Conventional Home Purchase Loans
C) Refinancings
D) Home Improvement Loans
E) Loans on Dwellings For 5+ Families
F) Non-occupant Loans on < 5 Family Dwellings (A B C & D)
G) Loans On Manufactured Home Dwelling (A B C & D)
Number
Average Value
Number
Average Value
Number
Average Value
Number
Average Value
Number
Average Value
Number
Average Value
Number
Average Value
LOANS ORIGINATED
37
$172,870
63
$146,920
302
$160,661
18
$65,823
2
$647,220
12
$119,385
5
$35,868
APPLICATIONS APPROVED, NOT ACCEPTED
1
$234,780
3
$157,500
21
$145,800
2
$42,000
0
$0
2
$63,210
0
$0
APPLICATIONS DENIED
3
$196,140
5
$111,636
39
$158,092
8
$56,858
0
$0
3
$120,260
2
$35,700
APPLICATIONS WITHDRAWN
2
$149,100
3
$133,980
60
$171,045
2
$32,340
0
$0
0
$0
1
$99,120
FILES CLOSED FOR INCOMPLETENESS
1
$138,180
1
$275,940
5
$139,272
0
$0
0
$0
0
$0
0
$0
Aggregated Statistics For Year 2008 (Based on 2 partial tracts)
A) FHA, FSA/RHS & VA Home Purchase Loans
B) Conventional Home Purchase Loans
C) Refinancings
D) Home Improvement Loans
E) Loans on Dwellings For 5+ Families
F) Non-occupant Loans on < 5 Family Dwellings (A B C & D)
G) Loans On Manufactured Home Dwelling (A B C & D)
Number
Average Value
Number
Average Value
Number
Average Value
Number
Average Value
Number
Average Value
Number
Average Value
Number
Average Value
LOANS ORIGINATED
19
$180,335
76
$169,476
136
$162,061
17
$68,880
1
$133,980
15
$148,568
2
$62,580
APPLICATIONS APPROVED, NOT ACCEPTED
2
$115,500
5
$183,792
14
$163,410
3
$33,040
0
$0
1
$146,580
0
$0
APPLICATIONS DENIED
5
$172,536
5
$165,312
32
$163,419
6
$43,540
0
$0
3
$105,840
0
$0
APPLICATIONS WITHDRAWN
2
$141,960
9
$155,120
28
$169,740
3
$135,240
0
$0
1
$84,840
0
$0
FILES CLOSED FOR INCOMPLETENESS
0
$0
2
$139,860
4
$181,650
0
$0
0
$0
0
$0
0
$0
Aggregated Statistics For Year 2007 (Based on 2 partial tracts)
A) FHA, FSA/RHS & VA Home Purchase Loans
B) Conventional Home Purchase Loans
C) Refinancings
D) Home Improvement Loans
E) Loans on Dwellings For 5+ Families
F) Non-occupant Loans on < 5 Family Dwellings (A B C & D)
G) Loans On Manufactured Home Dwelling (A B C & D)
Number
Average Value
Number
Average Value
Number
Average Value
Number
Average Value
Number
Average Value
Number
Average Value
Number
Average Value
LOANS ORIGINATED
8
$192,360
154
$147,543
110
$146,454
23
$30,459
1
$242,340
19
$129,891
3
$58,800
APPLICATIONS APPROVED, NOT ACCEPTED
0
$0
14
$165,480
18
$153,580
7
$54,120
0
$0
2
$110,250
1
$23,100
APPLICATIONS DENIED
1
$76,440
12
$139,440
42
$156,260
10
$81,858
0
$0
2
$73,080
0
$0
APPLICATIONS WITHDRAWN
1
$181,860
15
$154,280
26
$152,105
2
$93,450
0
$0
1
$149,100
0
$0
FILES CLOSED FOR INCOMPLETENESS
0
$0
1
$215,040
11
$172,544
1
$33,600
0
$0
0
$0
0
$0
Aggregated Statistics For Year 2006 (Based on 2 partial tracts)
A) FHA, FSA/RHS & VA Home Purchase Loans
B) Conventional Home Purchase Loans
C) Refinancings
D) Home Improvement Loans
E) Loans on Dwellings For 5+ Families
F) Non-occupant Loans on < 5 Family Dwellings (A B C & D)
G) Loans On Manufactured Home Dwelling (A B C & D)
Number
Average Value
Number
Average Value
Number
Average Value
Number
Average Value
Number
Average Value
Number
Average Value
Number
Average Value
LOANS ORIGINATED
6
$177,870
146
$141,045
122
$128,637
28
$50,415
2
$176,610
24
$137,620
7
$41,820
APPLICATIONS APPROVED, NOT ACCEPTED
1
$132,300
14
$105,120
18
$121,473
4
$18,585
0
$0
1
$79,800
2
$31,710
APPLICATIONS DENIED
1
$193,200
14
$148,530
41
$162,642
9
$57,120
0
$0
2
$192,780
3
$56,420
APPLICATIONS WITHDRAWN
1
$162,960
9
$137,760
35
$153,720
1
$134,400
0
$0
0
$0
0
$0
FILES CLOSED FOR INCOMPLETENESS
0
$0
3
$189,700
8
$141,330
2
$49,350
0
$0
0
$0
0
$0
Aggregated Statistics For Year 2005 (Based on 2 partial tracts)
A) FHA, FSA/RHS & VA Home Purchase Loans
B) Conventional Home Purchase Loans
C) Refinancings
D) Home Improvement Loans
E) Loans on Dwellings For 5+ Families
F) Non-occupant Loans on < 5 Family Dwellings (A B C & D)
G) Loans On Manufactured Home Dwelling (A B C & D)
Number
Average Value
Number
Average Value
Number
Average Value
Number
Average Value
Number
Average Value
Number
Average Value
Number
Average Value
LOANS ORIGINATED
8
$166,688
162
$140,713
146
$128,684
26
$54,132
1
$160,440
18
$98,397
6
$42,910
APPLICATIONS APPROVED, NOT ACCEPTED
0
$0
13
$111,752
16
$140,726
4
$30,660
0
$0
0
$0
6
$44,590
APPLICATIONS DENIED
0
$0
21
$122,520
43
$143,992
11
$34,669
0
$0
3
$121,380
6
$54,390
APPLICATIONS WITHDRAWN
0
$0
26
$154,318
33
$153,478
3
$224,280
0
$0
2
$84,420
1
$55,440
FILES CLOSED FOR INCOMPLETENESS
0
$0
3
$118,440
11
$143,716
1
$50,400
0
$0
0
$0
0
$0
Aggregated Statistics For Year 2004 (Based on 2 partial tracts)
A) FHA, FSA/RHS & VA Home Purchase Loans
B) Conventional Home Purchase Loans
C) Refinancings
D) Home Improvement Loans
F) Non-occupant Loans on < 5 Family Dwellings (A B C & D)
G) Loans On Manufactured Home Dwelling (A B C & D)
Number
Average Value
Number
Average Value
Number
Average Value
Number
Average Value
Number
Average Value
Number
Average Value
LOANS ORIGINATED
13
$149,843
160
$139,605
169
$129,057
19
$74,340
15
$149,464
4
$35,280
APPLICATIONS APPROVED, NOT ACCEPTED
0
$0
12
$123,690
13
$169,389
3
$73,640
2
$123,270
3
$57,120
APPLICATIONS DENIED
0
$0
16
$118,860
42
$126,990
3
$42,980
2
$101,010
4
$49,245
APPLICATIONS WITHDRAWN
1
$232,260
8
$132,142
39
$126,237
3
$62,160
1
$258,300
0
$0
FILES CLOSED FOR INCOMPLETENESS
0
$0
3
$109,340
7
$157,020
0
$0
0
$0
0
$0
Aggregated Statistics For Year 2003 (Based on 2 partial tracts)
A) FHA, FSA/RHS & VA Home Purchase Loans
B) Conventional Home Purchase Loans
C) Refinancings
D) Home Improvement Loans
E) Loans on Dwellings For 5+ Families
F) Non-occupant Loans on < 5 Family Dwellings (A B C & D)
Number
Average Value
Number
Average Value
Number
Average Value
Number
Average Value
Number
Average Value
Number
Average Value
LOANS ORIGINATED
13
$142,348
149
$134,544
471
$118,018
20
$59,892
1
$409,920
19
$131,283
APPLICATIONS APPROVED, NOT ACCEPTED
0
$0
10
$139,356
42
$116,990
2
$16,170
0
$0
2
$98,280
APPLICATIONS DENIED
2
$146,580
13
$91,366
58
$122,531
5
$9,576
0
$0
1
$95,760
APPLICATIONS WITHDRAWN
1
$168,840
8
$108,990
46
$109,510
0
$0
0
$0
1
$129,780
FILES CLOSED FOR INCOMPLETENESS
0
$0
3
$108,360
8
$112,402
0
$0
0
$0
0
$0
Aggregated Statistics For Year 2002 (Based on 2 partial tracts)
A) FHA, FSA/RHS & VA Home Purchase Loans
B) Conventional Home Purchase Loans
C) Refinancings
D) Home Improvement Loans
F) Non-occupant Loans on < 5 Family Dwellings (A B C & D)
Number
Average Value
Number
Average Value
Number
Average Value
Number
Average Value
Number
Average Value
LOANS ORIGINATED
16
$132,589
111
$130,245
331
$116,188
19
$28,626
11
$90,300
APPLICATIONS APPROVED, NOT ACCEPTED
0
$0
9
$87,453
34
$119,231
4
$17,850
1
$76,860
APPLICATIONS DENIED
1
$79,800
10
$76,902
37
$134,128
7
$15,180
1
$12,180
APPLICATIONS WITHDRAWN
2
$141,960
6
$100,800
31
$103,035
1
$37,800
0
$0
FILES CLOSED FOR INCOMPLETENESS
0
$0
1
$185,220
5
$145,320
0
$0
0
$0
Aggregated Statistics For Year 2001 (Based on 2 partial tracts)
A) FHA, FSA/RHS & VA Home Purchase Loans
B) Conventional Home Purchase Loans
C) Refinancings
D) Home Improvement Loans
F) Non-occupant Loans on < 5 Family Dwellings (A B C & D)
Number
Average Value
Number
Average Value
Number
Average Value
Number
Average Value
Number
Average Value
LOANS ORIGINATED
21
$115,980
103
$121,066
223
$111,130
21
$38,120
21
$94,800
APPLICATIONS APPROVED, NOT ACCEPTED
1
$131,880
12
$74,270
21
$98,720
3
$19,180
1
$36,540
APPLICATIONS DENIED
1
$111,300
25
$53,256
34
$85,025
5
$15,456
5
$40,320
APPLICATIONS WITHDRAWN
3
$108,080
7
$112,020
18
$92,050
4
$48,090
0
$0
FILES CLOSED FOR INCOMPLETENESS
0
$0
1
$127,680
5
$136,332
1
$32,760
0
$0
Aggregated Statistics For Year 2000 (Based on 2 partial tracts)
A) FHA, FSA/RHS & VA Home Purchase Loans
B) Conventional Home Purchase Loans
C) Refinancings
D) Home Improvement Loans
F) Non-occupant Loans on < 5 Family Dwellings (A B C & D)
Number
Average Value
Number
Average Value
Number
Average Value
Number
Average Value
Number
Average Value
LOANS ORIGINATED
15
$115,164
118
$109,577
60
$96,362
26
$19,998
24
$103,495
APPLICATIONS APPROVED, NOT ACCEPTED
1
$113,820
8
$88,358
9
$68,693
3
$15,960
0
$0
APPLICATIONS DENIED
1
$128,100
18
$54,647
17
$58,182
6
$21,420
2
$48,930
APPLICATIONS WITHDRAWN
0
$0
5
$98,616
11
$77,089
0
$0
0
$0
FILES CLOSED FOR INCOMPLETENESS
0
$0
0
$0
1
$76,020
0
$0
0
$0
Aggregated Statistics For Year 1999 (Based on 1 partial tract)
A) FHA, FSA/RHS & VA Home Purchase Loans
B) Conventional Home Purchase Loans
C) Refinancings
D) Home Improvement Loans
F) Non-occupant Loans on < 5 Family Dwellings (A B C & D)
Detailed PMIC statistics for the following Tracts:4035.01
2002 - 2017 National Fire Incident Reporting System (NFIRS) incidents
Based on the data from the years 2002 - 2017 the average number of fires per year is 13. The highest number of fires - 26 took place in 2014, and the least - 2 in 2017. The data has a decreasing trend.
When looking into fire subcategories, the most reports belonged to: Structure Fires (46.9%), and Outside Fires (28.5%).
Fire incident types reported to NFIRS in Zip Code 62062

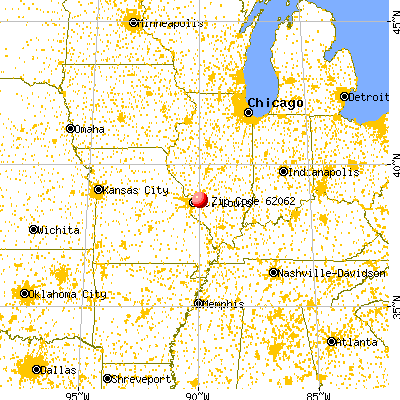


 Nearest zip codes: 62034, 62234, 62294, 62232, 62025, 62269.


 Based on the data from the years 2002 - 2017 the average number of fires per year is 13. The highest number of fires - 26 took place in 2014, and the least - 2 in 2017. The data has a decreasing trend.
 When looking into fire subcategories, the most reports belonged to: Structure Fires (46.9%), and Outside Fires (28.5%).