Estimated zip code population in 2022: 4,332 Zip code population in 2010: 4,347 Zip code population in 2000: 4,606
Houses and condos: 1,809 Renter-occupied apartments: 264
% of renters here:
15%
State:
33%
March 2022 cost of living index in zip code 61275: 84.6 (less than average, U.S. average is 100)
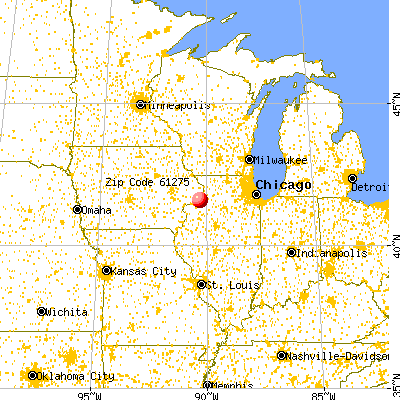
Land area: 33.6 sq. mi. Water area: 1.4 sq. mi.
Population density: 129 people per square mile
(very low).
OSM Map
General Map
Google Map
MSN Map
OSM Map
General Map
Google Map
MSN Map
OSM Map
General Map
Google Map
MSN Map
OSM Map
General Map
Google Map
MSN Map
Please wait while loading the map...
Real estate property taxes paid for housing units in 2022:
This zip code:
1.9% ($4,836)
Illinois:
2.0% ($4,912)
Median real estate property taxes paid for housing units with mortgages in 2022: $5,787 (2.1%) Median real estate property taxes paid for housing units with no mortgage in 2022: $3,157 (1.7%)
Business Search- 14 Million verified businesses
Males: 2,121
(49.0%)
Females: 2,211
(51.0%)
For population 25 years and over in 61275:
High school or higher: 95.9%
Bachelor's degree or higher: 33.2%
Graduate or professional degree: 11.8%
Unemployed: 4.1%
Mean travel time to work (commute): 22.4 minutes
For population 15 years and over in 61275:
Never married: 22.5%
Now married: 62.3%
Separated: 0.6%
Widowed: 7.2%
Divorced: 7.3%
Zip code 61275 compared to state average:
Black race population percentage significantly below state average.
Hispanic race population percentage below state average.
Median age above state average.
Foreign-born population percentage significantly below state average.
Renting percentage below state average.
Length of stay since moving in significantly above state average.
Estimated median house/condo value in 2022: $250,022
61275:
$250,022
Illinois:
$251,600
According to our research of Illinois and other state lists, there were 2 registered sex offenders living in 61275 zip code as of May 26, 2024. The ratio of all residents to sex offenders in zip code 61275 is 2,250 to 1. The ratio of registered sex offenders to all residents in this zip code is much lower than the state average.
Median resident age:
This zip code:
47.1 years
Illinois median age:
39.1 years
Average household size:
This zip code:
2.5 people
Illinois:
2.4 people
Averages for the 2020 tax year for zip code 61275, filed in 2021:
Average Adjusted Gross Income (AGI) in 2020: $87,600 (Individual Income Tax Returns)
Here:
$87,600
State:
$82,626
Salary/wage: $74,108 (reported on 80.3% of returns)
Here:
$74,108
State:
$66,640
(% of AGI for various income ranges: 1123.3% for AGIs below $25k, 2997.1% for AGIs $25k-50k, 5867.4% for AGIs $50k-75k, 6991.1% for AGIs $75k-100k, 14747.9% for AGIs $100k-200k, 72936.0% for AGIs over 200k)
Taxable interest for individuals: $1,344 (reported on 45.5% of returns)
This zip code:
$1,344
Illinois:
$2,376
(% of AGI for various income ranges: 18.9% for AGIs below $25k, 51.6% for AGIs $25k-50k, 67.4% for AGIs $50k-75k, 104.7% for AGIs $75k-100k, 167.6% for AGIs $100k-200k, 304.0% for AGIs over 200k)
Ordinary dividends: $4,686 (reported on 27.7% of returns)
Here:
$4,686
State:
$9,061
(% of AGI for various income ranges: 23.1% for AGIs below $25k, 57.1% for AGIs $25k-50k, 82.2% for AGIs $50k-75k, 255.8% for AGIs $75k-100k, 303.5% for AGIs $100k-200k, 1596.0% for AGIs over 200k)
Net capital gain/loss in AGI: +$8,365 (reported on 21.6% of returns)
Here:
+$8,365
State:
+$31,684
(% of AGI for various income ranges: 6.7% for AGIs below $25k, 22.9% for AGIs $25k-50k, 70.4% for AGIs $50k-75k, 178.4% for AGIs $75k-100k, 489.7% for AGIs $100k-200k, 3174.0% for AGIs over 200k)
Profit/loss from business: +$7,743 (reported on 10.8% of returns)
Here:
+$7,743
State:
+$12,175
(% of AGI for various income ranges: 90.0% for AGIs below $25k, 65.8% for AGIs $25k-50k, 54.3% for AGIs $50k-75k, 160.5% for AGIs $75k-100k, 192.9% for AGIs $100k-200k, 334.0% for AGIs over 200k)
Taxable individual retirement arrangement distribution: $18,707 (reported on 13.1% of returns)
61275:
$18,707
Illinois:
$21,613
(% of AGI for various income ranges: 54.2% for AGIs below $25k, 156.5% for AGIs $25k-50k, 227.0% for AGIs $50k-75k, 466.8% for AGIs $75k-100k, 926.2% for AGIs $100k-200k)
Total itemized deductions: $25,664 (reported on 6.6% of returns)
Here:
$25,664
State:
$34,948
(% of AGI for various income ranges: 357.0% for AGIs $50k-75k, 269.5% for AGIs $75k-100k, 374.1% for AGIs $100k-200k, 1976.0% for AGIs over 200k)
Charity contributions: $6,070 (reported on 4.7% of returns)
Here:
$6,070
State:
$13,122
(% of AGI for various income ranges: 49.1% for AGIs $50k-75k, 95.6% for AGIs $100k-200k, 338.0% for AGIs over 200k)
Taxes paid: $7,700 (reported on 6.6% of returns)
61275:
$7,700
State:
$8,563
(% of AGI for various income ranges: 102.2% for AGIs $50k-75k, 82.1% for AGIs $75k-100k, 122.4% for AGIs $100k-200k, 542.0% for AGIs over 200k)
Earned income credit: $1,953 (reported on 8.9% of returns)
Here:
$1,953
State:
$2,311
(% of AGI for various income ranges: 60.6% for AGIs below $25k, 49.4% for AGIs $25k-50k)
Percentage of individuals using paid preparers for their 2020 taxes: 95.3%
Here:
95%
State:
93%
(% for various income ranges: 92.0% for AGIs below $25k, 94.9% for AGIs $25k-50k, 96.8% for AGIs $50k-75k, 96.2% for AGIs $75k-100k, 96.4% for AGIs $100k-200k, 100.0% for AGIs over 200k)
Averages for the 2012 tax year for zip code 61275, filed in 2013:
Average Adjusted Gross Income (AGI) in 2012: $71,101 (Individual Income Tax Returns)
Here:
$71,101
State:
$68,058
Salary/wage: $60,516 (reported on 84.7% of returns)
Here:
$60,516
State:
$55,396
(% of AGI for various income ranges: 73.4% for AGIs below $25k, 71.0% for AGIs $25k-50k, 72.9% for AGIs $50k-75k, 69.7% for AGIs $75k-100k, 74.2% for AGIs $100k-200k, 69.1% for AGIs over 200k)
Taxable interest for individuals: $1,193 (reported on 51.0% of returns)
This zip code:
$1,193
Illinois:
$1,969
(% of AGI for various income ranges: 1.9% for AGIs below $25k, 1.4% for AGIs $25k-50k, 0.7% for AGIs $50k-75k, 0.9% for AGIs $75k-100k, 0.4% for AGIs $100k-200k, 1.2% for AGIs over 200k)
Ordinary dividends: $4,522 (reported on 29.2% of returns)
Here:
$4,522
State:
$7,786
(% of AGI for various income ranges: 1.4% for AGIs below $25k, 1.2% for AGIs $25k-50k, 0.8% for AGIs $50k-75k, 1.1% for AGIs $75k-100k, 1.0% for AGIs $100k-200k, 5.7% for AGIs over 200k)
Net capital gain/loss in AGI: +$4,244 (reported on 20.3% of returns)
Here:
+$4,244
State:
+$22,183
(% of AGI for various income ranges: 0.8% for AGIs $50k-75k, 1.5% for AGIs $75k-100k, 1.1% for AGIs $100k-200k, 2.8% for AGIs over 200k)
Profit/loss from business: +$8,904 (reported on 12.9% of returns)
Here:
+$8,904
State:
+$12,903
(% of AGI for various income ranges: 4.6% for AGIs below $25k, 2.7% for AGIs $25k-50k, 2.0% for AGIs $50k-75k, 1.8% for AGIs $75k-100k, 1.5% for AGIs $100k-200k)
Taxable individual retirement arrangement distribution: $13,262 (reported on 12.9% of returns)
61275:
$13,262
Illinois:
$17,929
(% of AGI for various income ranges: 3.1% for AGIs below $25k, 3.0% for AGIs $25k-50k, 2.6% for AGIs $50k-75k, 2.0% for AGIs $75k-100k, 3.4% for AGIs $100k-200k)
Total itemized deductions: $21,145 (18% of AGI, reported on 41.1% of returns)
Here:
$21,145
State:
$26,433
Here:
18.5% of AGI
State:
19.2% of AGI
(% of AGI for various income ranges: 12.1% for AGIs below $25k, 9.7% for AGIs $25k-50k, 11.5% for AGIs $50k-75k, 12.0% for AGIs $75k-100k, 13.7% for AGIs $100k-200k, 11.2% for AGIs over 200k)
Charity contributions: $3,259 (reported on 31.2% of returns)
Here:
$3,259
State:
$4,525
(% of AGI for various income ranges: 0.8% for AGIs $25k-50k, 1.1% for AGIs $50k-75k, 1.1% for AGIs $75k-100k, 1.8% for AGIs $100k-200k, 1.8% for AGIs over 200k)
Taxes paid: $9,634 (reported on 40.6% of returns)
61275:
$9,634
State:
$11,968
(% of AGI for various income ranges: 2.1% for AGIs below $25k, 3.1% for AGIs $25k-50k, 4.5% for AGIs $50k-75k, 4.9% for AGIs $75k-100k, 6.7% for AGIs $100k-200k, 6.2% for AGIs over 200k)
Earned income credit: $2,123 (reported on 10.9% of returns)
Here:
$2,123
State:
$2,349
(% of AGI for various income ranges: 5.3% for AGIs below $25k, 0.9% for AGIs $25k-50k)
Percentage of individuals using paid preparers for their 2012 taxes: 61.4%
Here:
61%
State:
57%
(% for various income ranges: 50.9% for AGIs below $25k, 60.5% for AGIs $25k-50k, 63.3% for AGIs $50k-75k, 69.2% for AGIs $75k-100k, 65.1% for AGIs $100k-200k, 87.5% for AGIs over 200k)
Averages for the 2004 tax year for zip code 61275, filed in 2005:
Average Adjusted Gross Income (AGI) in 2004: $50,758 (Individual Income Tax Returns)
Here:
$50,758
State:
$54,625
Salary/wage: $46,982 (reported on 86.1% of returns)
Here:
$46,982
State:
$46,811
(% of AGI for various income ranges: 106.1% for AGIs below $10k, 72.2% for AGIs $10k-25k, 74.6% for AGIs $25k-50k, 79.0% for AGIs $50k-75k, 81.1% for AGIs $75k-100k, 81.8% for AGIs over 100k)
Taxable interest for individuals: $1,300 (reported on 56.4% of returns)
This zip code:
$1,300
Illinois:
$2,101
(% of AGI for various income ranges: 5.8% for AGIs below $10k, 3.1% for AGIs $10k-25k, 1.7% for AGIs $25k-50k, 1.5% for AGIs $50k-75k, 1.2% for AGIs $75k-100k, 1.0% for AGIs over 100k)
Taxable dividends: $1,745 (reported on 30.6% of returns)
Here:
$1,745
State:
$4,306
(% of AGI for various income ranges: 3.4% for AGIs below $10k, 1.3% for AGIs $10k-25k, 0.9% for AGIs $25k-50k, 0.7% for AGIs $50k-75k, 1.0% for AGIs $75k-100k, 1.2% for AGIs over 100k)
Net capital gain/loss: +$2,801 (reported on 21.6% of returns)
Here:
+$2,801
State:
+$17,321
(% of AGI for various income ranges: 1.9% for AGIs below $10k, -0.5% for AGIs $10k-25k, -0.1% for AGIs $25k-50k, 0.4% for AGIs $50k-75k, 0.4% for AGIs $75k-100k, 2.8% for AGIs over 100k)
Profit/loss from business: +$7,512 (reported on 13.7% of returns)
Here:
+$7,512
State:
+$11,771
(% of AGI for various income ranges: 6.7% for AGIs below $10k, 2.0% for AGIs $10k-25k, 3.1% for AGIs $25k-50k, 1.9% for AGIs $50k-75k, 0.9% for AGIs $75k-100k, 2.2% for AGIs over 100k)
IRA payment deduction: $3,333 (reported on 1.5% of returns)
61275:
$3,333
Illinois:
$3,087
Total itemized deductions: $16,780 (19% of AGI, reported on 33.1% of returns)
Here:
$16,780
State:
$20,239
Here:
18.6% of AGI
State:
19.5% of AGI
(% of AGI for various income ranges: 8.6% for AGIs $10k-25k, 10.3% for AGIs $25k-50k, 9.8% for AGIs $50k-75k, 11.4% for AGIs $75k-100k, 12.3% for AGIs over 100k)
Charity contributions deductions: $2,870 (3% of AGI, reported on 28.5% of returns)
Here:
$2,870
State:
$3,719
Here:
3.0% of AGI
State:
3.4% of AGI
(% of AGI for various income ranges: 1.0% for AGIs $10k-25k, 1.1% for AGIs $25k-50k, 1.2% for AGIs $50k-75k, 1.5% for AGIs $75k-100k, 2.2% for AGIs over 100k)
Total tax: $7,655 (reported on 77.5% of returns)
61275:
$7,655
State:
$9,882
(% of AGI for various income ranges: 4.5% for AGIs below $10k, 4.0% for AGIs $10k-25k, 7.1% for AGIs $25k-50k, 8.8% for AGIs $50k-75k, 11.0% for AGIs $75k-100k, 17.0% for AGIs over 100k)
Earned income credit: $1,650 (reported on 8.6% of returns)
Here:
$1,650
State:
$1,788
Percentage of individuals using paid preparers for their 2004 taxes: 57.8%
Here:
58%
State:
61%
(% for various income ranges: 47.3% for AGIs below $10k, 54.8% for AGIs $10k-25k, 57.4% for AGIs $25k-50k, 66.5% for AGIs $50k-75k, 64.3% for AGIs $75k-100k, 62.7% for AGIs over 100k)
Household received Food Stamps/SNAP in the past 12 months: 159 Household did not receive Food Stamps/SNAP in the past 12 months: 1,585
Women who had a birth in the past 12 months: 25 (15 now married, 9 unmarried) Women who did not have a birth in the past 12 months: 913 (389 now married, 523 unmarried)
Housing units in zip code 61275 with a mortgage: 1,002 (57 second mortgage, 41 both second mortgage and home equity loan) Houses without a mortgage: 45
Median monthly owner costs for units with a mortgage: $1,759 Median monthly owner costs for units without a mortgage: $687
Residents with income below the poverty level in 2022:
This zip code:
6.5%
Whole state:
11.9%
Residents with income below 50% of the poverty level in 2022:
This zip code:
4.3%
Whole state:
5.7%
Median number of rooms in houses and condos:
Here:
7.0
State:
6.4
Median number of rooms in apartments:
Here:
4.6
State:
4.1
Notable locations in this zip code not listed on our city pages
Notable locations in zip code 61275: YWCA Girls Camp (A), Camp Hauberg (B), Port Byron Volunteer Fire Department (C). Display/hide their locations on the map
Churches in zip code 61275 include: Bethel Church (A), Fairfield Church (B), Peace Church (C), Church of the Cross (D), First United Methodist Church (E), Rapids City Christian Church (F), Congregational Church (G), Messiah Lutheran Church (H). Display/hide their locations on the map
Cemeteries: Yost Cemetery (1), Fairfield Cemetery (2), Frieden's Cemetery (3), Port Byron Cemetery (4), Mount Pleasant Cemetery (5), Schaefer Family Cemetery (6), Oak Grove Cemetery (7). Display/hide their locations on the map
Size of family households: 665 2-persons, 238 3-persons, 297 4-persons, 72 5-persons, 19 6-persons, 1 7-or-more-persons
Size of nonfamily households: 336 1-person, 109 2-persons, 13 3-persons
682 married couples with children.
142 single-parent households (41 men, 101 women).
96.7% of residents of 61275 zip code speak English at home.
1.9% of residents speak Spanish at home (64% very well, 28% well, 8% not well).
1.1% of residents speak other Indo-European language at home (70% very well, 19% well, 5% not well, 7% not at all).
Foreign born population: 81 (1.9%) (86.5% of them are naturalized citizens)
This zip code:
1.9%
Whole state:
14.4%
42%Honduras
26%France
11%North Macedonia (Macedonia)
10%Austria
5%Bosnia and Herzegovina
37%German
9%Irish
8%English
5%American
5%European
3%Belgian
3%Italian
Year of entry for the foreign-born population
42010 or later
32000 to 2009
61990 to 1999
66Before 1990
Facilities with environmental interests located in this zip code:
SANDSTROM PRODUCTS CO (224 S. MAIN in PORT BYRON, IL)
STATE MASTER (Illinois EPA Project) - SOLID WASTE PROGRAM, HAZARDOUS WASTE PROGRAM, AIR PROGRAM AIR SYNTHETIC MINOR (AIRS/AFS) CRITERIA AND HAZARDOUS AIR POLLUTANT INVENTORY (Inventory of air pollution sources) HAZARDOUS WASTE BIENNIAL REPORTER (Resource Conservation and Recovery Act (tracking hazardous waste)) Large Quantity Generators, more that 1000 kg of hazardous waste/month (Resource Conservation and Recovery Act (tracking hazardous waste)) - notification TRI REPORTER (Tracking of toxic chemicals releasing facilities) Business SIC classification: PAINTS, VARNISHES, LACQUERS, ENAMELS, AND ALLIED PRODUCTS Business NAICS classification: PAINT AND COATING MANUFACTURING.
PHOENIX CORPORATION OF THE QUAD CITIES (23821-66TH AVE N in PORT BYRON, IL)
STATE MASTER (Illinois EPA Project) - AIR PROGRAM AIR MINOR (AIRS/AFS) National Pollutant Discharge Elimination System NON-MAJOR (Tracking pollutant discharge elimination systems) - permit Business SIC classification: NONCLASSIFIABLE ESTABLISHMENTS Organizations: PHOENIX CORP/QUAD CITIES (CONTACT/OWNER)
Alternative names: PHOENIX CORP-QUAD CITIES
PORT BYRON ( in PORT BYRON, IL)
National Pollutant Discharge Elimination System NON-MAJOR (Tracking pollutant discharge elimination systems) - permit COMMUNITY WATER SYSTEM (SDWIS) - SDWIS-IL1610550 17077, WATER TREATMENT PLANT Business SIC classification: SEWERAGE SYSTEMS Alternative names: PORT BYRON STP
RIVERDALE SCHOOL DIST 100 (9624 256TH STREET NORTH in PORT BYRON, IL)
STATE MASTER (Illinois EPA Project) - SOLID WASTE PROGRAM, National Pollutant Discharge Elimination System Permit National Pollutant Discharge Elimination System NON-MAJOR (Tracking pollutant discharge elimination systems) - permit Business SIC classification: ELEMENTARY AND SECONDARY SCHOOLS Alternative names: RIVERDALE COMM SCHOOL DIST#100, RIVERDALE SR. HIGH SCHOOL
RIVERDALE ELEM SCHOOL (9424 256TH ST N in PORT BYRON, IL)
(National Center for Education Statistics) - STATE ID-4908110002007 Organizations: RIVERDALE C U SCHOOL DIST 100 (SCHOOL DISTRICT)
RIVERDALE MIDDLE SCHOOL (9822 256TH ST N in PORT BYRON, IL)
(National Center for Education Statistics) - STATE ID-4908110001002 Organizations: RIVERDALE C U SCHOOL DIST 100 (SCHOOL DISTRICT)
RIVERDALE SR HIGH SCHOOL (9622-256TH ST N in PORT BYRON, IL)
(National Center for Education Statistics) - STATE ID-4908110000001 Organizations: RIVERDALE C U SCHOOL DIST 100 (SCHOOL DISTRICT)
PORT BYRON STP, VILLAGE OF (1500 BLOCK E. OF NORTH HIGH ST in PORT BYRON, IL)
National Pollutant Discharge Elimination System NON-MAJOR (Tracking pollutant discharge elimination systems) - permit Business SIC classification: SEWERAGE SYSTEMS
Housing units lacking complete plumbing facilities: 2.2% Housing units lacking complete kitchen facilities: 2.2%
78.5%Utility gas
13.7%Electricity
7.1%Bottled, tank, or LP gas
0.8%No fuel used
Population in 1990: 3,441. Population change in the 1990s: +1,165 (+33.9%).
Place of birth for U.S.-born residents:
This state: 2,562
Northeast: 55
Midwest: 1,119
South: 300
West: 213
66% of the 61275 zip code residents lived in the same house 5 years ago. Out of people who lived in different houses, 59% lived in this county. Out of people who lived in different counties, 50% lived in Illinois.
93% of the 61275 zip code residents lived in the same house 1 year ago. Out of people who lived in different houses, 49% moved from this county. Out of people who lived in different houses, 3% moved from different county within same state. Out of people who lived in different houses, 51% moved from different state.
Private vs. public school enrollment:
Students in private schools in grades 1 to 8 (elementary and middle school): 33
Here:
7.8%
Illinois:
13.3%
Students in private schools in grades 9 to 12 (high school): 15
Here:
5.0%
Illinois:
9.9%
Students in private undergraduate colleges: 15
Here:
18.3%
Illinois:
27.4%
Occupation by median earnings in the past 12 months ($)
135,865Architecture and engineering occupations
98,748Construction and extraction occupations
83,908Health diagnosing and treating practitioners and other technical occupations
80,182Management occupations
76,557Installation, maintenance, and repair occupations
72,757Computer and mathematical occupations
Companies with federal contracts located in this zip code:
PHOENIX CORPORATION OF THE QUA (23821 66TH AVE NORTH in PORT BYRON, IL; small business) : $365,597 in 10 contractsfrom 2001 to 2004
Contracts for Maintenance, Repair or Alteration of Real Property -- Restoration of real property, Construction of Structures and Facilities -- Other Conservation and Development Facilities by U.S. Army Corps of Engineers - civil program financing only, Army Signed by year:2000: $0; 2001: $60,456; 2002: $105,292; 2003: $199,381; 2004: $468; 2005: $0; 2006: $0.
Biggest contracts:
$110,782 with U.S. Army Corps of Engineers - civil program financing only for Maintenance, Repair or Alteration of Real Property -- Restoration of real property. Taking place in IA. Signed on 2002-02-08. Completion date: 2002-01-08.
$81,012 with U.S. Army Corps of Engineers - civil program financing only for Construction of Structures and Facilities -- Other Conservation and Development Facilities. Signed on 2003-11-17. Completion date: 2003-12-08.
$81,012 with Army for Construction of Structures and Facilities -- Other Conservation and Development Facilities. Signed on 2003-11-17. Completion date: 2003-12-08.
$60,456 with U.S. Army Corps of Engineers - civil program financing only for Maintenance, Repair or Alteration of Real Property -- Restoration of real property. Taking place in IA. Signed on 2001-11-06. Completion date: 2001-12-20.
BROMAN, G R CO (2308 WOODHAVEN LN in PORT BYRON, IL; small business) : $68,129 in 2 contractsfrom 2000 to 2005
$78,020 with Army for Technical Assistance. Signed on 2000-05-04. Completion date: 2001-06-14.
-$9,891 with Army for Food Items For Resale. Signed on 2005-09-08. Completion date: 1999-06-14.
Top industries in this zip code by the number of employees in 2005:
Construction: Highway, Street, and Bridge Construction (20-49 employees: 1 establishment, 1-4 employees: 1 establishment)
Finance and Insurance: Commercial Banking (20-49: 1)
Other Services (except Public Administration): Religious Organizations (5-9: 2, 1-4: 2)
Administrative and Support and Waste Management and Remediation Services: Other Business Service Centers (including Copy Shops) (10-19: 1)
Detailed PMIC statistics for the following Tracts:0201.00
2002 - 2018 National Fire Incident Reporting System (NFIRS) incidents
Based on the data from the years 2002 - 2018 the average number of fires per year is 19. The highest number of reported fire incidents - 31 took place in 2002, and the least - 6 in 2010. The data has a dropping trend.
When looking into fire subcategories, the most incidents belonged to: Outside Fires (42.3%), and Structure Fires (33.8%).
Fire incident types reported to NFIRS in Zip Code 61275


 Nearest zip codes: 61278, 52753, 61257, 61242, 61236, 61256.


 Based on the data from the years 2002 - 2018 the average number of fires per year is 19. The highest number of reported fire incidents - 31 took place in 2002, and the least - 6 in 2010. The data has a dropping trend.
 When looking into fire subcategories, the most incidents belonged to: Outside Fires (42.3%), and Structure Fires (33.8%).