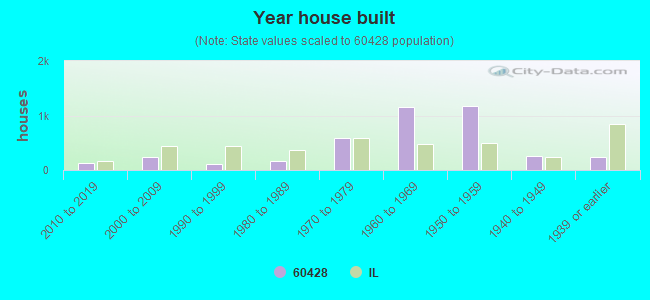
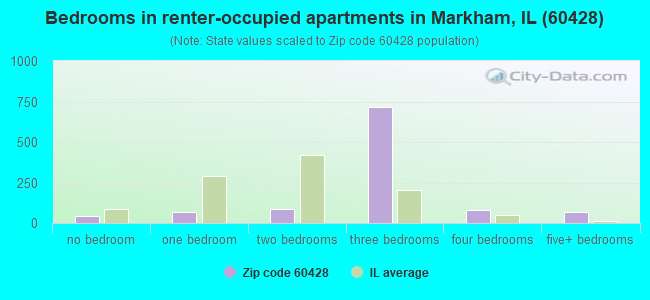
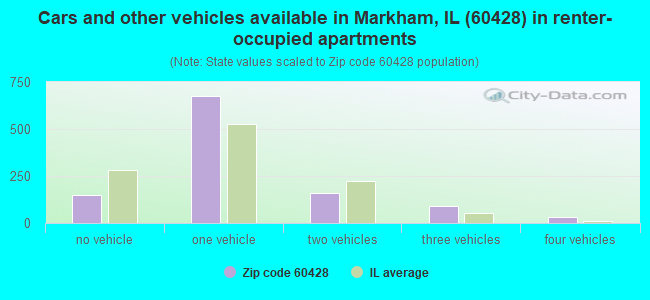
Houses and condos: 4,072 Renter-occupied apartments: 1,101
% of renters here:
30%
State:
33%
March 2022 cost of living index in zip code 60428: 94.9 (less than average, U.S. average is 100)
Land area: 5.2 sq. mi. Water area: 0.0 sq. mi.
Population density: 2,118 people per square mile
(low).
OSM Map
Google Map
MSN Map
OSM Map
General Map
Google Map
MSN Map
OSM Map
Google Map
MSN Map
OSM Map
Google Map
MSN Map
Please wait while loading the map...
Real estate property taxes paid for housing units in 2022:
This zip code:
3.3% ($3,506)
Illinois:
2.0% ($4,912)
Median real estate property taxes paid for housing units with mortgages in 2022: $3,510 (2.9%) Median real estate property taxes paid for housing units with no mortgage in 2022: $3,422 (3.7%)
Business Search- 14 Million verified businesses
Males: 5,260
(47.8%)
Females: 5,741
(52.2%)
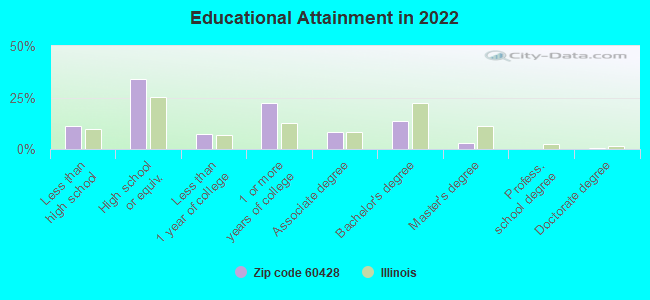
For population 25 years and over in 60428:
High school or higher: 87.9%
Bachelor's degree or higher: 16.8%
Graduate or professional degree: 3.4%
Unemployed: 11.8%
Mean travel time to work (commute): 33.7 minutes
For population 15 years and over in 60428:
Never married: 50.0%
Now married: 29.0%
Separated: 2.4%
Widowed: 6.4%
Divorced: 12.3%
Zip code 60428 compared to state average:
Median household income below state average.
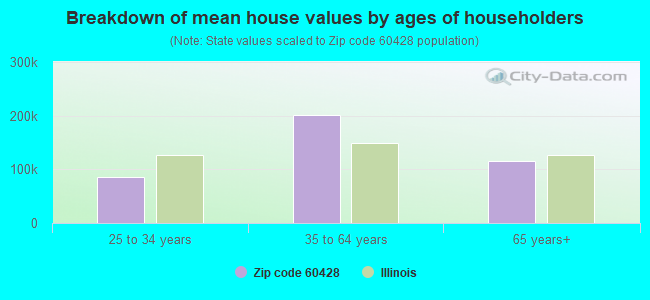
Median house value significantly below state average.
Unemployed percentage above state average.
Black race population percentage significantly above state average.
Median age below state average.
Foreign-born population percentage significantly below state average.
Length of stay since moving in significantly above state average.
Percentage of population with a bachelor's degree or higher significantly below state average.
Averages for the 2020 tax year for zip code 60428, filed in 2021:
Average Adjusted Gross Income (AGI) in 2020: $35,626 (Individual Income Tax Returns)
Here:
$35,626
State:
$82,626
Salary/wage: $33,408 (reported on 81.1% of returns)
Here:
$33,408
State:
$66,640
(% of AGI for various income ranges: 1112.9% for AGIs below $25k, 3288.8% for AGIs $25k-50k, 6304.7% for AGIs $50k-75k, 9051.4% for AGIs $75k-100k, 17586.9% for AGIs $100k-200k)
Taxable interest for individuals: $478 (reported on 9.4% of returns)
This zip code:
$478
Illinois:
$2,376
(% of AGI for various income ranges: 2.2% for AGIs below $25k, 4.4% for AGIs $25k-50k, 14.1% for AGIs $50k-75k, 15.5% for AGIs $75k-100k, 20.0% for AGIs $100k-200k)
Ordinary dividends: $2,000 (reported on 3.8% of returns)
Here:
$2,000
State:
$9,061
(% of AGI for various income ranges: 1.8% for AGIs below $25k, 1.5% for AGIs $25k-50k, 23.1% for AGIs $50k-75k, 30.9% for AGIs $75k-100k, 120.8% for AGIs $100k-200k)
Net capital gain/loss in AGI: +$1,969 (reported on 3.0% of returns)
Here:
+$1,969
State:
+$31,684
(% of AGI for various income ranges: 0.4% for AGIs below $25k, 5.9% for AGIs $25k-50k, 10.0% for AGIs $50k-75k, 5.9% for AGIs $75k-100k, 122.3% for AGIs $100k-200k)
Profit/loss from business: +$1,496 (reported on 19.5% of returns)
Here:
+$1,496
State:
+$12,175
(% of AGI for various income ranges: 69.6% for AGIs below $25k, 40.8% for AGIs $50k-75k, 14.5% for AGIs $75k-100k, 118.5% for AGIs $100k-200k)
Taxable individual retirement arrangement distribution: $10,005 (reported on 3.6% of returns)
60428:
$10,005
Illinois:
$21,613
(% of AGI for various income ranges: 20.9% for AGIs below $25k, 17.8% for AGIs $25k-50k, 88.4% for AGIs $50k-75k, 354.5% for AGIs $75k-100k)
Total itemized deductions: $24,947 (reported on 6.4% of returns)
Here:
$24,947
State:
$34,948
(% of AGI for various income ranges: 177.4% for AGIs $25k-50k, 481.0% for AGIs $50k-75k, 792.7% for AGIs $75k-100k, 1331.5% for AGIs $100k-200k)
Charity contributions: $9,143 (reported on 5.3% of returns)
Here:
$9,143
State:
$13,122
(% of AGI for various income ranges: 39.9% for AGIs $25k-50k, 132.0% for AGIs $50k-75k, 284.1% for AGIs $75k-100k, 529.2% for AGIs $100k-200k)
Taxes paid: $6,765 (reported on 6.4% of returns)
60428:
$6,765
State:
$8,563
(% of AGI for various income ranges: 40.3% for AGIs $25k-50k, 139.8% for AGIs $50k-75k, 231.4% for AGIs $75k-100k, 383.1% for AGIs $100k-200k)
Earned income credit: $2,861 (reported on 33.4% of returns)
Here:
$2,861
State:
$2,311
(% of AGI for various income ranges: 177.8% for AGIs below $25k, 109.2% for AGIs $25k-50k)
Percentage of individuals using paid preparers for their 2020 taxes: 91.4%
Here:
91%
State:
93%
(% for various income ranges: 92.0% for AGIs below $25k, 91.3% for AGIs $25k-50k, 91.2% for AGIs $50k-75k, 87.5% for AGIs $75k-100k, 91.3% for AGIs $100k-200k)
Averages for the 2012 tax year for zip code 60428, filed in 2013:
Average Adjusted Gross Income (AGI) in 2012: $32,260 (Individual Income Tax Returns)
Here:
$32,260
State:
$68,058
Salary/wage: $30,710 (reported on 82.5% of returns)
Here:
$30,710
State:
$55,396
(% of AGI for various income ranges: 72.2% for AGIs below $25k, 79.7% for AGIs $25k-50k, 81.9% for AGIs $50k-75k, 78.3% for AGIs $75k-100k, 80.5% for AGIs $100k-200k)
Taxable interest for individuals: $421 (reported on 12.8% of returns)
This zip code:
$421
Illinois:
$1,969
(% of AGI for various income ranges: 0.2% for AGIs below $25k, 0.1% for AGIs $25k-50k, 0.1% for AGIs $50k-75k, 0.3% for AGIs $100k-200k)
Ordinary dividends: $658 (reported on 4.5% of returns)
Here:
$658
State:
$7,786
(% of AGI for various income ranges: 0.1% for AGIs $75k-100k, 0.1% for AGIs $100k-200k)
Profit/loss from business: +$4,267 (reported on 18.1% of returns)
Here:
+$4,267
State:
+$12,903
(% of AGI for various income ranges: 11.3% for AGIs below $25k, 0.1% for AGIs $25k-50k)
Taxable individual retirement arrangement distribution: $11,468 (reported on 4.1% of returns)
60428:
$11,468
Illinois:
$17,929
(% of AGI for various income ranges: 1.2% for AGIs below $25k, 1.2% for AGIs $25k-50k, 1.2% for AGIs $50k-75k, 4.4% for AGIs $75k-100k)
Total itemized deductions: $18,229 (32% of AGI, reported on 26.4% of returns)
Here:
$18,229
State:
$26,433
Here:
32.0% of AGI
State:
19.2% of AGI
(% of AGI for various income ranges: 7.6% for AGIs below $25k, 13.8% for AGIs $25k-50k, 18.1% for AGIs $50k-75k, 19.1% for AGIs $75k-100k, 19.5% for AGIs $100k-200k)
Charity contributions: $4,189 (reported on 21.7% of returns)
Here:
$4,189
State:
$4,525
(% of AGI for various income ranges: 0.9% for AGIs below $25k, 2.5% for AGIs $25k-50k, 3.5% for AGIs $50k-75k, 4.2% for AGIs $75k-100k, 4.1% for AGIs $100k-200k)
Taxes paid: $6,178 (reported on 26.0% of returns)
60428:
$6,178
State:
$11,968
(% of AGI for various income ranges: 2.0% for AGIs below $25k, 4.2% for AGIs $25k-50k, 6.3% for AGIs $50k-75k, 6.9% for AGIs $75k-100k, 7.5% for AGIs $100k-200k)
Earned income credit: $2,792 (reported on 37.3% of returns)
Here:
$2,792
State:
$2,349
(% of AGI for various income ranges: 13.2% for AGIs below $25k, 1.5% for AGIs $25k-50k)
Percentage of individuals using paid preparers for their 2012 taxes: 51.0%
Here:
51%
State:
57%
(% for various income ranges: 47.0% for AGIs below $25k, 53.8% for AGIs $25k-50k, 54.0% for AGIs $50k-75k, 65.4% for AGIs $75k-100k, 61.1% for AGIs $100k-200k)
Averages for the 2004 tax year for zip code 60428, filed in 2005:
Average Adjusted Gross Income (AGI) in 2004: $28,205 (Individual Income Tax Returns)
Here:
$28,205
State:
$54,625
Salary/wage: $27,240 (reported on 89.7% of returns)
Here:
$27,240
State:
$46,811
(% of AGI for various income ranges: 91.2% for AGIs below $10k, 82.0% for AGIs $10k-25k, 89.1% for AGIs $25k-50k, 88.3% for AGIs $50k-75k, 84.0% for AGIs $75k-100k, 80.7% for AGIs over 100k)
Taxable interest for individuals: $507 (reported on 17.4% of returns)
This zip code:
$507
Illinois:
$2,101
(% of AGI for various income ranges: 0.9% for AGIs below $10k, 0.2% for AGIs $10k-25k, 0.5% for AGIs $25k-50k, 0.1% for AGIs $50k-75k, 0.2% for AGIs $75k-100k, 0.1% for AGIs over 100k)
Taxable dividends: $425 (reported on 5.1% of returns)
Here:
$425
State:
$4,306
(% of AGI for various income ranges: 0.4% for AGIs below $10k, 0.1% for AGIs $10k-25k, 0.0% for AGIs $25k-50k, 0.0% for AGIs $50k-75k, 0.1% for AGIs $75k-100k, 0.3% for AGIs over 100k)
Net capital gain/loss: +$372 (reported on 3.2% of returns)
Here:
+$372
State:
+$17,321
(% of AGI for various income ranges: -0.3% for AGIs below $10k, -0.1% for AGIs $10k-25k, 0.1% for AGIs $25k-50k, 0.0% for AGIs $50k-75k, 0.2% for AGIs $75k-100k, 0.3% for AGIs over 100k)
Profit/loss from business: +$3,226 (reported on 12.1% of returns)
Here:
+$3,226
State:
+$11,771
(% of AGI for various income ranges: 12.9% for AGIs below $10k, 4.7% for AGIs $10k-25k, -0.4% for AGIs $25k-50k, 0.3% for AGIs $50k-75k, 0.6% for AGIs $75k-100k)
IRA payment deduction: $1,469 (reported on 0.8% of returns)
60428:
$1,469
Illinois:
$3,087
Total itemized deductions: $15,233 (33% of AGI, reported on 30.4% of returns)
Here:
$15,233
State:
$20,239
Here:
32.6% of AGI
State:
19.5% of AGI
(% of AGI for various income ranges: 7.3% for AGIs below $10k, 9.4% for AGIs $10k-25k, 18.2% for AGIs $25k-50k, 19.6% for AGIs $50k-75k, 19.9% for AGIs $75k-100k, 15.2% for AGIs over 100k)
Charity contributions deductions: $3,631 (8% of AGI, reported on 27.2% of returns)
Here:
$3,631
State:
$3,719
Here:
7.6% of AGI
State:
3.4% of AGI
(% of AGI for various income ranges: 0.6% for AGIs below $10k, 1.6% for AGIs $10k-25k, 3.8% for AGIs $25k-50k, 4.1% for AGIs $50k-75k, 5.6% for AGIs $75k-100k, 3.9% for AGIs over 100k)
Total tax: $2,956 (reported on 58.5% of returns)
60428:
$2,956
State:
$9,882
(% of AGI for various income ranges: 2.5% for AGIs below $10k, 2.5% for AGIs $10k-25k, 4.8% for AGIs $25k-50k, 7.9% for AGIs $50k-75k, 10.2% for AGIs $75k-100k, 14.1% for AGIs over 100k)
Earned income credit: $2,061 (reported on 39.2% of returns)
Here:
$2,061
State:
$1,788
Percentage of individuals using paid preparers for their 2004 taxes: 64.8%
Here:
65%
State:
61%
(% for various income ranges: 58.5% for AGIs below $10k, 68.6% for AGIs $10k-25k, 64.9% for AGIs $25k-50k, 63.1% for AGIs $50k-75k, 70.4% for AGIs $75k-100k, 78.6% for AGIs over 100k)
Likely homosexual households (counted as self-reported same-sex unmarried-partner households)
Lesbian couples: 0.0% of all households
Gay men: 0.2% of all households
Household received Food Stamps/SNAP in the past 12 months: 1,102 Household did not receive Food Stamps/SNAP in the past 12 months: 2,643
Women who had a birth in the past 12 months: 260 (56 now married, 204 unmarried) Women who did not have a birth in the past 12 months: 2,443 (342 now married, 2,123 unmarried)
Housing units in zip code 60428 with a mortgage: 1,308 (131 second mortgage, 93 both second mortgage and home equity loan) Houses without a mortgage: 60
Median monthly owner costs for units with a mortgage: $1,438 Median monthly owner costs for units without a mortgage: $609
Residents with income below the poverty level in 2022:
This zip code:
24.3%
Whole state:
11.9%
Residents with income below 50% of the poverty level in 2022:
This zip code:
10.1%
Whole state:
5.7%
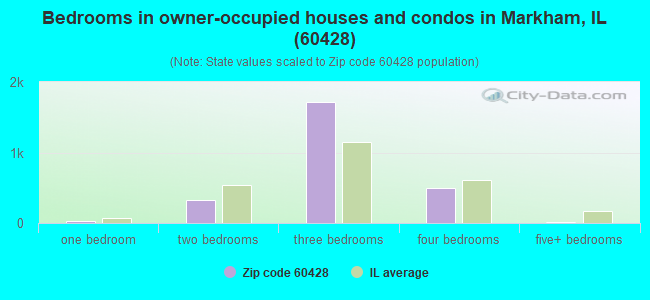
Median number of rooms in houses and condos:
Here:
6.3
State:
6.4
Median number of rooms in apartments:
Here:
5.2
State:
4.1
Notable locations in this zip code not listed on our city pages
Notable locations in zip code 60428: Cook County Courthouse (A), Markham Public Library (B), Markham Fire Department Station 2 (C), Markham Fire Department Station 3 (D), Markham Fire Department Station 1 (E). Display/hide their locations on the map
Churches in zip code 60428 include: All Nation Church of God (A), Christ Bible Center (B), Community Mennonite Church (C), Saint Gerard Catholic Church (D), Victory Temple Church of God (E), Household of Faith Christian Church (F), Markham Islamic Center (G), Markham Lutheran Church (H), Kings Baptist Church (I). Display/hide their locations on the map
Parks in zip code 60428 include: Markham Boys League Baseball Fields (1), Donnelly Park (2), Martin Luther King Park (3), Dresser Park (4), Lone Pine Park (5), McNeil Park (6), Roesner Park (7), Markham Park (8), Country Aire Park (9). Display/hide their locations on the map
In group quarters: 33 (-1 institutionalized population)
Size of family households: 859 2-persons, 667 3-persons, 493 4-persons, 193 5-persons, 136 6-persons, 171 7-or-more-persons
Size of nonfamily households: 973 1-person, 107 2-persons, 57 3-persons
618 married couples with children.
1,533 single-parent households (193 men, 1,340 women).
90.0% of residents of 60428 zip code speak English at home.
8.9% of residents speak Spanish at home (79% very well, 10% well, 10% not well, 1% not at all).
0.2% of residents speak other Indo-European language at home (19% very well, 81% well).
0.2% of residents speak Asian or Pacific Island language at home (53% very well, 47% well).
0.1% of residents speak other language at home (100% very well).
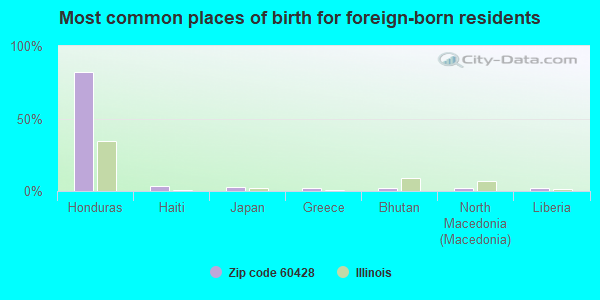
Foreign born population: 543 (4.9%) (43.0% of them are naturalized citizens)
This zip code:
4.9%
Whole state:
14.4%
82%Honduras
3%Haiti
3%Japan
2%Greece
2%Bhutan
2%North Macedonia (Macedonia)
2%Liberia
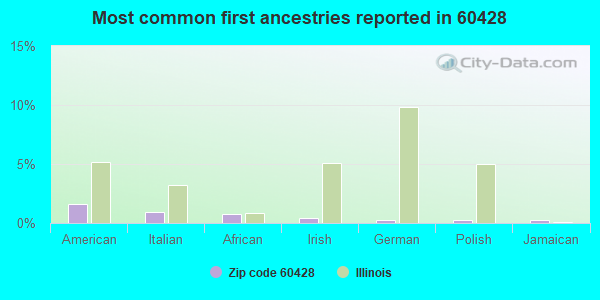
2%American
1%Italian
1%African
0%Irish
0%German
0%Polish
0%Jamaican
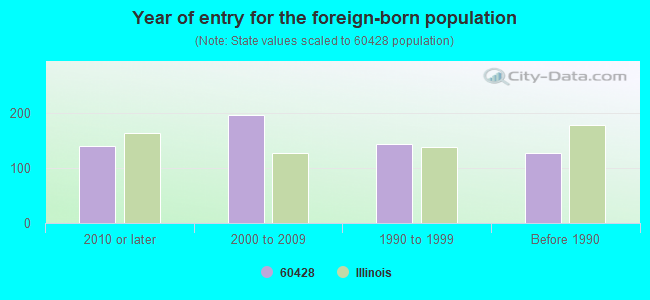
Year of entry for the foreign-born population
1402010 or later
1972000 to 2009
1451990 to 1999
128Before 1990
Housing units lacking complete plumbing facilities: 4.9% Housing units lacking complete kitchen facilities: 4.0%
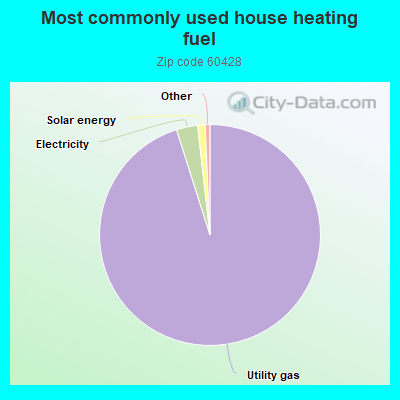
95.3%Utility gas
3.1%Electricity
1.1%Solar energy
Place of birth for U.S.-born residents:
This state: 8,956
Northeast: 94
Midwest: 479
South: 711
West: 83
94% of the 60428 zip code residents lived in the same house 1 year ago. Out of people who lived in different houses, 93% moved from this county. Out of people who lived in different houses, 1% moved from different state.
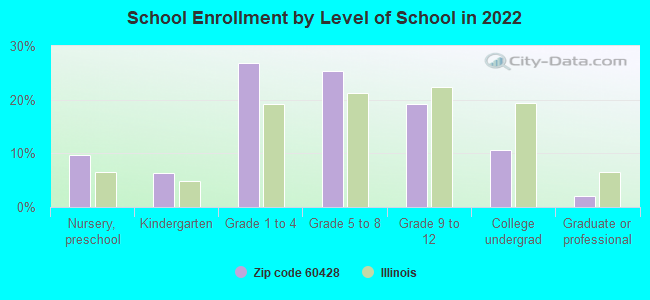
Private vs. public school enrollment:
Students in private schools in grades 1 to 8 (elementary and middle school): 166
Here:
11.1%
Illinois:
13.3%
Students in private schools in grades 9 to 12 (high school):
Here:
0.0%
Illinois:
9.9%
Students in private undergraduate colleges: 141
Here:
45.8%
Illinois:
27.4%
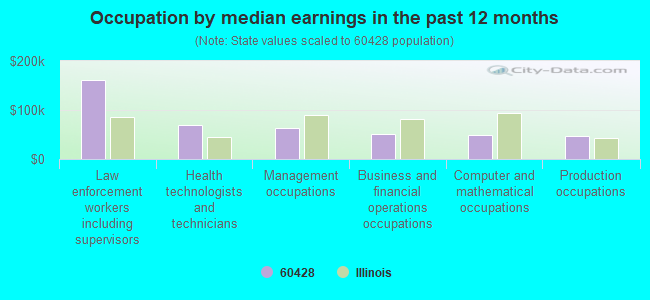
Occupation by median earnings in the past 12 months ($)
161,385Law enforcement workers including supervisors
68,998Health technologists and technicians
62,330Management occupations
50,998Business and financial operations occupations
49,470Computer and mathematical occupations
46,224Production occupations
Top industries in this zip code by the number of employees in 2005:
Other Services (except Public Administration): Religious Organizations (5-9: 3, 1-4: 1)
Administrative and Support and Waste Management and Remediation Services: Travel Agencies (10-19: 1)
Real Estate and Rental and Leasing: Residential Property Managers (10-19: 1)
Other Services (except Public Administration): General Automotive Repair (5-9: 1, 1-4: 2)
Administrative and Support and Waste Management and Remediation Services: Janitorial Services (5-9: 1)
Educational Services: Elementary and Secondary Schools (5-9: 1)
Fatal accident statistics in 2014:
Fatal accident count: 4
Vehicles involved in fatal accidents: 5
Fatal accidents caused by drunken drivers: 1
Fatalities: 4
Persons involved in fatal accidents: 5
Pedestrians involved in fatal accidents: 1
Fatal accident statistics in 2012:
Fatal accident count: 2
Vehicles involved in fatal accidents: 2
Fatal accidents caused by drunken drivers: 0
Fatalities: 2
Persons involved in fatal accidents: 2
Pedestrians involved in fatal accidents: 1
2004 - 2018 National Fire Incident Reporting System (NFIRS) incidents
Based on the data from the years 2004 - 2018 the average number of fire incidents per year is 90. The highest number of fires - 122 took place in 2018, and the least - 28 in 2004. The data has an increasing trend.
When looking into fire subcategories, the most incidents belonged to: Structure Fires (50.5%), and Mobile Property/Vehicle Fires (26.2%).
Fire incident types reported to NFIRS in Zip Code 60428


 Based on the data from the years 2004 - 2018 the average number of fire incidents per year is 90. The highest number of fires - 122 took place in 2018, and the least - 28 in 2004. The data has an increasing trend.
 When looking into fire subcategories, the most incidents belonged to: Structure Fires (50.5%), and Mobile Property/Vehicle Fires (26.2%).