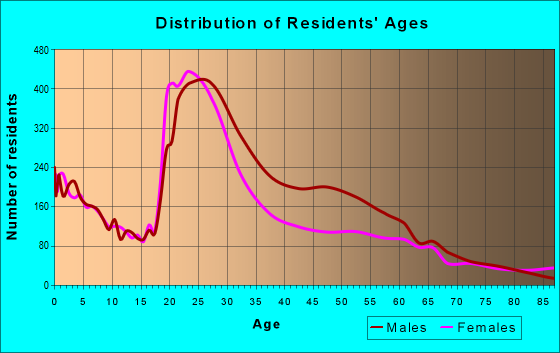
Estimated zip code population in 2022: 28,280 Zip code population in 2010: 27,121 Zip code population in 2000: 27,282
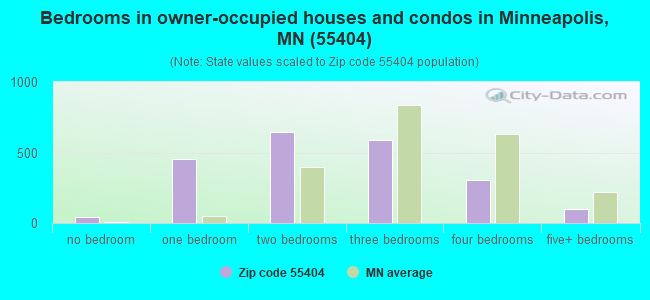
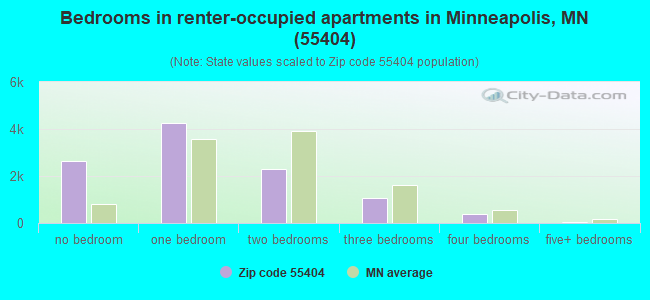
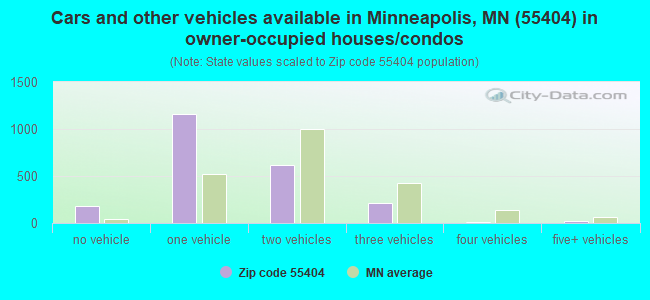
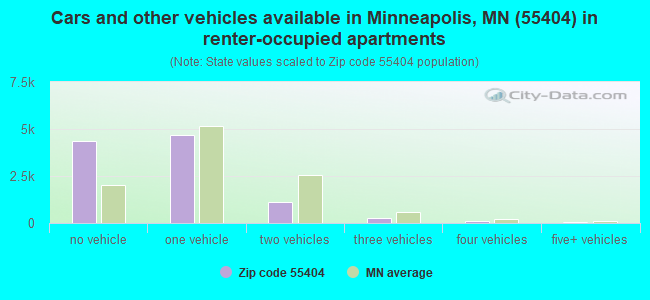
Houses and condos: 13,953 Renter-occupied apartments: 10,516
% of renters here:
83%
State:
28%
March 2022 cost of living index in zip code 55404: 117.0 (more than average, U.S. average is 100)
Land area: 1.8 sq. mi. Water area: 0.0 sq. mi.
Population density: 15,941 people per square mile
(very high).
OSM Map
General Map
Google Map
MSN Map
OSM Map
General Map
Google Map
MSN Map
OSM Map
General Map
Google Map
MSN Map
OSM Map
General Map
Google Map
MSN Map
Please wait while loading the map...
Real estate property taxes paid for housing units in 2022:
This zip code:
1.2% ($3,521)
Minnesota:
1.0% ($3,087)
Median real estate property taxes paid for housing units with mortgages in 2022: $3,651 (1.1%) Median real estate property taxes paid for housing units with no mortgage in 2022: $3,084 (1.3%)
Averages for the 2020 tax year for zip code 55404, filed in 2021:
Average Adjusted Gross Income (AGI) in 2020: $41,966 (Individual Income Tax Returns)
Here:
$41,966
State:
$82,178
Salary/wage: $37,856 (reported on 86.9% of returns)
Here:
$37,856
State:
$67,438
(% of AGI for various income ranges: 1169.6% for AGIs below $25k, 3957.4% for AGIs $25k-50k, 7612.6% for AGIs $50k-75k, 12028.0% for AGIs $75k-100k, 19931.7% for AGIs $100k-200k, 80045.0% for AGIs over 200k)
Taxable interest for individuals: $988 (reported on 13.2% of returns)
This zip code:
$988
Minnesota:
$1,814
(% of AGI for various income ranges: 2.4% for AGIs below $25k, 7.2% for AGIs $25k-50k, 16.5% for AGIs $50k-75k, 26.0% for AGIs $75k-100k, 137.6% for AGIs $100k-200k, 935.0% for AGIs over 200k)
Ordinary dividends: $3,844 (reported on 10.1% of returns)
Here:
$3,844
State:
$6,928
(% of AGI for various income ranges: 6.0% for AGIs below $25k, 10.3% for AGIs $25k-50k, 47.1% for AGIs $50k-75k, 110.3% for AGIs $75k-100k, 326.6% for AGIs $100k-200k, 3615.0% for AGIs over 200k)
Net capital gain/loss in AGI: +$10,805 (reported on 9.5% of returns)
Here:
+$10,805
State:
+$20,591
(% of AGI for various income ranges: 4.8% for AGIs below $25k, 15.9% for AGIs $25k-50k, 69.6% for AGIs $50k-75k, 200.9% for AGIs $75k-100k, 723.4% for AGIs $100k-200k, 12900.0% for AGIs over 200k)
Profit/loss from business: +$10,130 (reported on 18.9% of returns)
Here:
+$10,130
State:
+$14,342
(% of AGI for various income ranges: 203.4% for AGIs below $25k, 218.8% for AGIs $25k-50k, 255.5% for AGIs $50k-75k, 290.9% for AGIs $75k-100k, 672.4% for AGIs $100k-200k, 5211.7% for AGIs over 200k)
Taxable individual retirement arrangement distribution: $17,231 (reported on 2.5% of returns)
55404:
$17,231
Minnesota:
$20,675
(% of AGI for various income ranges: 11.7% for AGIs below $25k, 20.9% for AGIs $25k-50k, 51.4% for AGIs $50k-75k, 208.3% for AGIs $75k-100k, 508.6% for AGIs $100k-200k, 2088.3% for AGIs over 200k)
Self-employed (Keogh) retirement plans: $16,667 (reported on 0.3% of returns)
55404:
$16,667
Minnesota:
$23,059
(% of AGI for various income ranges: 172.4% for AGIs $100k-200k)
Total itemized deductions: $26,644 (reported on 3.9% of returns)
Here:
$26,644
State:
$33,311
(% of AGI for various income ranges: 10.8% for AGIs below $25k, 26.2% for AGIs $25k-50k, 109.8% for AGIs $50k-75k, 554.3% for AGIs $75k-100k, 1274.5% for AGIs $100k-200k, 6811.7% for AGIs over 200k)
Charity contributions: $9,609 (reported on 2.9% of returns)
Here:
$9,609
State:
$11,879
(% of AGI for various income ranges: 6.1% for AGIs $25k-50k, 7.9% for AGIs $50k-75k, 94.0% for AGIs $75k-100k, 257.6% for AGIs $100k-200k, 3068.3% for AGIs over 200k)
Taxes paid: $8,425 (reported on 3.8% of returns)
55404:
$8,425
State:
$8,252
(% of AGI for various income ranges: 6.8% for AGIs $25k-50k, 31.8% for AGIs $50k-75k, 210.6% for AGIs $75k-100k, 525.9% for AGIs $100k-200k, 1535.0% for AGIs over 200k)
Earned income credit: $2,073 (reported on 24.1% of returns)
Here:
$2,073
State:
$2,055
(% of AGI for various income ranges: 102.9% for AGIs below $25k, 74.1% for AGIs $25k-50k, 1.8% for AGIs $50k-75k)
Percentage of individuals using paid preparers for their 2020 taxes: 93.3%
Here:
93%
State:
94%
(% for various income ranges: 93.1% for AGIs below $25k, 92.8% for AGIs $25k-50k, 94.6% for AGIs $50k-75k, 94.7% for AGIs $75k-100k, 94.4% for AGIs $100k-200k, 94.4% for AGIs over 200k)
Averages for the 2012 tax year for zip code 55404, filed in 2013:
Average Adjusted Gross Income (AGI) in 2012: $33,071 (Individual Income Tax Returns)
Here:
$33,071
State:
$67,192
Salary/wage: $31,714 (reported on 89.4% of returns)
Here:
$31,714
State:
$55,182
(% of AGI for various income ranges: 84.6% for AGIs below $25k, 92.0% for AGIs $25k-50k, 91.0% for AGIs $50k-75k, 86.3% for AGIs $75k-100k, 82.9% for AGIs $100k-200k, 72.0% for AGIs over 200k)
Taxable interest for individuals: $764 (reported on 15.5% of returns)
This zip code:
$764
Minnesota:
$1,664
(% of AGI for various income ranges: 0.3% for AGIs below $25k, 0.1% for AGIs $25k-50k, 0.3% for AGIs $50k-75k, 0.7% for AGIs $75k-100k, 0.6% for AGIs $100k-200k, 0.5% for AGIs over 200k)
Ordinary dividends: $2,983 (reported on 9.4% of returns)
Here:
$2,983
State:
$5,665
(% of AGI for various income ranges: 0.6% for AGIs below $25k, 0.5% for AGIs $25k-50k, 0.7% for AGIs $50k-75k, 0.8% for AGIs $75k-100k, 1.3% for AGIs $100k-200k, 1.6% for AGIs over 200k)
Net capital gain/loss in AGI: +$6,438 (reported on 7.7% of returns)
Here:
+$6,438
State:
+$16,131
(% of AGI for various income ranges: 0.3% for AGIs $25k-50k, 0.1% for AGIs $50k-75k, 0.9% for AGIs $75k-100k, 1.1% for AGIs $100k-200k, 8.3% for AGIs over 200k)
Profit/loss from business: +$9,602 (reported on 15.1% of returns)
Here:
+$9,602
State:
+$12,430
(% of AGI for various income ranges: 9.8% for AGIs below $25k, 2.7% for AGIs $25k-50k, 2.2% for AGIs $50k-75k, 3.0% for AGIs $75k-100k, 3.0% for AGIs $100k-200k, 3.8% for AGIs over 200k)
Taxable individual retirement arrangement distribution: $12,316 (reported on 2.7% of returns)
55404:
$12,316
Minnesota:
$15,212
(% of AGI for various income ranges: 0.6% for AGIs below $25k, 0.6% for AGIs $25k-50k, 1.1% for AGIs $50k-75k, 1.0% for AGIs $75k-100k, 3.6% for AGIs $100k-200k)
Self-employment retirement plans: $17,867 (reported on 0.3% of returns)
55404:
$17,867
Minnesota:
$17,874
Total itemized deductions: $20,780 (20% of AGI, reported on 12.8% of returns)
Here:
$20,780
State:
$24,665
Here:
20.4% of AGI
State:
19.6% of AGI
(% of AGI for various income ranges: 2.0% for AGIs below $25k, 3.7% for AGIs $25k-50k, 10.1% for AGIs $50k-75k, 12.9% for AGIs $75k-100k, 15.3% for AGIs $100k-200k, 14.3% for AGIs over 200k)
Charity contributions: $3,113 (reported on 9.3% of returns)
Here:
$3,113
State:
$3,948
(% of AGI for various income ranges: 0.2% for AGIs below $25k, 0.5% for AGIs $25k-50k, 1.3% for AGIs $50k-75k, 1.5% for AGIs $75k-100k, 1.6% for AGIs $100k-200k, 1.3% for AGIs over 200k)
Taxes paid: $8,915 (reported on 12.7% of returns)
55404:
$8,915
State:
$10,589
(% of AGI for various income ranges: 0.5% for AGIs below $25k, 1.0% for AGIs $25k-50k, 3.4% for AGIs $50k-75k, 5.2% for AGIs $75k-100k, 7.6% for AGIs $100k-200k, 8.0% for AGIs over 200k)
Earned income credit: $2,071 (reported on 28.4% of returns)
Here:
$2,071
State:
$2,037
(% of AGI for various income ranges: 7.2% for AGIs below $25k, 0.8% for AGIs $25k-50k)
Percentage of individuals using paid preparers for their 2012 taxes: 47.3%
Here:
47%
State:
55%
(% for various income ranges: 47.5% for AGIs below $25k, 46.1% for AGIs $25k-50k, 44.0% for AGIs $50k-75k, 45.7% for AGIs $75k-100k, 50.0% for AGIs $100k-200k, 83.3% for AGIs over 200k)
Averages for the 2004 tax year for zip code 55404, filed in 2005:
Average Adjusted Gross Income (AGI) in 2004: $24,966 (Individual Income Tax Returns)
Here:
$24,966
State:
$53,560
Salary/wage: $24,120 (reported on 89.9% of returns)
Here:
$24,120
State:
$46,177
(% of AGI for various income ranges: 108.9% for AGIs below $10k, 90.2% for AGIs $10k-25k, 92.7% for AGIs $25k-50k, 86.1% for AGIs $50k-75k, 76.2% for AGIs $75k-100k, 67.6% for AGIs over 100k)
Taxable interest for individuals: $1,214 (reported on 19.1% of returns)
This zip code:
$1,214
Minnesota:
$1,796
(% of AGI for various income ranges: 1.8% for AGIs below $10k, 0.8% for AGIs $10k-25k, 0.7% for AGIs $25k-50k, 0.5% for AGIs $50k-75k, 2.3% for AGIs $75k-100k, 1.2% for AGIs over 100k)
Taxable dividends: $2,264 (reported on 10.3% of returns)
Here:
$2,264
State:
$3,096
(% of AGI for various income ranges: 1.6% for AGIs below $10k, 0.6% for AGIs $10k-25k, 0.7% for AGIs $25k-50k, 0.7% for AGIs $50k-75k, 1.8% for AGIs $75k-100k, 1.8% for AGIs over 100k)
Net capital gain/loss: +$7,545 (reported on 8.4% of returns)
Here:
+$7,545
State:
+$10,864
(% of AGI for various income ranges: -0.5% for AGIs below $10k, 0.1% for AGIs $10k-25k, 0.4% for AGIs $25k-50k, 1.3% for AGIs $50k-75k, 3.7% for AGIs $75k-100k, 12.1% for AGIs over 100k)
Profit/loss from business: +$6,582 (reported on 12.1% of returns)
Here:
+$6,582
State:
+$10,442
(% of AGI for various income ranges: 10.3% for AGIs below $10k, 4.1% for AGIs $10k-25k, 1.7% for AGIs $25k-50k, 2.9% for AGIs $50k-75k, 3.7% for AGIs $75k-100k, 3.0% for AGIs over 100k)
IRA payment deduction: $2,240 (reported on 1.3% of returns)
55404:
$2,240
Minnesota:
$2,955
(% of AGI for various income ranges: 0.1% for AGIs $10k-25k, 0.1% for AGIs $25k-50k, 0.2% for AGIs $50k-75k, 0.1% for AGIs over 100k)
Self-employed pension: $5,286 (reported on 0.3% of returns)
Here:
$5,286
Minnesota:
$12,099
Total itemized deductions: $15,910 (24% of AGI, reported on 13.1% of returns)
Here:
$15,910
State:
$20,035
Here:
24.0% of AGI
State:
21.3% of AGI
(% of AGI for various income ranges: 5.7% for AGIs below $10k, 3.7% for AGIs $10k-25k, 6.2% for AGIs $25k-50k, 11.6% for AGIs $50k-75k, 16.9% for AGIs $75k-100k, 15.0% for AGIs over 100k)
Charity contributions deductions: $3,317 (5% of AGI, reported on 10.1% of returns)
Here:
$3,317
State:
$3,333
Here:
4.6% of AGI
State:
3.4% of AGI
(% of AGI for various income ranges: 0.3% for AGIs below $10k, 0.5% for AGIs $10k-25k, 1.0% for AGIs $25k-50k, 2.0% for AGIs $50k-75k, 3.9% for AGIs $75k-100k, 2.1% for AGIs over 100k)
Total tax: $3,734 (reported on 64.7% of returns)
55404:
$3,734
State:
$8,485
(% of AGI for various income ranges: 2.7% for AGIs below $10k, 4.3% for AGIs $10k-25k, 8.2% for AGIs $25k-50k, 12.1% for AGIs $50k-75k, 13.7% for AGIs $75k-100k, 19.6% for AGIs over 100k)
Earned income credit: $1,494 (reported on 28.2% of returns)
Here:
$1,494
State:
$1,523
Percentage of individuals using paid preparers for their 2004 taxes: 57.2%
Here:
57%
State:
59%
(% for various income ranges: 60.9% for AGIs below $10k, 59.5% for AGIs $10k-25k, 49.2% for AGIs $25k-50k, 53.3% for AGIs $50k-75k, 65.7% for AGIs $75k-100k, 67.8% for AGIs over 100k)
Likely homosexual households (counted as self-reported same-sex unmarried-partner households)
Lesbian couples: 0.1% of all households
Gay men: 0.1% of all households
Household received Food Stamps/SNAP in the past 12 months: 3,740 Household did not receive Food Stamps/SNAP in the past 12 months: 8,970
Women who had a birth in the past 12 months: 313 (182 now married, 126 unmarried) Women who did not have a birth in the past 12 months: 7,193 (1,549 now married, 5,632 unmarried)
Housing units in zip code 55404 with a mortgage: 1,514 (156 second mortgage, 19 home equity loan, 81 both second mortgage and home equity loan) Houses without a mortgage: 18
Median monthly owner costs for units with a mortgage: $2,031 Median monthly owner costs for units without a mortgage: $830
Residents with income below the poverty level in 2022:
This zip code:
32.6%
Whole state:
9.6%
Residents with income below 50% of the poverty level in 2022:
This zip code:
19.5%
Whole state:
5.2%
Median number of rooms in houses and condos:
Here:
5.4
State:
7.1
Median number of rooms in apartments:
Here:
3.0
State:
3.8
Notable locations in this zip code not listed on our city pages
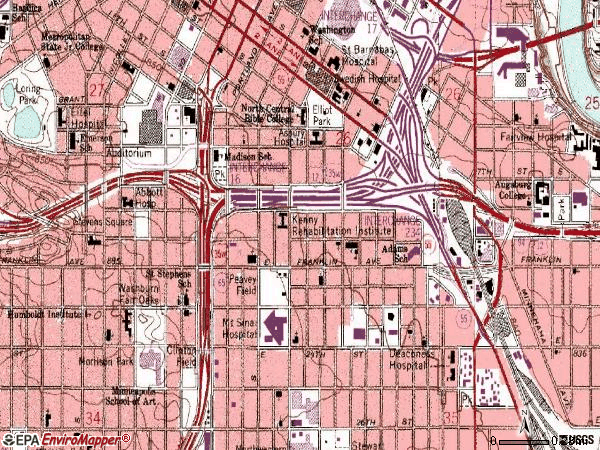
Notable locations in zip code 55404: Slater Square (A), Minneapolis Fire Department Station 7 (B), Minneapolis College of Art and Design (C), Coe Mansion Carriage House (D), Century Plaza (E). Display/hide their locations on the map
Churches in zip code 55404 include: Witnesses for Christ Church (A), Twin City Fellowship Church (B), Trinity First Lutheran Church (C), Straitgate Church (D), Saint Stephens Catholic Church (E), Saint Pauls Evangelical Lutheran Church (F), Sagrado Corazon de Jesus (G), Our Saviours Lutheran Church (H), Old Church of Christ Scientist (I). Display/hide their locations on the map
Parks in zip code 55404 include: Elliot Park (1), Morrison Park (2), Peavey Field (3), Washburn Fair Oaks (4), East Phillips Park (5), Cedar Avenue Field (6), Franklin Steele Park (7), Clinton Field (8). Display/hide their locations on the map
Tourist attractions (not listed on the city page) : Purcell-Cutts House (Cultural Attractions- Events- & Facilities; 2400 3rd Avenue South), Michael's Services (Arcades & Amusements; 2514 11th Avenue South).
2,670 married couples with children.
2,293 single-parent households (553 men, 1,740 women).
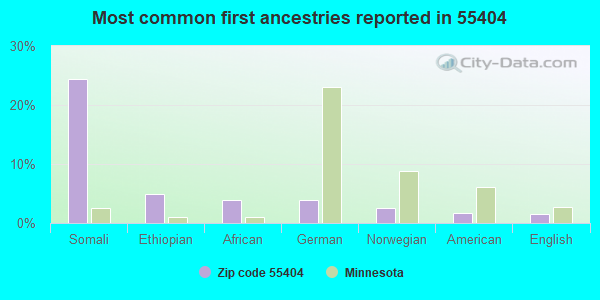
61.9% of residents of 55404 zip code speak English at home.
13.6% of residents speak Spanish at home (48% very well, 21% well, 21% not well, 11% not at all).
1.6% of residents speak other Indo-European language at home (74% very well, 22% well, 5% not well).
1.7% of residents speak Asian or Pacific Island language at home (72% very well, 11% well, 15% not well, 2% not at all).
22.7% of residents speak other language at home (54% very well, 19% well, 20% not well, 7% not at all).
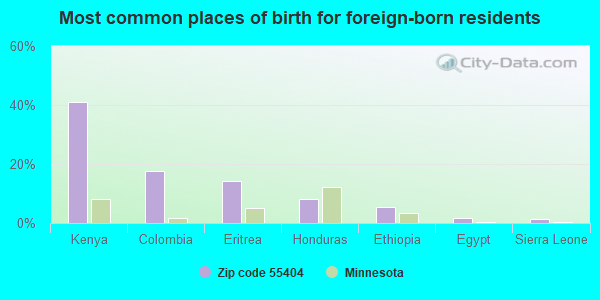
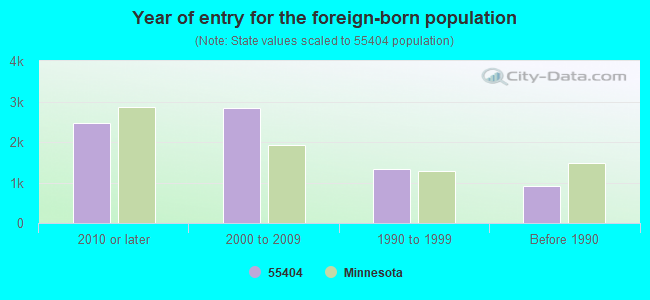
Foreign born population: 7,150 (25.3%) (54.5% of them are naturalized citizens)
Major facilities with environmental interests located in this zip code:
MINNEAPOLIS SOCIETY OF FINE ARTS (2400 3RD AVENUE SOUTH in MINNEAPOLIS, MN)
AIR MINOR (AIRS/AFS) STATE MASTER (Minnesota Pollution Control Agency permits and compilance tracking) - PCS-C00010449, NPDES STORMWATER PERMIT STATE MASTER (Minnesota Pollution Control Agency permits and compilance tracking) - RCRAINFO-MND077633840, HAZARDOUS WASTE PROGRAM, RCRIS-MND077633840, STATE MASTER (Minnesota Pollution Control Agency permits and compilance tracking) - AIRS-2705301120, AIR PROGRAM, AFS-2705301120, AIR SYNTHETIC MINOR CRITERIA AND HAZARDOUS AIR POLLUTANT INVENTORY (Inventory of air pollution sources) Small Quantity Generators, between 100 kg and 1000 kg of hazardous waste/month (Resource Conservation and Recovery Act (tracking hazardous waste)) - notification Business SIC classification: MUSEUMS AND ART GALLERIES Business NAICS classification: MUSEUMS.; HISTORICAL SITES. Organizations: MNPLS SOC OF FINE ARTS (CONTACT/OWNER)
, MINNEAPOLIS INSTITUTE OF ARTS (CONTACT/OWNER)
Alternative names: MINNEAPOLIS INSTITUTE OF ARTS, MPLS SOCIETY OF FINE ARTS
MINNEAPOLIS COLLEGE OF ART& DESIGN (2501 STEVENS AVE in MINNEAPOLIS, MN)
STATE MASTER (Minnesota Pollution Control Agency permits and compilance tracking) - RCRAINFO-MND982645467, HAZARDOUS WASTE PROGRAM, RCRIS-MND982645467, SQG (Resource Conservation and Recovery Act (tracking hazardous waste)) Organizations: GIMMESTAD STELLA (CONTACT/OWNER)
, MINNEAPOLIS COLLEGE OF ART & DESIGN (CONTACT/OWNER)
BK HAULING & RECYCLING - CHICAGO AVE (2123 CHICAGO AVE S in MINNEAPOLIS, MN)
STATE MASTER (Minnesota Pollution Control Agency permits and compilance tracking) - RCRIS-MNR000114926, LQG (Resource Conservation and Recovery Act (tracking hazardous waste)) Business NAICS classification: OTHER WASTE COLLECTION. Organizations: C&Q (CONTACT/OPERATOR)
, C & Q ENTERPRISES (CONTACT/OWNER)
MINNEAPOLIS CHILDREN'S MEDICAL CENTER (2525 CHICAGO AVENUE 8 in MINNEAPOLIS, MN)
STATE MASTER (Minnesota Pollution Control Agency permits and compilance tracking) - RCRAINFO-MND078689619, HAZARDOUS WASTE PROGRAM, RCRIS-MND078689619, LQG COMPLIANCE ACTIVITY (Tracking inspections of insecticide, fungicide, and rodenticide, and toxic substances) Large Quantity Generators, more that 1000 kg of hazardous waste/month (Resource Conservation and Recovery Act (tracking hazardous waste)) Business SIC classification: OFFICES AND CLINICS OF DOCTORS OF MEDICINE Business NAICS classification: OFFICES OF PHYSICIANS (EXCEPT MENTAL HEALTH SPECIALISTS). Organizations: CHILDREN S HOSPITALS & CLINICS (CONTACT/OWNER)
, CHILDREN`S HOSPITALS & CLINICS (CONTACT/OWNER)
Alternative names: CHILDRENS HEALTH CARE MINNEAPOLIS, MINNEAPOLIS CHILDRENS HOSPITALS AND CLINICS, MPLS CHILDRENS HOSPITALS& CLINICS
NRG MINNEAPOLIS ENERGY CENTER (MEC) (816 4TH AVENUE SOUTH in MINNEAPOLIS, MN)
AIR MAJOR (AIRS/AFS) STATE MASTER (Minnesota Pollution Control Agency permits and compilance tracking) - AIRS-2705300011, AIR PROGRAM, RCRAINFO-MND982640021, CESQG, PCS-MN0056995, NPDES NON-MAJOR, AFS-2705300011, AIR MAJOR, RCRIS-MND982640021, CESQG CRITERIA AND HAZARDOUS AIR POLLUTANT INVENTORY (Inventory of air pollution sources) Conditionally Exempt Small Quantity Generators, less than 100 kg/month of hazardous waste (Resource Conservation and Recovery Act (tracking hazardous waste)) - notification Business SIC and NAICS classification: STEAM AND AIR-CONDITIONING SUPPLY Organizations: NRG ENERGY CENTER INC (CONTACT/OWNER)
, NRG ENERGY CENTER MINNEAPOLIS LLC (CONTACT/OWNER)
Alternative names: NRG ENERGY CENTER, NRG ENERGY MPLS ENERGY CTR MAIN
BANNER CREATIONS (1433 E FRANKLIN AVE in MINNEAPOLIS, MN)
STATE MASTER (Minnesota Pollution Control Agency permits and compilance tracking) - RCRAINFO-MND985678051, HAZARDOUS WASTE PROGRAM, RCRIS-MND985678051, (Resource Conservation and Recovery Act (tracking hazardous waste)) Business SIC classification: FABRICATED TEXTILE PRODUCTS Business NAICS classification: COMMERCIAL SCREEN PRINTING. Organizations: BANNER CREATIONS INC (CONTACT/OWNER)
BERNIE AND JIMS AMOCO (2550 CHICAGO AVE S in MINNEAPOLIS, MN)
STATE MASTER (Minnesota Pollution Control Agency permits and compilance tracking) - RCRAINFO-MND981538499, CESQG, RCRIS-MND981538499, (Resource Conservation and Recovery Act (tracking hazardous waste)) Business SIC classification: GASOLINE SERVICE STATIONS Business NAICS classification: GASOLINE STATIONS WITH CONVENIENCE STORES. Organizations: TERHAR BERNIE (CONTACT/OWNER)
, BERNIE & JIM S AMOCO (CONTACT/OWNER)
CENTURY PLAZA (1111 3RD AVE S in MINNEAPOLIS, MN)
STATE MASTER (Minnesota Pollution Control Agency permits and compilance tracking) - RCRAINFO-MN0000327072, CESQG, RCRIS-MN0000327072, Conditionally Exempt Small Quantity Generators, less than 100 kg/month of hazardous waste (Resource Conservation and Recovery Act (tracking hazardous waste)) - notification (Resource Conservation and Recovery Act (tracking hazardous waste)) Organizations: HENNEPIN COUNTY (CONTACT/OWNER)
, HENNEPIN COUNTY PROPERTY SERVICES (CONTACT/OWNER)
MNDOT HIGHWAY 55 CONSTRUCTION SITE (NE OF 25 1/2 ST& HIGHWAY 55 in MINNEAPOLIS, MN)
STATE MASTER (Minnesota Pollution Control Agency permits and compilance tracking) - RCRAINFO-MNR000059485, LQG, RCRIS-MNR000059485, HAZARDOUS WASTE PROGRAM (Resource Conservation and Recovery Act (tracking hazardous waste)) Organizations: STATE OF MN (CONTACT/OWNER)
, MNDOT CENTRAL OFFICE (CONTACT/OWNER)
Alternative names: MNDOT HWY 55 CONSTRUCTION SITE
MINNEAPOLIS CITY OF EQUIPMENT (1911 E 26TH ST in MINNEAPOLIS, MN)
STATE MASTER (Minnesota Pollution Control Agency permits and compilance tracking) - RCRAINFO-MND985757046, CESQG, RCRIS-MND985757046, (Resource Conservation and Recovery Act (tracking hazardous waste))
MINNESOTA BLUEPRINT (2001 E 24TH ST in MINNEAPOLIS, MN)
STATE MASTER (Minnesota Pollution Control Agency permits and compilance tracking) - RCRAINFO-MND985766179, CESQG, RCRIS-MND985766179, (Resource Conservation and Recovery Act (tracking hazardous waste)) Organizations: GUSTAFSON JAMES (CONTACT/OWNER)
MONOTRADE COMPANIES (811 PARK AVE in MINNEAPOLIS, MN)
STATE MASTER (Minnesota Pollution Control Agency permits and compilance tracking) - RCRAINFO-MN0000012385, CESQG, RCRIS-MN0000012385, (Resource Conservation and Recovery Act (tracking hazardous waste)) Organizations: PLAISANCE RICHARD (CONTACT/OWNER)
MINNEAPOLIS MEDICAL RESEARCH FOUNDATION (900 S 8TH ST in MINNEAPOLIS, MN)
STATE MASTER (Minnesota Pollution Control Agency permits and compilance tracking) - RCRAINFO-MND982205601, HAZARDOUS WASTE PROGRAM, RCRIS-MND982205601, (Resource Conservation and Recovery Act (tracking hazardous waste)) Business SIC classification: HEALTH AND ALLIED SERVICES
Housing units lacking complete plumbing facilities: 0.9% Housing units lacking complete kitchen facilities: 0.8%
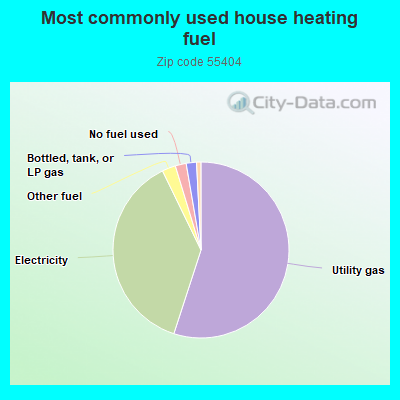
55.0%Utility gas
37.8%Electricity
2.5%Other fuel
2.0%No fuel used
1.9%Bottled, tank, or LP gas
Population in 1990: 19,903. Population change in the 1990s: +7,379 (+37.1%).
Place of birth for U.S.-born residents:
This state: 12,609
Northeast: 1,064
Midwest: 4,492
South: 1,614
West: 1,039
30% of the 55404 zip code residents lived in the same house 5 years ago. Out of people who lived in different houses, 51% lived in this county. Out of people who lived in different counties, 50% lived in Minnesota.
81% of the 55404 zip code residents lived in the same house 1 year ago. Out of people who lived in different houses, 55% moved from this county. Out of people who lived in different houses, 21% moved from different county within same state. Out of people who lived in different houses, 18% moved from different state. Out of people who lived in different houses, 3% moved from abroad.
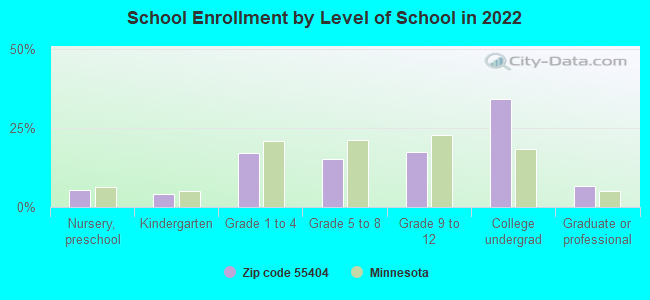
Private vs. public school enrollment:
Students in private schools in grades 1 to 8 (elementary and middle school): 543
Here:
21.3%
Minnesota:
12.9%
Students in private schools in grades 9 to 12 (high school): 199
Here:
14.6%
Minnesota:
8.6%
Students in private undergraduate colleges: 1,219
Here:
44.4%
Minnesota:
26.2%
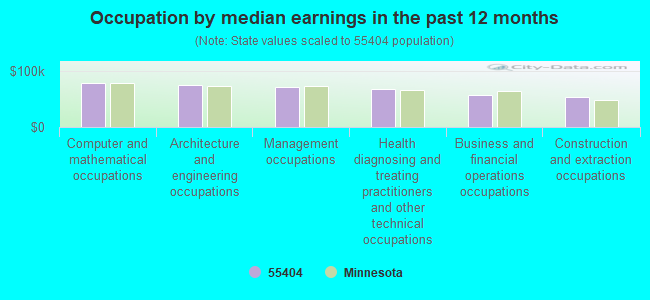
Occupation by median earnings in the past 12 months ($)
77,889Computer and mathematical occupations
74,509Architecture and engineering occupations
70,979Management occupations
67,305Health diagnosing and treating practitioners and other technical occupations
56,542Business and financial operations occupations
52,528Construction and extraction occupations
Companies with federal contracts located in this zip code (MINNEAPOLIS, MN):
TASKS UNLIMITED BUILDING SERVI (2419 NICOLLET AVENUE SOUTH) : $96,522,722 in 81 contractsfrom 1999 to 2006
Contracts for Custodial Janitorial Services, Maintenance, Repair or Alteration of Real Property -- Office Buildings, Mailing and Distribution Services by Public Buildings Service, Army, Air Force, U.S. Army Corps of Engineers - civil program financing only, and others Signed by year:2000: $2,790,480; 2001: $81,531,320; 2002: $3,390,060; 2003: $4,482,296; 2004: $2,035,097; 2005: $2,140,361; 2006: -$12,115.
Biggest contracts:
$79,271,000 with Public Buildings Service for Custodial Janitorial Services. Taking place in IN. Signed on 2001-03-15. Completion date: 1998-04-15.
$1,214,009 with Public Buildings Service for Custodial Janitorial Services. Signed on 2003-08-15. Completion date: 2003-08-15.
$1,206,872, same as above.Signed on 2002-08-15. Completion date: 2003-08-15.
$1,151,000, same as above.Signed on 2000-10-15. Completion date: 2000-05-15.
ITERATIVITY INC (118 E 26TH ST STE 201; small business) : $314,592 in 2 contractsin 2005
$185,879 with Department of Defense for Defense Electronics and Communication Equipment -- Advanced Development (R&D). Signed on 2005-02-10. Completion date: 2007-02-14.
$128,713, same as above.Signed on 2005-05-03. Completion date: 2007-02-14.
ASSN OF SIDS & INFANT (No data from D and B) 5 employees, $0 revenue. Educational Institution: $220,818 in 3 contractsfrom 2001 to 2002
$100,000 with Health Resources and Services Administration for Other Professional Services. Taking place in MD. Signed on 2001-09-15. Completion date: 2002-10-15.
$60,409 with National Institutes of Health for Laboratory Equipment and Supplies. Taking place in MD. Signed on 2002-12-15. Completion date: 2003-03-15.
$60,409 with National Institutes of Health for Laboratory Testing Services. Taking place in MD. Signed on 2002-12-15. Completion date: 2003-03-15.
EAGLE EMPLOYMENT INCORPORATED (1113 EAST FRANKLIN AVE, SU; small business) : $72,074 in 6 contractsfrom 2005 to 2006
Contracts for Other Professional Services, Civilian Personnel Recruitment, Other Medical Services, Personnel Testing by Animal and Plant Health Inspection Service, Army, Department of Veterans Affairs Signed by year:2000: $0; 2001: $0; 2002: $0; 2003: $0; 2004: $0; 2005: $43,450; 2006: $28,624.
Biggest contracts:
$22,282 with Animal and Plant Health Inspection Service for Other Professional Services. Signed on 2005-05-19. Completion date: 2005-07-29.
$21,168, same as above.Signed on 2005-08-02. Completion date: 2005-09-30.
$12,785 with Army for Civilian Personnel Recruitment. Signed on 2006-06-05. Completion date: 2006-09-30.
$8,970 with Department of Veterans Affairs for Other Medical Services. Signed on 2006-04-28. Effective on 2006-05-01. Completion date: 2006-06-02.
JEFFERSON PARTNERS L P (2100 E 26TH ST; small business)
$3,435 with Army for Lease or Rental of Equipment -- Ground Effect Vehicles, Motor Vehicles, Trailers, and Cycles. Signed on 2005-01-19. Completion date: 2005-01-19.
Top industries in this zip code by the number of employees in 2005:
Health Care and Social Assistance: Offices of Physicians (except Mental Health Specialists) (500-999 employees: 1 establishment, 100-249 employees: 2 establishments, 50-99 employees: 3 establishments, 20-49 employees: 6 establishments, 10-19 employees: 10 establishments, 5-9 employees: 4 establishments, 1-4 employees: 10 establishments)
Health Care and Social Assistance: General Medical and Surgical Hospitals (over 1000: 1)
Health Care and Social Assistance: Other Individual and Family Services (100-249: 1, 50-99: 1, 20-49: 10, 10-19: 10, 5-9: 5, 1-4: 19)
Educational Services: Colleges, Universities, and Professional Schools (250-499: 2)
Information: Data Processing, Hosting, and Related Services (250-499: 1, 100-249: 1)
Health Care and Social Assistance: Services for the Elderly and Persons with Disabilities (250-499: 1, 50-99: 1, 20-49: 2, 10-19: 1, 1-4: 4)
Administrative and Support and Waste Management and Remediation Services: Temporary Help Services (250-499: 1, 50-99: 1, 10-19: 1, 1-4: 1)
Other Services (except Public Administration): Religious Organizations (50-99: 2, 20-49: 6, 10-19: 3, 5-9: 4, 1-4: 11)
Health Care and Social Assistance: Home Health Care Services (100-249: 1, 50-99: 1, 20-49: 4, 10-19: 1, 1-4: 1)
Arts, Entertainment, and Recreation: Museums (250-499: 1, 5-9: 1)
People in group quarters in 2010:
956 people in college/university student housing
729 people in other noninstitutional facilities
610 people in nursing facilities/skilled-nursing facilities
399 people in group homes intended for adults
391 people in emergency and transitional shelters (with sleeping facilities) for people experiencing homelessness
376 people in residential treatment centers for adults
44 people in group homes for juveniles (non-correctional)
20 people in mental (psychiatric) hospitals and psychiatric units in other hospitals
18 people in workers' group living quarters and job corps centers
People in group quarters in 2000:
1,000 people in college dormitories (includes college quarters off campus)
761 people in other noninstitutional group quarters
667 people in nursing homes
634 people in homes or halfway houses for drug/alcohol abuse
273 people in other group homes
235 people in other nonhousehold living situations
99 people in local jails and other confinement facilities (including police lockups)
74 people in hospitals/wards and hospices for chronically ill
74 people in other hospitals or wards for chronically ill
69 people in homes for the mentally ill
45 people in schools, hospitals, or wards for the intellectually disabled
37 people in homes for the mentally retarded
15 people in religious group quarters
9 people in unknown juvenile institutions
Fatal accident statistics in 2013:
Fatal accident count: 2
Vehicles involved in fatal accidents: 3
Fatal accidents caused by drunken drivers: 1
Fatalities: 2
Persons involved in fatal accidents: 6
Pedestrians involved in fatal accidents: 0
Fatal accident statistics in 2012:
Fatal accident count: 2
Vehicles involved in fatal accidents: 2
Fatal accidents caused by drunken drivers: 1
Fatalities: 2
Persons involved in fatal accidents: 2
Pedestrians involved in fatal accidents: 1
Home Mortgage Disclosure Act Aggregated Statistics For Year 2009 (Based on 5 full and 18 partial tracts)
A) FHA, FSA/RHS & VA Home Purchase Loans
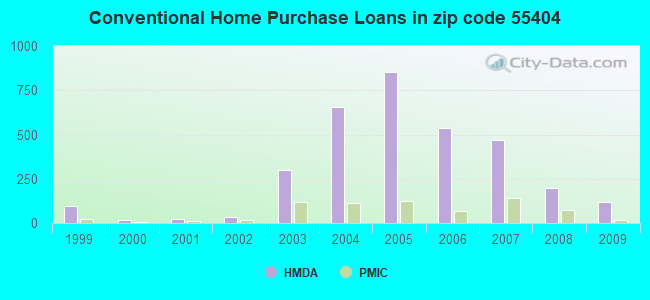
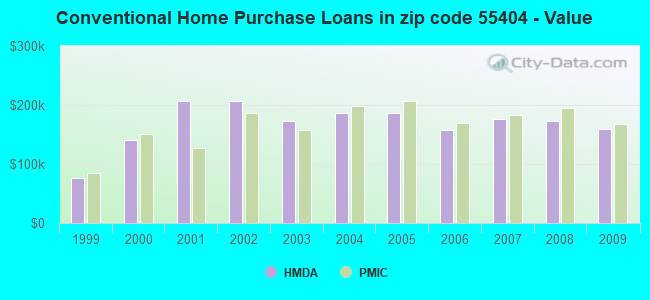
B) Conventional Home Purchase Loans
C) Refinancings
D) Home Improvement Loans
E) Loans on Dwellings For 5+ Families
F) Non-occupant Loans on < 5 Family Dwellings (A B C & D)
G) Loans On Manufactured Home Dwelling (A B C & D)
Number
Average Value
Number
Average Value
Number
Average Value
Number
Average Value
Number
Average Value
Number
Average Value
Number
Average Value
LOANS ORIGINATED
103
$170,922
121
$159,721
221
$193,357
10
$93,164
28
$654,942
67
$147,742
0
$0
APPLICATIONS APPROVED, NOT ACCEPTED
5
$150,014
9
$172,316
28
$167,471
2
$14,895
2
$102,815
6
$126,132
0
$0
APPLICATIONS DENIED
19
$140,487
35
$121,453
119
$198,386
10
$102,384
3
$793,333
30
$153,037
2
$39,945
APPLICATIONS WITHDRAWN
16
$166,429
16
$158,042
83
$218,264
5
$65,324
4
$759,748
15
$204,584
0
$0
FILES CLOSED FOR INCOMPLETENESS
2
$221,000
6
$152,372
20
$165,997
1
$39,870
0
$0
0
$0
0
$0
Aggregated Statistics For Year 2008 (Based on 5 full and 18 partial tracts)
A) FHA, FSA/RHS & VA Home Purchase Loans
B) Conventional Home Purchase Loans
C) Refinancings
D) Home Improvement Loans
E) Loans on Dwellings For 5+ Families
F) Non-occupant Loans on < 5 Family Dwellings (A B C & D)
G) Loans On Manufactured Home Dwelling (A B C & D)
Number
Average Value
Number
Average Value
Number
Average Value
Number
Average Value
Number
Average Value
Number
Average Value
Number
Average Value
LOANS ORIGINATED
51
$158,673
199
$172,572
132
$206,282
19
$109,456
17
$1,226,333
79
$157,720
0
$0
APPLICATIONS APPROVED, NOT ACCEPTED
7
$189,287
22
$187,657
24
$184,154
3
$25,107
0
$0
9
$192,457
0
$0
APPLICATIONS DENIED
13
$145,031
64
$147,845
96
$198,795
13
$29,395
6
$1,013,380
42
$123,421
2
$20,305
APPLICATIONS WITHDRAWN
11
$194,834
36
$146,210
58
$189,435
11
$123,400
4
$766,498
19
$142,477
0
$0
FILES CLOSED FOR INCOMPLETENESS
1
$74,000
11
$138,855
17
$190,910
7
$113,937
0
$0
5
$137,874
0
$0
Aggregated Statistics For Year 2007 (Based on 5 full and 18 partial tracts)
A) FHA, FSA/RHS & VA Home Purchase Loans
B) Conventional Home Purchase Loans
C) Refinancings
D) Home Improvement Loans
E) Loans on Dwellings For 5+ Families
F) Non-occupant Loans on < 5 Family Dwellings (A B C & D)
G) Loans On Manufactured Home Dwelling (A B C & D)
Number
Average Value
Number
Average Value
Number
Average Value
Number
Average Value
Number
Average Value
Number
Average Value
Number
Average Value
LOANS ORIGINATED
8
$169,914
471
$176,269
189
$193,873
21
$75,030
37
$789,066
140
$193,904
0
$0
APPLICATIONS APPROVED, NOT ACCEPTED
2
$205,220
90
$193,493
67
$168,776
10
$65,526
0
$0
26
$196,482
0
$0
APPLICATIONS DENIED
0
$0
181
$249,880
162
$232,851
15
$116,017
2
$2,125,735
85
$252,302
4
$32,635
APPLICATIONS WITHDRAWN
2
$152,910
78
$208,670
61
$191,251
6
$121,035
7
$570,933
17
$281,402
0
$0
FILES CLOSED FOR INCOMPLETENESS
0
$0
29
$185,929
11
$216,968
0
$0
0
$0
7
$174,483
0
$0
Aggregated Statistics For Year 2006 (Based on 5 full and 18 partial tracts)
A) FHA, FSA/RHS & VA Home Purchase Loans
B) Conventional Home Purchase Loans
C) Refinancings
D) Home Improvement Loans
E) Loans on Dwellings For 5+ Families
F) Non-occupant Loans on < 5 Family Dwellings (A B C & D)
Number
Average Value
Number
Average Value
Number
Average Value
Number
Average Value
Number
Average Value
Number
Average Value
LOANS ORIGINATED
8
$173,702
535
$156,828
305
$176,655
33
$74,755
43
$827,973
195
$182,550
APPLICATIONS APPROVED, NOT ACCEPTED
0
$0
132
$173,556
84
$205,459
9
$56,227
0
$0
33
$162,910
APPLICATIONS DENIED
4
$110,945
281
$190,293
187
$183,151
25
$43,396
5
$1,012,242
82
$210,198
APPLICATIONS WITHDRAWN
1
$173,830
119
$184,531
115
$192,726
9
$65,759
2
$1,595,820
51
$196,767
FILES CLOSED FOR INCOMPLETENESS
1
$112,000
19
$194,045
29
$201,724
3
$191,997
0
$0
8
$244,759
Aggregated Statistics For Year 2005 (Based on 5 full and 18 partial tracts)
A) FHA, FSA/RHS & VA Home Purchase Loans
B) Conventional Home Purchase Loans
C) Refinancings
D) Home Improvement Loans
E) Loans on Dwellings For 5+ Families
F) Non-occupant Loans on < 5 Family Dwellings (A B C & D)
G) Loans On Manufactured Home Dwelling (A B C & D)
Number
Average Value
Number
Average Value
Number
Average Value
Number
Average Value
Number
Average Value
Number
Average Value
Number
Average Value
LOANS ORIGINATED
12
$179,597
853
$185,739
309
$190,503
45
$65,382
54
$786,192
258
$183,232
0
$0
APPLICATIONS APPROVED, NOT ACCEPTED
0
$0
114
$165,639
59
$163,185
9
$59,171
0
$0
48
$172,290
2
$20,190
APPLICATIONS DENIED
0
$0
326
$175,054
222
$180,410
30
$65,718
3
$1,059,267
142
$174,135
2
$34,695
APPLICATIONS WITHDRAWN
0
$0
182
$165,052
142
$181,380
13
$232,341
0
$0
75
$191,905
0
$0
FILES CLOSED FOR INCOMPLETENESS
0
$0
45
$169,899
49
$262,972
3
$96,283
0
$0
18
$351,028
0
$0
Aggregated Statistics For Year 2004 (Based on 5 full and 18 partial tracts)
A) FHA, FSA/RHS & VA Home Purchase Loans
B) Conventional Home Purchase Loans
C) Refinancings
D) Home Improvement Loans
E) Loans on Dwellings For 5+ Families
F) Non-occupant Loans on < 5 Family Dwellings (A B C & D)
G) Loans On Manufactured Home Dwelling (A B C & D)
Number
Average Value
Number
Average Value
Number
Average Value
Number
Average Value
Number
Average Value
Number
Average Value
Number
Average Value
LOANS ORIGINATED
32
$145,265
658
$187,168
339
$167,184
29
$66,696
32
$744,291
186
$189,771
3
$38,230
APPLICATIONS APPROVED, NOT ACCEPTED
2
$167,670
96
$173,656
84
$182,439
8
$117,291
0
$0
30
$209,060
1
$71,510
APPLICATIONS DENIED
5
$160,348
120
$185,260
193
$164,513
40
$52,022
3
$386,420
67
$208,169
4
$84,122
APPLICATIONS WITHDRAWN
7
$203,867
82
$210,905
123
$175,360
11
$48,316
0
$0
28
$217,605
0
$0
FILES CLOSED FOR INCOMPLETENESS
0
$0
24
$213,022
47
$168,271
0
$0
0
$0
5
$233,214
0
$0
Aggregated Statistics For Year 2003 (Based on 5 full and 18 partial tracts)
A) FHA, FSA/RHS & VA Home Purchase Loans
B) Conventional Home Purchase Loans
C) Refinancings
D) Home Improvement Loans
E) Loans on Dwellings For 5+ Families
F) Non-occupant Loans on < 5 Family Dwellings (A B C & D)
Number
Average Value
Number
Average Value
Number
Average Value
Number
Average Value
Number
Average Value
Number
Average Value
LOANS ORIGINATED
26
$171,623
300
$172,792
670
$147,373
31
$29,868
61
$693,549
167
$171,316
APPLICATIONS APPROVED, NOT ACCEPTED
1
$241,290
67
$183,799
82
$131,901
6
$27,080
1
$860,000
31
$177,947
APPLICATIONS DENIED
5
$138,000
78
$181,748
208
$127,762
27
$31,764
1
$186,720
52
$176,386
APPLICATIONS WITHDRAWN
4
$170,180
53
$172,721
168
$125,964
3
$9,957
2
$484,535
31
$153,623
FILES CLOSED FOR INCOMPLETENESS
0
$0
19
$146,992
32
$123,634
5
$47,594
0
$0
2
$168,920
Aggregated Statistics For Year 2002 (Based on 2 partial tracts)
B) Conventional Home Purchase Loans
C) Refinancings
D) Home Improvement Loans
E) Loans on Dwellings For 5+ Families
F) Non-occupant Loans on < 5 Family Dwellings (A B C & D)
Number
Average Value
Number
Average Value
Number
Average Value
Number
Average Value
Number
Average Value
LOANS ORIGINATED
35
$206,510
58
$165,201
1
$32,010
14
$687,910
22
$210,732
APPLICATIONS APPROVED, NOT ACCEPTED
9
$206,406
10
$174,668
0
$0
0
$0
4
$156,850
APPLICATIONS DENIED
5
$129,106
17
$151,514
4
$28,010
1
$26,670
2
$246,475
APPLICATIONS WITHDRAWN
6
$288,090
16
$147,446
2
$37,345
0
$0
0
$0
FILES CLOSED FOR INCOMPLETENESS
3
$196,327
3
$205,930
0
$0
0
$0
2
$297,160
Aggregated Statistics For Year 2001 (Based on 2 partial tracts)
B) Conventional Home Purchase Loans
C) Refinancings
D) Home Improvement Loans
E) Loans on Dwellings For 5+ Families
F) Non-occupant Loans on < 5 Family Dwellings (A B C & D)
Number
Average Value
Number
Average Value
Number
Average Value
Number
Average Value
Number
Average Value
LOANS ORIGINATED
20
$206,038
57
$181,839
9
$27,387
12
$720,492
22
$244,197
APPLICATIONS APPROVED, NOT ACCEPTED
1
$170,720
4
$132,842
0
$0
0
$0
0
$0
APPLICATIONS DENIED
2
$269,415
16
$142,444
2
$18,670
0
$0
2
$316,900
APPLICATIONS WITHDRAWN
2
$163,785
19
$138,766
0
$0
0
$0
3
$163,607
FILES CLOSED FOR INCOMPLETENESS
5
$423,172
4
$177,388
0
$0
0
$0
2
$717,560
Aggregated Statistics For Year 2000 (Based on 2 partial tracts)
A) FHA, FSA/RHS & VA Home Purchase Loans
B) Conventional Home Purchase Loans
C) Refinancings
D) Home Improvement Loans
E) Loans on Dwellings For 5+ Families
F) Non-occupant Loans on < 5 Family Dwellings (A B C & D)
Number
Average Value
Number
Average Value
Number
Average Value
Number
Average Value
Number
Average Value
Number
Average Value
LOANS ORIGINATED
1
$130,170
19
$140,956
18
$172,202
16
$17,406
7
$416,587
10
$147,993
APPLICATIONS APPROVED, NOT ACCEPTED
0
$0
3
$98,163
4
$173,920
2
$29,875
1
$853,600
0
$0
APPLICATIONS DENIED
0
$0
7
$86,884
13
$99,642
7
$38,411
0
$0
1
$182,460
APPLICATIONS WITHDRAWN
0
$0
2
$288,090
7
$183,371
3
$71,133
1
$506,820
2
$138,710
FILES CLOSED FOR INCOMPLETENESS
0
$0
0
$0
1
$53,350
0
$0
0
$0
0
$0
Aggregated Statistics For Year 1999 (Based on 3 full and 10 partial tracts)
A) FHA, FSA/RHS & VA Home Purchase Loans
B) Conventional Home Purchase Loans
C) Refinancings
D) Home Improvement Loans
E) Loans on Dwellings For 5+ Families
F) Non-occupant Loans on < 5 Family Dwellings (A B C & D)
2007 - 2018 National Fire Incident Reporting System (NFIRS) incidents
Based on the data from the years 2007 - 2018 the average number of fires per year is 120. The highest number of fires - 160 took place in 2008, and the least - 91 in 2016. The data has a decreasing trend.
When looking into fire subcategories, the most incidents belonged to: Structure Fires (54.9%), and Outside Fires (27.5%).
Fire incident types reported to NFIRS in Zip Code 55404
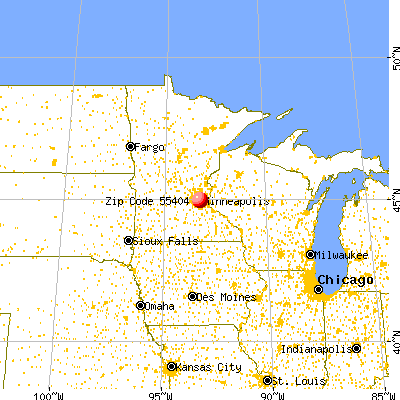


 Nearest zip codes: 55415, 55402, 55401, 55403, 55454, 55407.


 Based on the data from the years 2007 - 2018 the average number of fires per year is 120. The highest number of fires - 160 took place in 2008, and the least - 91 in 2016. The data has a decreasing trend.
 When looking into fire subcategories, the most incidents belonged to: Structure Fires (54.9%), and Outside Fires (27.5%).