Estimated zip code population in 2022: 1,565 Zip code population in 2010: 2,002 Zip code population in 2000: 2,349
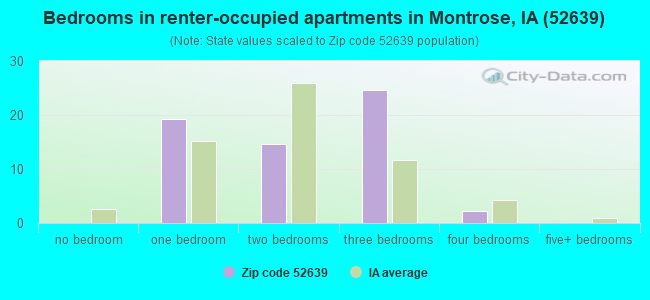
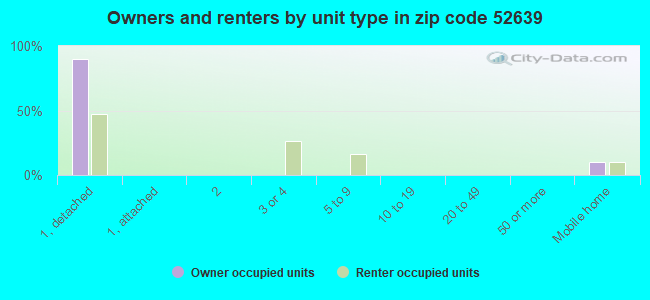
Houses and condos: 787 Renter-occupied apartments: 61
% of renters here:
9%
State:
28%
March 2022 cost of living index in zip code 52639: 82.5 (low, U.S. average is 100)
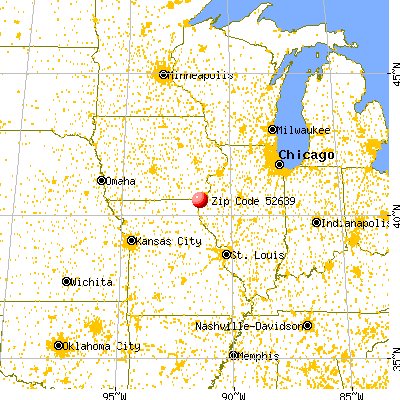
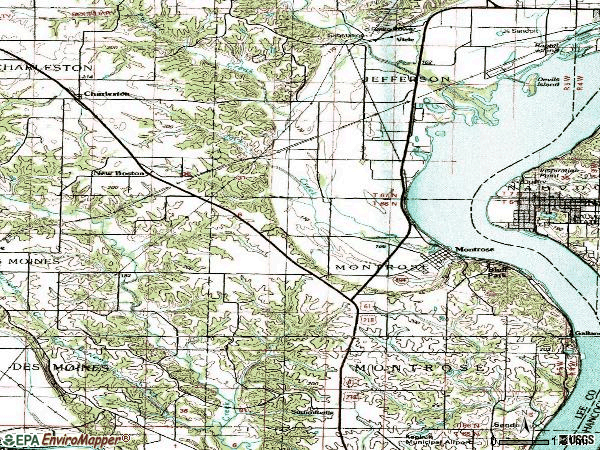
Land area: 38.2 sq. mi. Water area: 7.1 sq. mi.
Population density: 41 people per square mile
(very low).
OSM Map
General Map
Google Map
MSN Map
OSM Map
General Map
Google Map
MSN Map
OSM Map
General Map
Google Map
MSN Map
OSM Map
General Map
Google Map
MSN Map
Please wait while loading the map...
Real estate property taxes paid for housing units in 2022:
This zip code:
1.0% ($1,459)
Iowa:
1.4% ($2,724)
Median real estate property taxes paid for housing units with mortgages in 2022: $1,678 (1.0%) Median real estate property taxes paid for housing units with no mortgage in 2022: $1,191 (0.9%)
Business Search- 14 Million verified businesses
Males: 840
(53.7%)
Females: 725
(46.3%)
For population 25 years and over in 52639:
High school or higher: 95.8%
Bachelor's degree or higher: 12.7%
Graduate or professional degree: 5.3%
Unemployed: 0.8%
Mean travel time to work (commute): 21.5 minutes
For population 15 years and over in 52639:
Never married: 15.6%
Now married: 62.0%
Separated: 0.0%
Widowed: 11.2%
Divorced: 11.2%
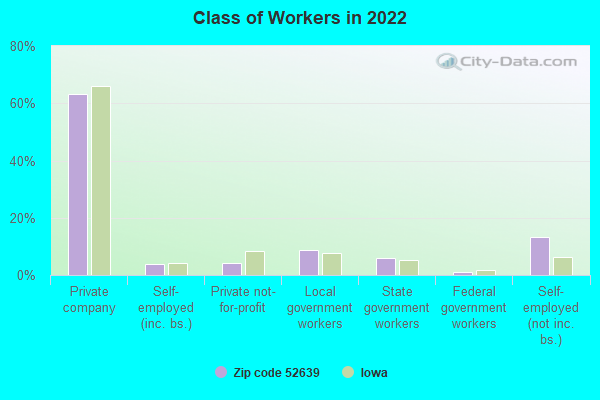
Zip code 52639 compared to state average:
Unemployed percentage significantly below state average.
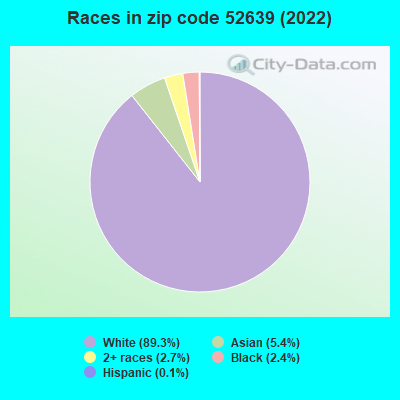
Hispanic race population percentage significantly below state average.
Median age significantly above state average.
Renting percentage significantly below state average.
Length of stay since moving in significantly above state average.
Number of college students significantly below state average.
Percentage of population with a bachelor's degree or higher below state average.
Averages for the 2020 tax year for zip code 52639, filed in 2021:
Average Adjusted Gross Income (AGI) in 2020: $55,935 (Individual Income Tax Returns)
Here:
$55,935
State:
$71,087
Salary/wage: $50,424 (reported on 81.0% of returns)
Here:
$50,424
State:
$57,361
(% of AGI for various income ranges: 988.9% for AGIs below $25k, 3520.6% for AGIs $25k-50k, 5853.1% for AGIs $50k-75k, 9415.0% for AGIs $75k-100k, 16897.5% for AGIs $100k-200k)
Taxable interest for individuals: $666 (reported on 41.7% of returns)
This zip code:
$666
Iowa:
$1,633
(% of AGI for various income ranges: 17.4% for AGIs below $25k, 35.0% for AGIs $25k-50k, 31.5% for AGIs $50k-75k, 25.0% for AGIs $75k-100k, 110.0% for AGIs $100k-200k)
Ordinary dividends: $2,041 (reported on 20.2% of returns)
Here:
$2,041
State:
$5,432
(% of AGI for various income ranges: 17.4% for AGIs below $25k, 65.0% for AGIs $25k-50k, 31.5% for AGIs $50k-75k, 78.3% for AGIs $75k-100k, 152.5% for AGIs $100k-200k)
Net capital gain/loss in AGI: +$8,807 (reported on 16.7% of returns)
Here:
+$8,807
State:
+$15,243
(% of AGI for various income ranges: 13.8% for AGIs $25k-50k, 130.0% for AGIs $50k-75k, 1311.2% for AGIs $100k-200k)
Profit/loss from business: +$3,573 (reported on 13.1% of returns)
Here:
+$3,573
State:
+$11,763
(% of AGI for various income ranges: 61.6% for AGIs below $25k, 99.4% for AGIs $25k-50k, 195.0% for AGIs $75k-100k)
Taxable individual retirement arrangement distribution: $12,177 (reported on 15.5% of returns)
52639:
$12,177
Iowa:
$17,324
(% of AGI for various income ranges: 69.5% for AGIs below $25k, 148.8% for AGIs $25k-50k, 580.0% for AGIs $50k-75k, 573.8% for AGIs $100k-200k)
Taxes paid: $6,200 (reported on 2.4% of returns)
52639:
$6,200
State:
$7,704
(% of AGI for various income ranges: 65.3% for AGIs below $25k)
Earned income credit: $2,320 (reported on 11.9% of returns)
Here:
$2,320
State:
$2,195
(% of AGI for various income ranges: 85.8% for AGIs below $25k, 43.1% for AGIs $25k-50k)
Percentage of individuals using paid preparers for their 2020 taxes: 98.8%
Here:
99%
State:
95%
(% for various income ranges: 96.0% for AGIs below $25k, 100.0% for AGIs $25k-50k, 100.0% for AGIs $50k-75k, 100.0% for AGIs $75k-100k, 100.0% for AGIs $100k-200k)
Averages for the 2012 tax year for zip code 52639, filed in 2013:
Average Adjusted Gross Income (AGI) in 2012: $43,243 (Individual Income Tax Returns)
Here:
$43,243
State:
$58,860
Salary/wage: $41,046 (reported on 82.2% of returns)
Here:
$41,046
State:
$46,659
(% of AGI for various income ranges: 74.7% for AGIs below $25k, 78.2% for AGIs $25k-50k, 78.3% for AGIs $50k-75k, 77.0% for AGIs $75k-100k, 80.3% for AGIs $100k-200k)
Taxable interest for individuals: $732 (reported on 42.2% of returns)
This zip code:
$732
Iowa:
$1,537
(% of AGI for various income ranges: 1.4% for AGIs below $25k, 0.5% for AGIs $25k-50k, 0.9% for AGIs $50k-75k, 0.7% for AGIs $75k-100k, 0.3% for AGIs $100k-200k)
Ordinary dividends: $1,629 (reported on 18.9% of returns)
Here:
$1,629
State:
$4,542
(% of AGI for various income ranges: 1.5% for AGIs below $25k, 0.4% for AGIs $25k-50k, 0.9% for AGIs $50k-75k, 0.8% for AGIs $75k-100k, 0.3% for AGIs $100k-200k)
Net capital gain/loss in AGI: +$3,980 (reported on 11.1% of returns)
Here:
+$3,980
State:
+$11,802
(% of AGI for various income ranges: 1.8% for AGIs $25k-50k, 0.3% for AGIs $50k-75k, 2.8% for AGIs $75k-100k)
Profit/loss from business: +$3,409 (reported on 12.2% of returns)
Here:
+$3,409
State:
+$10,509
(% of AGI for various income ranges: 1.7% for AGIs below $25k, 2.8% for AGIs $25k-50k, 1.1% for AGIs $75k-100k)
Taxable individual retirement arrangement distribution: $9,036 (reported on 12.2% of returns)
52639:
$9,036
Iowa:
$11,773
(% of AGI for various income ranges: 4.1% for AGIs below $25k, 5.1% for AGIs $25k-50k, 5.2% for AGIs $75k-100k)
Total itemized deductions: $16,144 (22% of AGI, reported on 17.8% of returns)
Here:
$16,144
State:
$21,278
Here:
22.4% of AGI
State:
18.9% of AGI
(% of AGI for various income ranges: 8.2% for AGIs $25k-50k, 5.6% for AGIs $50k-75k, 5.4% for AGIs $75k-100k, 11.2% for AGIs $100k-200k)
Charity contributions: $2,945 (reported on 12.2% of returns)
Here:
$2,945
State:
$4,044
(% of AGI for various income ranges: 1.6% for AGIs below $25k, 1.5% for AGIs $50k-75k, 1.2% for AGIs $100k-200k)
Taxes paid: $5,350 (reported on 17.8% of returns)
52639:
$5,350
State:
$8,846
(% of AGI for various income ranges: 1.8% for AGIs $25k-50k, 1.5% for AGIs $50k-75k, 2.0% for AGIs $75k-100k, 4.8% for AGIs $100k-200k)
Earned income credit: $1,929 (reported on 15.6% of returns)
Here:
$1,929
State:
$2,098
(% of AGI for various income ranges: 4.8% for AGIs below $25k, 0.8% for AGIs $25k-50k)
Percentage of individuals using paid preparers for their 2012 taxes: 73.3%
Here:
73%
State:
65%
(% for various income ranges: 62.9% for AGIs below $25k, 76.2% for AGIs $25k-50k, 82.4% for AGIs $50k-75k, 80.0% for AGIs $75k-100k, 85.7% for AGIs $100k-200k)
Averages for the 2004 tax year for zip code 52639, filed in 2005:
Average Adjusted Gross Income (AGI) in 2004: $36,827 (Individual Income Tax Returns)
Here:
$36,827
State:
$43,875
Salary/wage: $36,142 (reported on 85.7% of returns)
Here:
$36,142
State:
$38,265
(% of AGI for various income ranges: 121.5% for AGIs below $10k, 73.5% for AGIs $10k-25k, 80.8% for AGIs $25k-50k, 87.3% for AGIs $50k-75k, 91.7% for AGIs $75k-100k, 74.9% for AGIs over 100k)
Taxable interest for individuals: $889 (reported on 50.0% of returns)
This zip code:
$889
Iowa:
$1,768
(% of AGI for various income ranges: 10.9% for AGIs below $10k, 3.4% for AGIs $10k-25k, 1.6% for AGIs $25k-50k, 0.4% for AGIs $50k-75k, 0.2% for AGIs $75k-100k, 0.3% for AGIs over 100k)
Taxable dividends: $1,287 (reported on 22.0% of returns)
Here:
$1,287
State:
$2,510
(% of AGI for various income ranges: 0.7% for AGIs below $10k, 1.5% for AGIs $10k-25k, 0.4% for AGIs $25k-50k, 1.0% for AGIs $50k-75k, 0.3% for AGIs $75k-100k, 1.2% for AGIs over 100k)
Net capital gain/loss: +$2,462 (reported on 14.7% of returns)
Here:
+$2,462
State:
+$6,139
(% of AGI for various income ranges: 1.6% for AGIs below $10k, -0.3% for AGIs $10k-25k, 0.1% for AGIs $25k-50k, 0.2% for AGIs $50k-75k, 1.2% for AGIs $75k-100k, 6.5% for AGIs over 100k)
Profit/loss from business: +$1,244 (reported on 15.2% of returns)
Here:
+$1,244
State:
+$8,574
(% of AGI for various income ranges: 4.8% for AGIs below $10k, 0.5% for AGIs $10k-25k, 1.2% for AGIs $25k-50k, 0.8% for AGIs $50k-75k, -1.3% for AGIs $75k-100k)
IRA payment deduction: $3,111 (reported on 2.0% of returns)
52639:
$3,111
Iowa:
$2,970
Total itemized deductions: $14,120 (23% of AGI, reported on 20.7% of returns)
Here:
$14,120
State:
$16,976
Here:
22.5% of AGI
State:
20.8% of AGI
(% of AGI for various income ranges: 17.4% for AGIs below $10k, 7.8% for AGIs $10k-25k, 5.5% for AGIs $25k-50k, 7.1% for AGIs $50k-75k, 9.1% for AGIs $75k-100k, 13.3% for AGIs over 100k)
Charity contributions deductions: $2,021 (3% of AGI, reported on 16.0% of returns)
Here:
$2,021
State:
$3,089
Here:
3.1% of AGI
State:
3.6% of AGI
(% of AGI for various income ranges: 0.6% for AGIs $10k-25k, 0.5% for AGIs $25k-50k, 1.2% for AGIs $50k-75k, 0.8% for AGIs $75k-100k, 1.4% for AGIs over 100k)
Total tax: $4,090 (reported on 76.4% of returns)
52639:
$4,090
State:
$6,177
(% of AGI for various income ranges: 2.5% for AGIs below $10k, 3.4% for AGIs $10k-25k, 7.1% for AGIs $25k-50k, 8.2% for AGIs $50k-75k, 10.4% for AGIs $75k-100k, 15.5% for AGIs over 100k)
Earned income credit: $1,612 (reported on 13.1% of returns)
Here:
$1,612
State:
$1,540
Percentage of individuals using paid preparers for their 2004 taxes: 79.9%
Here:
80%
State:
70%
(% for various income ranges: 68.6% for AGIs below $10k, 81.8% for AGIs $10k-25k, 83.7% for AGIs $25k-50k, 81.4% for AGIs $50k-75k, 90.9% for AGIs $75k-100k, 72.0% for AGIs over 100k)
Household received Food Stamps/SNAP in the past 12 months: 54 Household did not receive Food Stamps/SNAP in the past 12 months: 664
Women who had a birth in the past 12 months: 5 (2 now married, 2 unmarried) Women who did not have a birth in the past 12 months: 209 (138 now married, 70 unmarried)
Housing units in zip code 52639 with a mortgage: 329 (58 second mortgage, 51 both second mortgage and home equity loan) Houses without a mortgage: 15
Median monthly owner costs for units with a mortgage: $1,204 Median monthly owner costs for units without a mortgage: $482
Residents with income below the poverty level in 2022:
This zip code:
8.3%
Whole state:
11.0%
Residents with income below 50% of the poverty level in 2022:
This zip code:
4.3%
Whole state:
5.5%
Median number of rooms in houses and condos:
Here:
6.3
State:
6.8
Median number of rooms in apartments:
Here:
4.8
State:
4.2
Notable locations in this zip code not listed on our city pages
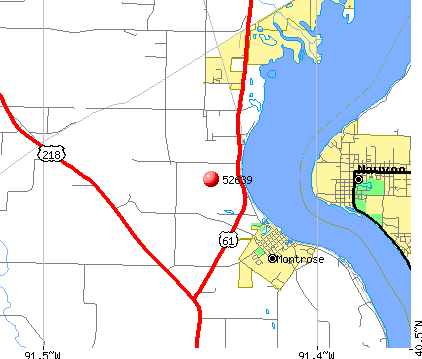
Notable locations in zip code 52639: Linger Longer Rest Area (A), Montrose Elevator (B), Montrose City Hall (C), Montrose Police Department (D), Montrose Memorial Library (E), Montrose Fire and Rescue (F). Display/hide their locations on the map
Churches in zip code 52639 include: Church of the Nazarene (A), Montrose Presbyterian Church (B), Saint Joseph Catholic Church (C), United Methodist Church (D), Saint Barnabas Episcopal Church (E). Display/hide their locations on the map
Cemeteries: Sandinavian Cemetery (1), Ambrosia Cemetery (2), Scandinavian Cemetery (3), Galland Cemetery (4), F Simonin Grounds Cemetery (5), Boyd and Peevler Cemetery (6), Indian Princess Grave (7). Display/hide their locations on the map
Parks in zip code 52639 include: Riverview Park (1), Galland School State Park Preserve (2), Grave of Kalawequois Historical Marker (3), Cato Mead Historical Marker (4), Dragoon Trail Historical Marker (5), Galland School Historical Marker (6). Display/hide their locations on the map
In group quarters: 98 (-1 institutionalized population)
Size of family households: 332 2-persons, 85 3-persons, 30 4-persons, 30 5-persons, 1 6-persons, 5 7-or-more-persons
Size of nonfamily households: 218 1-person, 18 2-persons
118 married couples with children.
44 single-parent households (13 men, 31 women).
95.2% of residents of 52639 zip code speak English at home.
0.1% of residents speak Spanish at home (100% very well).
5.3% of residents speak Asian or Pacific Island language at home (100% very well).
0.1% of residents speak other language at home (100% very well).
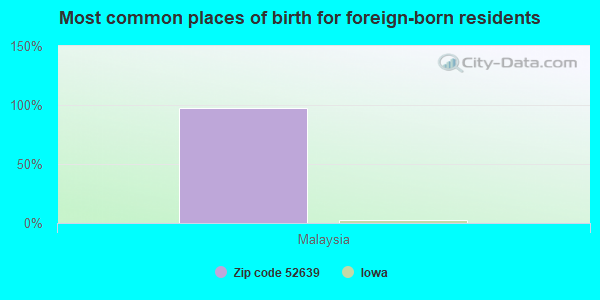
Foreign born population: 78 (5.0%) (97.3% of them are naturalized citizens)
This zip code:
5.0%
Whole state:
6.0%
97%Malaysia
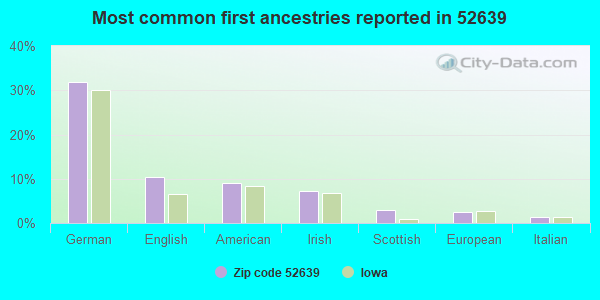
32%German
10%English
9%American
7%Irish
3%Scottish
2%European
1%Italian
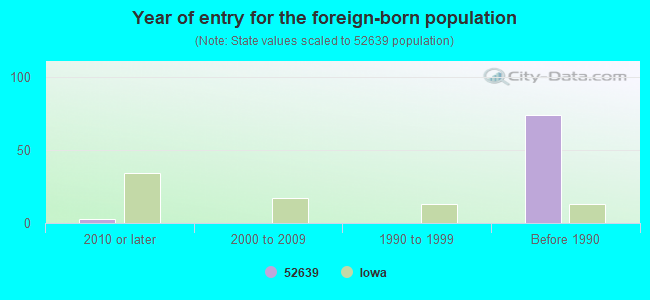
Year of entry for the foreign-born population
32010 or later
02000 to 2009
01990 to 1999
74Before 1990
Facilities with environmental interests located in this zip code:
SINCLAIR PIPE LINE COMPANY (2506 260TH STREET in MONTROSE, IA)
AIR SYNTHETIC MINOR (AIRS/AFS) OIL CONTROL (Facility Response Plan for oil discharge) National Pollutant Discharge Elimination System NON-MAJOR (Tracking pollutant discharge elimination systems) - permit (Resource Conservation and Recovery Act (tracking hazardous waste)) TRI REPORTER (Tracking of toxic chemicals releasing facilities) Business SIC classification: REFINED PETROLEUM PIPELINES; PETROLEUM BULK STATIONS AND TERMINALS Organizations: SINCLAIR OIL CORPORATION (CONTACT/OPERATOR)
, SINCLAIR PIPELINE CO. (CONTACT/OWNER)
Alternative names: MONTROSE PRODS. TERMINAL - SINCLAIR OIL CORP., SINCLAIR OIL CORPORATION , SINCLAIR OIL CORP. MONTROSE PRODS. TERMINAL, SINCLAIR PIPELINE CO.-BLANKET, SINCLAIR PRODUCT TERMINAL
MONTROSE ELEVATOR INC (203 NORTH 1ST in MONTROSE, IA)
COMPLIANCE ACTIVITY (Tracking inspections of insecticide, fungicide, and rodenticide, and toxic substances)
MONTROSE CITY OF STP (102 SOUTH 2ND STREET in MONTROSE, IA)
National Pollutant Discharge Elimination System NON-MAJOR (Tracking pollutant discharge elimination systems) - permit Business SIC classification: SEWERAGE SYSTEMS Organizations: CITY OF MONTROSE (CONTACT/OWNER)
TWEEDY AUTO BODY (RR 1 in MONTROSE, IA)
(Resource Conservation and Recovery Act (tracking hazardous waste)) Business NAICS classification: AUTOMOTIVE BODY, PAINT, AND INTERIOR REPAIR AND MAINTENANCE.
CHUCK FRAZIER (SW 1/4, SECTION 12, TOWNSHIP 66N, RANGE 5W in MONTROSE (ONE MILE SOUTH), IA)
NAVIGABLE WATERS (STATE)
Housing units lacking complete plumbing facilities: 1.1% Housing units lacking complete kitchen facilities: 0.7%
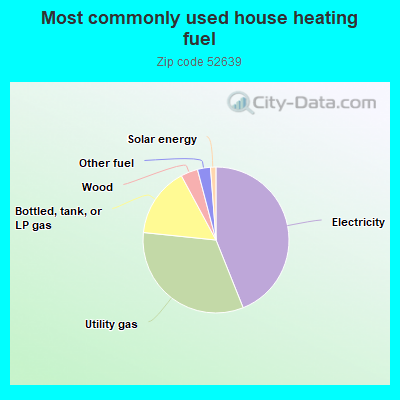
44.2%Electricity
32.9%Utility gas
15.6%Bottled, tank, or LP gas
3.8%Wood
2.9%Other fuel
1.2%Solar energy
Population in 1990: 1,857. Population change in the 1990s: +492 (+26.5%).
Place of birth for U.S.-born residents:
This state: 1,032
Northeast: 16
Midwest: 289
South: 98
West: 39
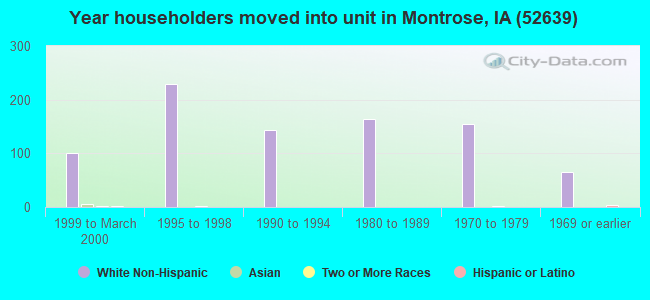
59% of the 52639 zip code residents lived in the same house 5 years ago. Out of people who lived in different houses, 62% lived in this county. Out of people who lived in different counties, 50% lived in Iowa.
97% of the 52639 zip code residents lived in the same house 1 year ago. Out of people who lived in different houses, 86% moved from this county. Out of people who lived in different houses, 16% moved from different county within same state. Out of people who lived in different houses, 3% moved from different state.
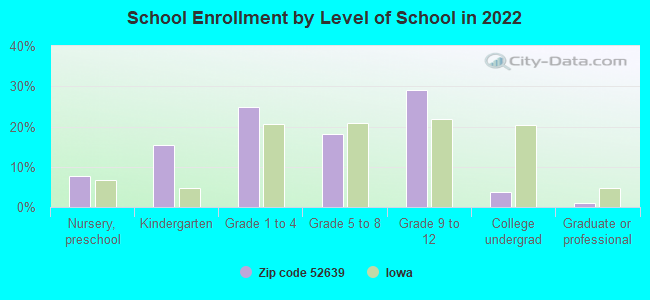
Private vs. public school enrollment:
Students in private schools in grades 1 to 8 (elementary and middle school): 18
Here:
23.6%
Iowa:
10.6%
Students in private schools in grades 9 to 12 (high school): 14
Here:
26.5%
Iowa:
7.9%
Students in private undergraduate colleges: 2
Here:
34.6%
Iowa:
23.9%
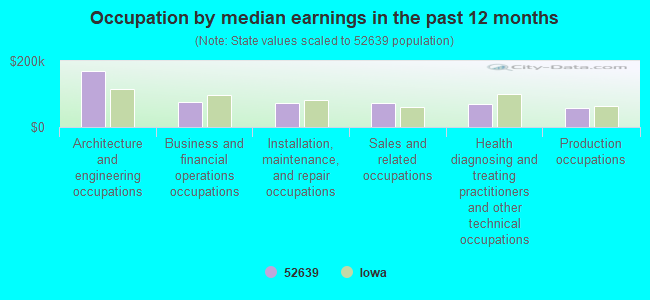
Occupation by median earnings in the past 12 months ($)
170,297Architecture and engineering occupations
76,275Business and financial operations occupations
72,746Installation, maintenance, and repair occupations
72,236Sales and related occupations
70,470Health diagnosing and treating practitioners and other technical occupations
57,776Production occupations
Top industries in this zip code by the number of employees in 2005:
Health Care and Social Assistance: Nursing Care Facilities (50-99 employees: 1 establishment)
Health Care and Social Assistance: Vocational Rehabilitation Services (20-49: 1)
Accommodation and Food Services: Full-Service Restaurants (10-19: 1, 1-4: 1)
Educational Services: Fine Arts Schools (10-19: 1)
Other Services (except Public Administration): Automotive Body, Paint, and Interior Repair and Maintenance (5-9: 1, 1-4: 1)
Accommodation and Food Services: Drinking Places (Alcoholic Beverages) (5-9: 1)
Accommodation and Food Services: Caterers (5-9: 1)
Health Care and Social Assistance: Other Residential Care Facilities (5-9: 1)
People in group quarters in 2010:
47 people in nursing facilities/skilled-nursing facilities
26 people in local jails and other municipal confinement facilities
8 people in correctional facilities intended for juveniles
People in group quarters in 2000:
76 people in state prisons
46 people in nursing homes
45 people in local jails and other confinement facilities (including police lockups)
18 people in short-term care, detention or diagnostic centers for delinquent children
15 people in residential treatment centers for emotionally disturbed children
Fatal accident statistics in 2014:
Fatal accident count: 1
Vehicles involved in fatal accidents: 2
Fatal accidents caused by drunken drivers: 0
Fatalities: 1
Persons involved in fatal accidents: 3
Pedestrians involved in fatal accidents: 0
Fatal accident statistics in 2013:
Fatal accident count: 1
Vehicles involved in fatal accidents: 1
Fatal accidents caused by drunken drivers: 1
Fatalities: 1
Persons involved in fatal accidents: 1
Pedestrians involved in fatal accidents: 0
2002 - 2018 National Fire Incident Reporting System (NFIRS) incidents
According to the data from the years 2002 - 2018 the average number of fires per year is 11. The highest number of fire incidents - 37 took place in 2012, and the least - 0 in 2006. The data has a constant trend.
When looking into fire subcategories, the most incidents belonged to: Outside Fires (43.6%), and Structure Fires (38.7%).
Fire incident types reported to NFIRS in Zip Code 52639


 Nearest zip codes: 52632, 52619, 62354, 63430, 52625, 63472.


 According to the data from the years 2002 - 2018 the average number of fires per year is 11. The highest number of fire incidents - 37 took place in 2012, and the least - 0 in 2006. The data has a constant trend.
 When looking into fire subcategories, the most incidents belonged to: Outside Fires (43.6%), and Structure Fires (38.7%).