Estimated zip code population in 2022: 3,632 Zip code population in 2010: 3,098 Zip code population in 2000: 2,947
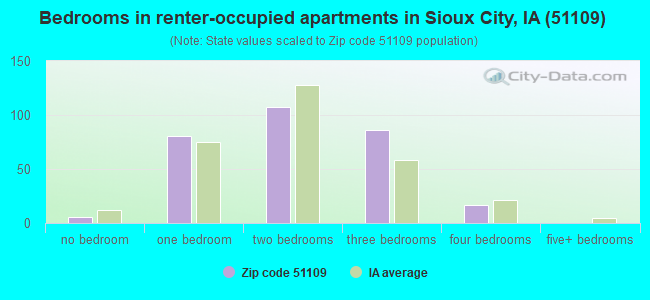
Houses and condos: 1,610 Renter-occupied apartments: 299
% of renters here:
19%
State:
28%
March 2022 cost of living index in zip code 51109: 76.5 (low, U.S. average is 100)
Land area: 18.1 sq. mi. Water area: 0.8 sq. mi.
Population density: 200 people per square mile
(very low).
OSM Map
General Map
Google Map
MSN Map
OSM Map
General Map
Google Map
MSN Map
OSM Map
General Map
Google Map
MSN Map
OSM Map
General Map
Google Map
MSN Map
Please wait while loading the map...
Real estate property taxes paid for housing units in 2022:
This zip code:
1.7% ($2,330)
Iowa:
1.4% ($2,724)
Median real estate property taxes paid for housing units with mortgages in 2022: $2,481 (1.6%) Median real estate property taxes paid for housing units with no mortgage in 2022: $2,120 (2.0%)
Business Search- 14 Million verified businesses
Males: 1,812
(49.9%)
Females: 1,819
(50.1%)
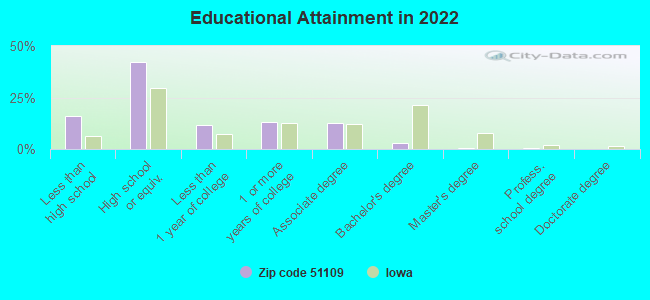
For population 25 years and over in 51109:
High school or higher: 82.2%
Bachelor's degree or higher: 4.2%
Graduate or professional degree: 1.4%
Unemployed: 1.9%
Mean travel time to work (commute): 13.6 minutes
For population 15 years and over in 51109:
Never married: 32.6%
Now married: 45.4%
Separated: 1.8%
Widowed: 5.9%
Divorced: 14.4%
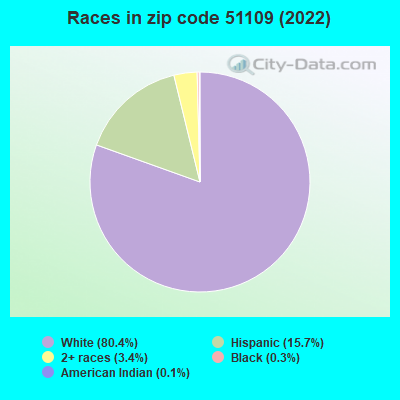
Zip code 51109 compared to state average:
Black race population percentage significantly below state average.
Hispanic race population percentage above state average.
Median age above state average.
Foreign-born population percentage below state average.
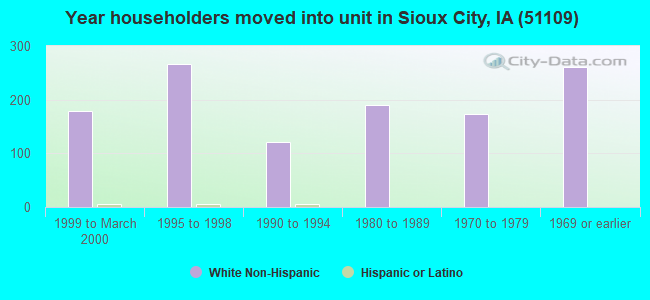
Length of stay since moving in significantly above state average.
Percentage of population with a bachelor's degree or higher significantly below state average.
Averages for the 2020 tax year for zip code 51109, filed in 2021:
Average Adjusted Gross Income (AGI) in 2020: $48,155 (Individual Income Tax Returns)
Here:
$48,155
State:
$71,087
Salary/wage: $42,611 (reported on 87.3% of returns)
Here:
$42,611
State:
$57,361
(% of AGI for various income ranges: 1148.5% for AGIs below $25k, 3464.7% for AGIs $25k-50k, 6464.7% for AGIs $50k-75k, 9904.4% for AGIs $75k-100k, 16748.0% for AGIs $100k-200k)
Taxable interest for individuals: $619 (reported on 24.7% of returns)
This zip code:
$619
Iowa:
$1,633
(% of AGI for various income ranges: 15.1% for AGIs below $25k, 13.2% for AGIs $25k-50k, 19.5% for AGIs $50k-75k, 12.2% for AGIs $75k-100k, 69.0% for AGIs $100k-200k)
Ordinary dividends: $1,777 (reported on 8.7% of returns)
Here:
$1,777
State:
$5,432
(% of AGI for various income ranges: 9.3% for AGIs below $25k, 14.7% for AGIs $25k-50k, 26.8% for AGIs $50k-75k, 86.0% for AGIs $100k-200k)
Net capital gain/loss in AGI: +$4,909 (reported on 7.3% of returns)
Here:
+$4,909
State:
+$15,243
(% of AGI for various income ranges: 2.4% for AGIs below $25k, 15.0% for AGIs $25k-50k, 134.2% for AGIs $50k-75k, 218.0% for AGIs $100k-200k)
Profit/loss from business: +$9,071 (reported on 11.3% of returns)
Here:
+$9,071
State:
+$11,763
(% of AGI for various income ranges: 63.7% for AGIs below $25k, 120.5% for AGIs $25k-50k, 218.9% for AGIs $50k-75k, 407.0% for AGIs $100k-200k)
Taxable individual retirement arrangement distribution: $10,894 (reported on 10.7% of returns)
51109:
$10,894
Iowa:
$17,324
(% of AGI for various income ranges: 69.0% for AGIs below $25k, 91.8% for AGIs $25k-50k, 293.7% for AGIs $50k-75k, 553.0% for AGIs $100k-200k)
Total itemized deductions: $28,200 (reported on 1.3% of returns)
Here:
$28,200
State:
$33,775
(% of AGI for various income ranges: 148.4% for AGIs $25k-50k)
Taxes paid: $6,000 (reported on 2.0% of returns)
51109:
$6,000
State:
$7,704
(% of AGI for various income ranges: 94.7% for AGIs $50k-75k)
Earned income credit: $2,237 (reported on 20.0% of returns)
Here:
$2,237
State:
$2,195
(% of AGI for various income ranges: 93.4% for AGIs below $25k, 75.8% for AGIs $25k-50k)
Percentage of individuals using paid preparers for their 2020 taxes: 96.0%
Here:
96%
State:
95%
(% for various income ranges: 94.3% for AGIs below $25k, 97.8% for AGIs $25k-50k, 95.8% for AGIs $50k-75k, 100.0% for AGIs $75k-100k, 93.8% for AGIs $100k-200k)
Averages for the 2012 tax year for zip code 51109, filed in 2013:
Average Adjusted Gross Income (AGI) in 2012: $40,206 (Individual Income Tax Returns)
Here:
$40,206
State:
$58,860
Salary/wage: $35,163 (reported on 89.7% of returns)
Here:
$35,163
State:
$46,659
(% of AGI for various income ranges: 80.8% for AGIs below $25k, 86.1% for AGIs $25k-50k, 86.6% for AGIs $50k-75k, 81.7% for AGIs $75k-100k, 56.7% for AGIs $100k-200k)
Taxable interest for individuals: $506 (reported on 24.0% of returns)
This zip code:
$506
Iowa:
$1,537
(% of AGI for various income ranges: 0.9% for AGIs below $25k, 0.2% for AGIs $25k-50k, 0.1% for AGIs $50k-75k, 0.1% for AGIs $75k-100k, 0.3% for AGIs $100k-200k)
Ordinary dividends: $885 (reported on 8.9% of returns)
Here:
$885
State:
$4,542
(% of AGI for various income ranges: 0.4% for AGIs below $25k, 0.1% for AGIs $25k-50k, 0.3% for AGIs $75k-100k, 0.2% for AGIs $100k-200k)
Net capital gain/loss in AGI: +$4,122 (reported on 6.2% of returns)
Here:
+$4,122
State:
+$11,802
(% of AGI for various income ranges: 0.7% for AGIs below $25k, 0.2% for AGIs $50k-75k, 2.3% for AGIs $100k-200k)
Profit/loss from business: +$6,000 (reported on 11.0% of returns)
Here:
+$6,000
State:
+$10,509
(% of AGI for various income ranges: 2.5% for AGIs below $25k, 2.8% for AGIs $25k-50k, 0.9% for AGIs $50k-75k, 2.3% for AGIs $75k-100k)
Taxable individual retirement arrangement distribution: $9,471 (reported on 9.6% of returns)
51109:
$9,471
Iowa:
$11,773
(% of AGI for various income ranges: 2.3% for AGIs below $25k, 1.9% for AGIs $25k-50k, 1.5% for AGIs $50k-75k, 6.5% for AGIs $75k-100k)
Total itemized deductions: $15,673 (20% of AGI, reported on 17.8% of returns)
Here:
$15,673
State:
$21,278
Here:
20.2% of AGI
State:
18.9% of AGI
(% of AGI for various income ranges: 5.6% for AGIs below $25k, 5.6% for AGIs $25k-50k, 6.7% for AGIs $50k-75k, 7.3% for AGIs $75k-100k, 9.3% for AGIs $100k-200k)
Charity contributions: $2,263 (reported on 13.0% of returns)
Here:
$2,263
State:
$4,044
(% of AGI for various income ranges: 0.6% for AGIs below $25k, 0.5% for AGIs $25k-50k, 0.7% for AGIs $50k-75k, 0.7% for AGIs $75k-100k, 1.2% for AGIs $100k-200k)
Taxes paid: $5,578 (reported on 18.5% of returns)
51109:
$5,578
State:
$8,846
(% of AGI for various income ranges: 0.8% for AGIs below $25k, 1.6% for AGIs $25k-50k, 2.1% for AGIs $50k-75k, 2.7% for AGIs $75k-100k, 5.2% for AGIs $100k-200k)
Earned income credit: $2,410 (reported on 20.5% of returns)
Here:
$2,410
State:
$2,098
(% of AGI for various income ranges: 6.9% for AGIs below $25k, 1.0% for AGIs $25k-50k)
Percentage of individuals using paid preparers for their 2012 taxes: 69.9%
Here:
70%
State:
65%
(% for various income ranges: 60.9% for AGIs below $25k, 72.5% for AGIs $25k-50k, 81.8% for AGIs $50k-75k, 83.3% for AGIs $75k-100k, 75.0% for AGIs $100k-200k)
Averages for the 2004 tax year for zip code 51109, filed in 2005:
Average Adjusted Gross Income (AGI) in 2004: $33,608 (Individual Income Tax Returns)
Here:
$33,608
State:
$43,875
Salary/wage: $32,200 (reported on 90.3% of returns)
Here:
$32,200
State:
$38,265
(% of AGI for various income ranges: 96.2% for AGIs below $10k, 80.9% for AGIs $10k-25k, 86.6% for AGIs $25k-50k, 87.2% for AGIs $50k-75k, 89.3% for AGIs $75k-100k, 86.2% for AGIs over 100k)
Taxable interest for individuals: $722 (reported on 33.7% of returns)
This zip code:
$722
Iowa:
$1,768
(% of AGI for various income ranges: 2.0% for AGIs below $10k, 1.6% for AGIs $10k-25k, 0.8% for AGIs $25k-50k, 0.4% for AGIs $50k-75k, 0.4% for AGIs $75k-100k, 0.1% for AGIs over 100k)
Taxable dividends: $833 (reported on 13.1% of returns)
Here:
$833
State:
$2,510
(% of AGI for various income ranges: 0.6% for AGIs below $10k, 0.5% for AGIs $10k-25k, 0.4% for AGIs $25k-50k, 0.1% for AGIs $50k-75k, 0.2% for AGIs $75k-100k, 0.5% for AGIs over 100k)
Net capital gain/loss: +$602 (reported on 10.0% of returns)
Here:
+$602
State:
+$6,139
(% of AGI for various income ranges: 0.6% for AGIs below $10k, 0.3% for AGIs $10k-25k, -0.0% for AGIs $25k-50k, -0.0% for AGIs $50k-75k, 0.3% for AGIs $75k-100k, 0.7% for AGIs over 100k)
Profit/loss from business: +$4,894 (reported on 13.4% of returns)
Here:
+$4,894
State:
+$8,574
(% of AGI for various income ranges: 0.6% for AGIs below $10k, 4.2% for AGIs $10k-25k, 1.9% for AGIs $25k-50k, 2.5% for AGIs $50k-75k, 0.6% for AGIs $75k-100k, -0.3% for AGIs over 100k)
IRA payment deduction: $1,742 (reported on 2.3% of returns)
51109:
$1,742
Iowa:
$2,970
Total itemized deductions: $13,182 (21% of AGI, reported on 21.5% of returns)
Here:
$13,182
State:
$16,976
Here:
21.5% of AGI
State:
20.8% of AGI
(% of AGI for various income ranges: 5.6% for AGIs $10k-25k, 7.4% for AGIs $25k-50k, 8.4% for AGIs $50k-75k, 11.6% for AGIs $75k-100k, 13.8% for AGIs over 100k)
Charity contributions deductions: $1,663 (3% of AGI, reported on 18.2% of returns)
Here:
$1,663
State:
$3,089
Here:
2.6% of AGI
State:
3.6% of AGI
(% of AGI for various income ranges: 0.4% for AGIs $10k-25k, 0.7% for AGIs $25k-50k, 0.9% for AGIs $50k-75k, 1.2% for AGIs $75k-100k, 2.2% for AGIs over 100k)
Total tax: $3,407 (reported on 73.4% of returns)
51109:
$3,407
State:
$6,177
(% of AGI for various income ranges: 2.1% for AGIs below $10k, 4.0% for AGIs $10k-25k, 6.2% for AGIs $25k-50k, 8.4% for AGIs $50k-75k, 10.8% for AGIs $75k-100k, 10.6% for AGIs over 100k)
Earned income credit: $1,569 (reported on 20.2% of returns)
Here:
$1,569
State:
$1,540
Percentage of individuals using paid preparers for their 2004 taxes: 79.7%
Here:
80%
State:
70%
(% for various income ranges: 68.7% for AGIs below $10k, 80.5% for AGIs $10k-25k, 82.7% for AGIs $25k-50k, 82.7% for AGIs $50k-75k, 87.5% for AGIs $75k-100k, 90.3% for AGIs over 100k)
Likely homosexual households (counted as self-reported same-sex unmarried-partner households)
Lesbian couples: 0.0% of all households
Gay men: 0.4% of all households
Household received Food Stamps/SNAP in the past 12 months: 181 Household did not receive Food Stamps/SNAP in the past 12 months: 1,405
Women who had a birth in the past 12 months: 47 (22 now married, 24 unmarried) Women who did not have a birth in the past 12 months: 726 (230 now married, 496 unmarried)
Housing units in zip code 51109 with a mortgage: 708 (32 second mortgage) Median monthly owner costs for units with a mortgage: $1,149 Median monthly owner costs for units without a mortgage: $400
Residents with income below the poverty level in 2022:
This zip code:
14.8%
Whole state:
11.0%
Residents with income below 50% of the poverty level in 2022:
This zip code:
7.2%
Whole state:
5.5%
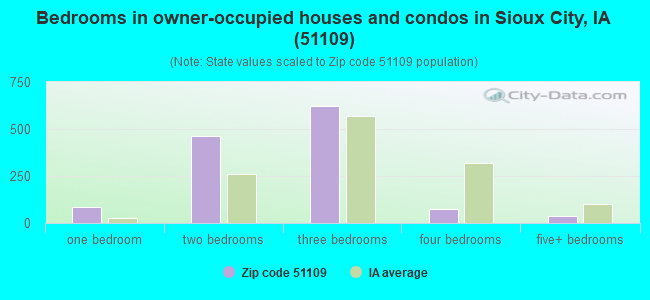
Median number of rooms in houses and condos:
Here:
5.8
State:
6.8
Median number of rooms in apartments:
Here:
4.5
State:
4.2
Notable locations in this zip code not listed on our city pages
Notable locations in zip code 51109: Siouxland Historical Railroad Association Museum-in-the-Making (A), Dorothy Pecaut Nature Center (B), Milwaukee Railroad Roundhouse Historic Site (C), Theophile Brughier Log Cabin (D). Display/hide their locations on the map
Parks in zip code 51109 include: Riverside Park (1), Sioux City's First White Settler Historical Marker (2), Stone State Park (3), Edgewater Park (4). Display/hide their locations on the map
Size of family households: 368 2-persons, 186 3-persons, 202 4-persons, 167 5-persons, 23 7-or-more-persons
Size of nonfamily households: 545 1-person, 86 2-persons, 8 3-persons
320 married couples with children.
446 single-parent households (35 men, 411 women).
89.1% of residents of 51109 zip code speak English at home.
9.1% of residents speak Spanish at home (60% very well, 25% well, 12% not well, 3% not at all).
1.8% of residents speak other Indo-European language at home (100% very well).
0.5% of residents speak other language at home (100% very well).
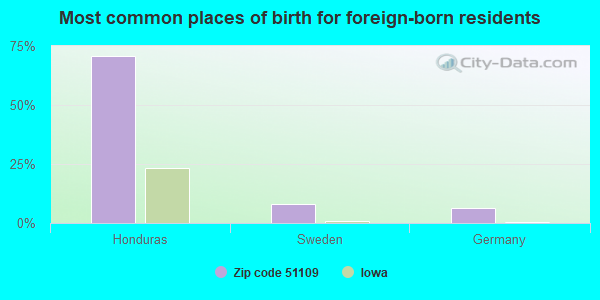
Foreign born population: 133 (3.7%) (52.1% of them are naturalized citizens)
This zip code:
3.7%
Whole state:
6.0%
71%Honduras
8%Sweden
6%Germany
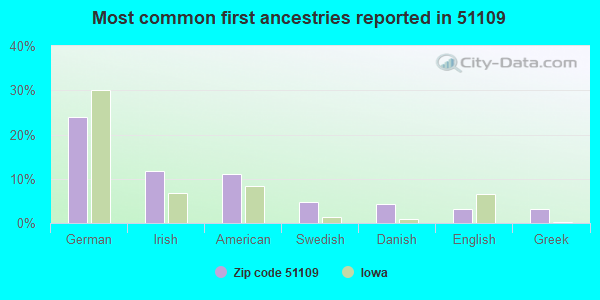
24%German
12%Irish
11%American
5%Swedish
4%Danish
3%English
3%Greek
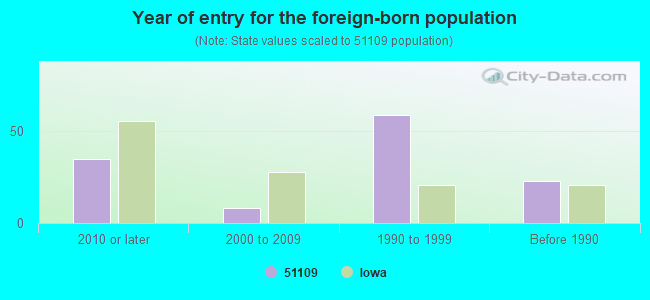
Year of entry for the foreign-born population
352010 or later
82000 to 2009
591990 to 1999
23Before 1990
Facilities with environmental interests located in this zip code:
RIVERSIDE ELEMENTARY SCHOOL (2303 RIVERSIDE BLVD in SIOUX CITY, IA)
(National Center for Education Statistics) - STATE ID-976039 580 Organizations: SIOUX CITY COMM SCHOOL DISTRICT (SCHOOL DISTRICT)
SOLAR PLASTICS INC (1658 RIVERSIDE BLVD in SIOUX CITY, IA)
(Resource Conservation and Recovery Act (tracking hazardous waste)) Business NAICS classification: ALL OTHER PLASTICS PRODUCT MANUFACTURING.
SIOUX CITY CITY OF-FORMER SITE OF (2026 RIVERSIDE BLVD in SIOUX CITY, IA)
(Resource Conservation and Recovery Act (tracking hazardous waste)) Business NAICS classification: GENERAL AUTOMOTIVE REPAIR.
Housing units lacking complete kitchen facilities: 0.8%
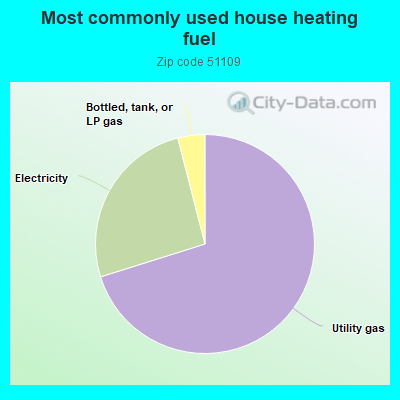
70.3%Utility gas
25.9%Electricity
4.0%Bottled, tank, or LP gas
Population in 1990: 2,592. Population change in the 1990s: +355 (+13.7%).
Place of birth for U.S.-born residents:
This state: 2,662
Northeast: 46
Midwest: 355
South: 171
West: 266
64% of the 51109 zip code residents lived in the same house 5 years ago. Out of people who lived in different houses, 61% lived in this county. Out of people who lived in different counties, 50% lived in Iowa.
94% of the 51109 zip code residents lived in the same house 1 year ago. Out of people who lived in different houses, 57% moved from this county. Out of people who lived in different houses, 27% moved from different county within same state. Out of people who lived in different houses, 18% moved from different state.
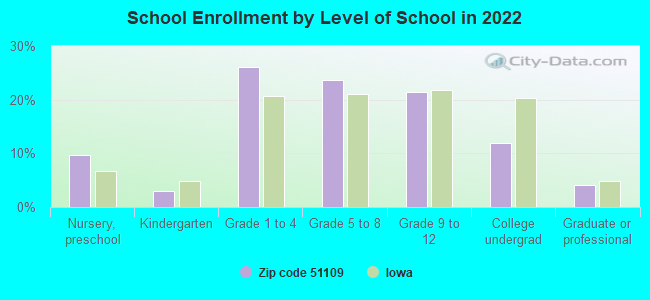
Private vs. public school enrollment:
Students in private schools in grades 1 to 8 (elementary and middle school): 75
Here:
17.6%
Iowa:
10.6%
Students in private schools in grades 9 to 12 (high school):
Here:
0.0%
Iowa:
7.9%
Students in private undergraduate colleges: 17
Here:
16.8%
Iowa:
23.9%
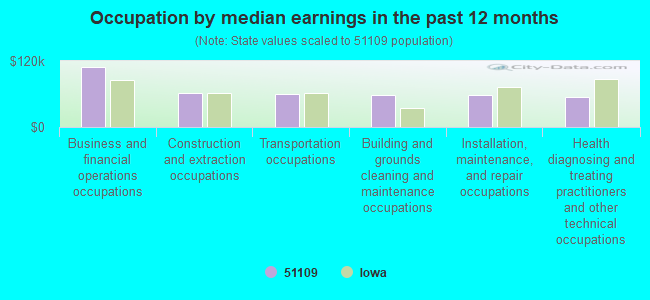
Occupation by median earnings in the past 12 months ($)
109,615Business and financial operations occupations
61,553Construction and extraction occupations
60,708Transportation occupations
58,498Building and grounds cleaning and maintenance occupations
57,944Installation, maintenance, and repair occupations
54,625Health diagnosing and treating practitioners and other technical occupations
Companies with federal contracts located in this zip code:
R & R INDUSTRIES LTD INC (17416 TALBOT RD in SIOUX CITY, IA; small business) : $654,802 in 19 contractsfrom 1999 to 2006
Contracts for Miscellaneous Power Transmission Equipment, Aircraft Landing Equipment, Maintenance, Repair and Rebuilding of Equipment -- Engines, Turbines, and Components, Maintenance, Repair and Rebuilding of Equipment -- Miscellaneous, and moreby Defense Logistics Agency, Army Signed by year:2000: $123,660; 2001: $45,198; 2002: $0; 2003: $34,091; 2004: $252,278; 2005: $162,135; 2006: $6,750.
Biggest contracts:
$103,142 with Defense Logistics Agency for Miscellaneous Power Transmission Equipment. Signed on 2005-06-29. Completion date: 2005-10-07.
$95,760 with Defense Logistics Agency for Aircraft Landing Equipment. Signed on 2000-05-08. Completion date: 2000-10-05.
$63,359 with Defense Logistics Agency for Miscellaneous Power Transmission Equipment. Signed on 2004-07-28. Completion date: 2004-10-26.
$48,624, same as above.Signed on 2004-08-30. Completion date: 2004-10-29.
LYLES GARAGE DOOR SERVICE INC (5211 MILITARY RD in SIOUX CITY, IA; small business)
$3,733 with Army for Maintenance, Repair or Alteration of Real Property -- Miscellaneous Buildings. Signed on 2005-03-24. Completion date: 2005-04-08.
Top industries in this zip code by the number of employees in 2005:
Construction: Commercial and Institutional Building Construction (20-49 employees: 1 establishment, 5-9 employees: 1 establishment)
Accommodation and Food Services: Full-Service Restaurants (20-49: 1)
Other Services (except Public Administration): General Automotive Repair (10-19: 1, 1-4: 1)
Other Services (except Public Administration): Labor Unions and Similar Labor Organizations (10-19: 1)
Accommodation and Food Services: Limited-Service Restaurants (10-19: 1)
Health Care and Social Assistance: Other Individual and Family Services (10-19: 1)
Other Services (except Public Administration): Religious Organizations (5-9: 1, 1-4: 1)
Fatal accident statistics in 2014:
Fatal accident count: 1
Vehicles involved in fatal accidents: 2
Fatal accidents caused by drunken drivers: 0
Fatalities: 1
Persons involved in fatal accidents: 2
Pedestrians involved in fatal accidents: 0
Fatal accident statistics in 2012:
Fatal accident count: 1
Vehicles involved in fatal accidents: 1
Fatal accidents caused by drunken drivers: 0
Fatalities: 1
Persons involved in fatal accidents: 6
Pedestrians involved in fatal accidents: 0
Home Mortgage Disclosure Act Aggregated Statistics For Year 2009 (Based on 2 full and 2 partial tracts)
A) FHA, FSA/RHS & VA Home Purchase Loans
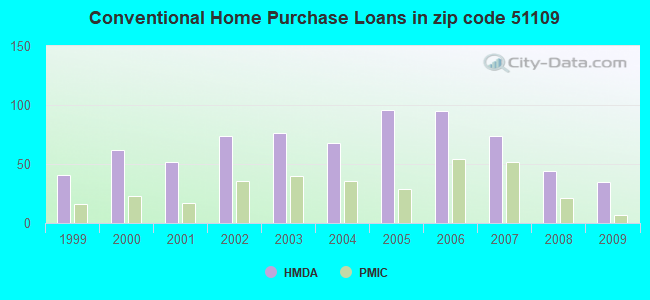
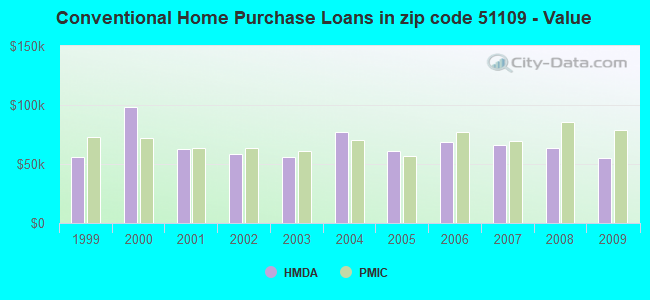
B) Conventional Home Purchase Loans
C) Refinancings
D) Home Improvement Loans
F) Non-occupant Loans on < 5 Family Dwellings (A B C & D)
G) Loans On Manufactured Home Dwelling (A B C & D)
Number
Average Value
Number
Average Value
Number
Average Value
Number
Average Value
Number
Average Value
Number
Average Value
LOANS ORIGINATED
30
$93,208
35
$55,493
66
$77,598
23
$21,367
19
$37,580
10
$78,910
APPLICATIONS APPROVED, NOT ACCEPTED
4
$107,650
6
$84,287
7
$78,829
0
$0
0
$0
4
$107,650
APPLICATIONS DENIED
8
$74,298
10
$66,051
38
$82,278
22
$36,174
4
$64,603
8
$74,526
APPLICATIONS WITHDRAWN
4
$99,968
1
$31,760
28
$88,614
4
$102,275
1
$58,570
0
$0
FILES CLOSED FOR INCOMPLETENESS
0
$0
0
$0
4
$84,755
2
$92,550
0
$0
0
$0
Aggregated Statistics For Year 2008 (Based on 2 full and 2 partial tracts)
A) FHA, FSA/RHS & VA Home Purchase Loans
B) Conventional Home Purchase Loans
C) Refinancings
D) Home Improvement Loans
E) Loans on Dwellings For 5+ Families
F) Non-occupant Loans on < 5 Family Dwellings (A B C & D)
G) Loans On Manufactured Home Dwelling (A B C & D)
Number
Average Value
Number
Average Value
Number
Average Value
Number
Average Value
Number
Average Value
Number
Average Value
Number
Average Value
LOANS ORIGINATED
27
$80,833
44
$63,772
53
$69,388
27
$24,260
4
$183,150
19
$53,907
0
$0
APPLICATIONS APPROVED, NOT ACCEPTED
12
$82,876
6
$76,637
12
$70,305
0
$0
0
$0
2
$27,280
4
$92,550
APPLICATIONS DENIED
4
$56,018
15
$86,323
37
$72,376
11
$34,191
0
$0
2
$34,845
4
$109,110
APPLICATIONS WITHDRAWN
0
$0
10
$70,032
30
$77,901
4
$46,762
0
$0
2
$49,660
0
$0
FILES CLOSED FOR INCOMPLETENESS
0
$0
0
$0
1
$94,410
0
$0
0
$0
0
$0
0
$0
Aggregated Statistics For Year 2007 (Based on 2 full and 2 partial tracts)
A) FHA, FSA/RHS & VA Home Purchase Loans
B) Conventional Home Purchase Loans
C) Refinancings
D) Home Improvement Loans
E) Loans on Dwellings For 5+ Families
F) Non-occupant Loans on < 5 Family Dwellings (A B C & D)
G) Loans On Manufactured Home Dwelling (A B C & D)
Number
Average Value
Number
Average Value
Number
Average Value
Number
Average Value
Number
Average Value
Number
Average Value
Number
Average Value
LOANS ORIGINATED
7
$78,343
74
$66,104
79
$51,116
43
$25,114
4
$72,090
16
$58,182
4
$93,522
APPLICATIONS APPROVED, NOT ACCEPTED
0
$0
11
$50,744
23
$77,928
2
$14,115
0
$0
2
$32,260
0
$0
APPLICATIONS DENIED
0
$0
35
$69,181
109
$76,084
31
$26,581
0
$0
9
$72,606
6
$98,070
APPLICATIONS WITHDRAWN
0
$0
3
$141,033
22
$70,768
5
$62,340
0
$0
1
$12,530
0
$0
FILES CLOSED FOR INCOMPLETENESS
0
$0
2
$75,015
2
$109,420
0
$0
0
$0
0
$0
0
$0
Aggregated Statistics For Year 2006 (Based on 2 full and 2 partial tracts)
A) FHA, FSA/RHS & VA Home Purchase Loans
B) Conventional Home Purchase Loans
C) Refinancings
D) Home Improvement Loans
E) Loans on Dwellings For 5+ Families
F) Non-occupant Loans on < 5 Family Dwellings (A B C & D)
G) Loans On Manufactured Home Dwelling (A B C & D)
Number
Average Value
Number
Average Value
Number
Average Value
Number
Average Value
Number
Average Value
Number
Average Value
Number
Average Value
LOANS ORIGINATED
10
$87,807
95
$68,916
96
$72,464
44
$15,862
2
$546,040
34
$91,867
2
$105,215
APPLICATIONS APPROVED, NOT ACCEPTED
0
$0
3
$73,843
17
$60,388
2
$63,325
0
$0
2
$22,405
4
$79,885
APPLICATIONS DENIED
0
$0
14
$61,891
88
$73,999
13
$33,025
0
$0
6
$51,223
4
$96,445
APPLICATIONS WITHDRAWN
2
$34,095
13
$65,425
43
$104,733
6
$101,762
0
$0
4
$104,728
0
$0
FILES CLOSED FOR INCOMPLETENESS
0
$0
2
$76,335
11
$75,363
0
$0
0
$0
0
$0
0
$0
Aggregated Statistics For Year 2005 (Based on 2 full and 2 partial tracts)
A) FHA, FSA/RHS & VA Home Purchase Loans
B) Conventional Home Purchase Loans
C) Refinancings
D) Home Improvement Loans
F) Non-occupant Loans on < 5 Family Dwellings (A B C & D)
G) Loans On Manufactured Home Dwelling (A B C & D)
Number
Average Value
Number
Average Value
Number
Average Value
Number
Average Value
Number
Average Value
Number
Average Value
LOANS ORIGINATED
16
$62,445
96
$60,987
93
$72,554
32
$21,806
42
$56,411
4
$51,632
APPLICATIONS APPROVED, NOT ACCEPTED
0
$0
5
$47,450
34
$143,932
0
$0
2
$37,995
2
$82,805
APPLICATIONS DENIED
6
$65,597
29
$78,856
116
$154,722
34
$20,700
2
$32,950
1
$14,570
APPLICATIONS WITHDRAWN
2
$32,150
21
$53,011
71
$106,770
2
$146,130
4
$62,765
0
$0
FILES CLOSED FOR INCOMPLETENESS
0
$0
1
$43,130
20
$126,873
0
$0
0
$0
0
$0
Aggregated Statistics For Year 2004 (Based on 2 full and 2 partial tracts)
A) FHA, FSA/RHS & VA Home Purchase Loans
B) Conventional Home Purchase Loans
C) Refinancings
D) Home Improvement Loans
F) Non-occupant Loans on < 5 Family Dwellings (A B C & D)
G) Loans On Manufactured Home Dwelling (A B C & D)
Number
Average Value
Number
Average Value
Number
Average Value
Number
Average Value
Number
Average Value
Number
Average Value
LOANS ORIGINATED
3
$79,830
68
$76,820
140
$62,776
28
$13,981
28
$85,322
6
$90,277
APPLICATIONS APPROVED, NOT ACCEPTED
0
$0
11
$66,845
27
$68,799
1
$16,900
6
$45,787
0
$0
APPLICATIONS DENIED
4
$69,655
6
$52,240
77
$61,455
26
$16,689
7
$58,953
2
$95,470
APPLICATIONS WITHDRAWN
6
$60,725
7
$67,767
32
$64,098
1
$18,650
4
$35,295
0
$0
FILES CLOSED FOR INCOMPLETENESS
0
$0
0
$0
16
$89,082
2
$53,580
0
$0
0
$0
Aggregated Statistics For Year 2003 (Based on 2 full and 2 partial tracts)
A) FHA, FSA/RHS & VA Home Purchase Loans
B) Conventional Home Purchase Loans
C) Refinancings
D) Home Improvement Loans
E) Loans on Dwellings For 5+ Families
F) Non-occupant Loans on < 5 Family Dwellings (A B C & D)
Number
Average Value
Number
Average Value
Number
Average Value
Number
Average Value
Number
Average Value
Number
Average Value
LOANS ORIGINATED
5
$71,932
76
$56,336
282
$64,535
38
$16,025
2
$58,450
33
$47,442
APPLICATIONS APPROVED, NOT ACCEPTED
0
$0
4
$89,490
29
$58,766
0
$0
0
$0
4
$40,430
APPLICATIONS DENIED
4
$85,868
10
$35,929
107
$65,850
21
$11,671
0
$0
3
$47,200
APPLICATIONS WITHDRAWN
2
$43,420
9
$67,316
52
$61,315
2
$54,555
0
$0
2
$55,520
FILES CLOSED FOR INCOMPLETENESS
0
$0
0
$0
8
$58,082
0
$0
0
$0
0
$0
Aggregated Statistics For Year 2002 (Based on 2 full and 2 partial tracts)
A) FHA, FSA/RHS & VA Home Purchase Loans
B) Conventional Home Purchase Loans
C) Refinancings
D) Home Improvement Loans
E) Loans on Dwellings For 5+ Families
F) Non-occupant Loans on < 5 Family Dwellings (A B C & D)
Number
Average Value
Number
Average Value
Number
Average Value
Number
Average Value
Number
Average Value
Number
Average Value
LOANS ORIGINATED
15
$66,385
74
$58,667
201
$64,798
34
$14,610
2
$39,940
32
$53,009
APPLICATIONS APPROVED, NOT ACCEPTED
0
$0
8
$44,349
39
$62,935
1
$9,910
0
$0
4
$49,685
APPLICATIONS DENIED
3
$71,067
19
$60,870
86
$56,035
7
$7,831
0
$0
11
$34,509
APPLICATIONS WITHDRAWN
2
$68,205
2
$34,510
53
$72,045
6
$6,495
0
$0
2
$41,890
FILES CLOSED FOR INCOMPLETENESS
0
$0
4
$64,298
9
$62,149
0
$0
0
$0
0
$0
Aggregated Statistics For Year 2001 (Based on 2 full and 2 partial tracts)
A) FHA, FSA/RHS & VA Home Purchase Loans
B) Conventional Home Purchase Loans
C) Refinancings
D) Home Improvement Loans
E) Loans on Dwellings For 5+ Families
F) Non-occupant Loans on < 5 Family Dwellings (A B C & D)
Number
Average Value
Number
Average Value
Number
Average Value
Number
Average Value
Number
Average Value
Number
Average Value
LOANS ORIGINATED
30
$70,920
52
$62,982
191
$59,131
41
$16,780
2
$185,100
12
$64,172
APPLICATIONS APPROVED, NOT ACCEPTED
3
$57,763
10
$60,595
42
$61,370
0
$0
0
$0
2
$58,450
APPLICATIONS DENIED
4
$72,632
19
$51,186
83
$48,249
18
$15,620
0
$0
4
$25,762
APPLICATIONS WITHDRAWN
0
$0
4
$81,942
45
$63,692
6
$26,635
0
$0
0
$0
FILES CLOSED FOR INCOMPLETENESS
0
$0
4
$63,498
5
$48,556
0
$0
0
$0
0
$0
Aggregated Statistics For Year 2000 (Based on 2 full and 2 partial tracts)
A) FHA, FSA/RHS & VA Home Purchase Loans
B) Conventional Home Purchase Loans
C) Refinancings
D) Home Improvement Loans
E) Loans on Dwellings For 5+ Families
F) Non-occupant Loans on < 5 Family Dwellings (A B C & D)
Number
Average Value
Number
Average Value
Number
Average Value
Number
Average Value
Number
Average Value
Number
Average Value
LOANS ORIGINATED
31
$67,237
62
$98,111
90
$52,857
50
$12,605
2
$77,935
8
$32,604
APPLICATIONS APPROVED, NOT ACCEPTED
6
$74,750
6
$47,142
34
$42,899
6
$25,548
0
$0
0
$0
APPLICATIONS DENIED
16
$71,321
23
$48,580
67
$52,919
18
$18,947
0
$0
2
$24,355
APPLICATIONS WITHDRAWN
3
$59,740
7
$70,617
50
$48,760
2
$34,825
0
$0
2
$24,355
FILES CLOSED FOR INCOMPLETENESS
2
$53,580
0
$0
4
$59,022
0
$0
0
$0
0
$0
Aggregated Statistics For Year 1999 (Based on 1 full and 1 partial tracts)
A) FHA, FSA/RHS & VA Home Purchase Loans
B) Conventional Home Purchase Loans
C) Refinancings
D) Home Improvement Loans
F) Non-occupant Loans on < 5 Family Dwellings (A B C & D)
Detailed PMIC statistics for the following Tracts:0006.00
, 0007.00
2002 - 2018 National Fire Incident Reporting System (NFIRS) incidents
According to the data from the years 2002 - 2018 the average number of fires per year is 10. The highest number of fire incidents - 21 took place in 2006, and the least - 2 in 2016. The data has a dropping trend.
When looking into fire subcategories, the most incidents belonged to: Outside Fires (46.9%), and Structure Fires (30.3%).
Fire incident types reported to NFIRS in Zip Code 51109

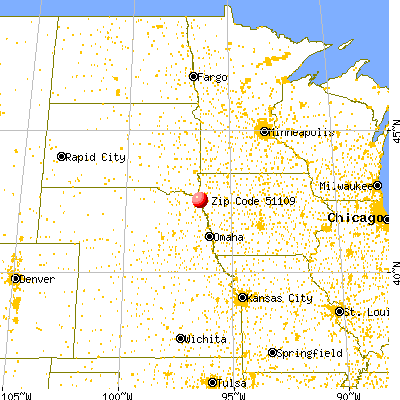


 Nearest zip codes: 57049, 51103, 51104, 57038, 68776, 51101.
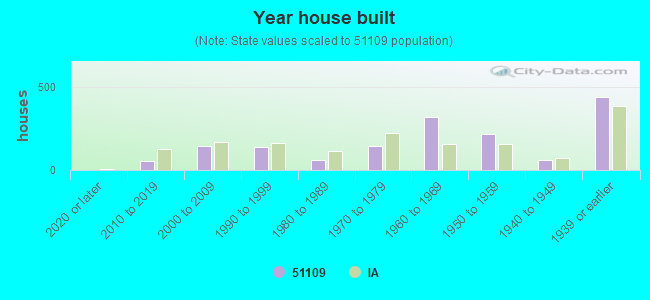


 According to the data from the years 2002 - 2018 the average number of fires per year is 10. The highest number of fire incidents - 21 took place in 2006, and the least - 2 in 2016. The data has a dropping trend.
 When looking into fire subcategories, the most incidents belonged to: Outside Fires (46.9%), and Structure Fires (30.3%).