Estimated zip code population in 2022: 33,996
Zip code population in 2010: 38,196
Zip code population in 2000: 47,349
Houses and condos: 20,723
Renter-occupied apartments: 8,795
% of renters here:
52%State:
33%
March 2022 cost of living index in zip code 44120: 94.5
(less than average, U.S. average is 100)
Land area: 5.3
sq. mi.
Water area: 0.0
sq. mi.
Population density: 6,397 people per square mile (high).
OSM Map
General Map
Google Map
MSN Map
OSM Map
General Map
Google Map
MSN Map
OSM Map
General Map
Google Map
MSN Map
OSM Map
General Map
Google Map
MSN Map
Please wait while loading the map...
Real estate property taxes paid for housing units in 2022:
This zip code:
2.7% ($3,090)Ohio:
1.3% ($2,639)
Median real estate property taxes paid for housing units with mortgages in 2022: $3,538 (2.6%)
Median real estate property taxes paid for housing units with no mortgage in 2022: $2,621 (2.7%)
Profiles of local businesses
Business Search - 14 Million verified businesses
Males: 15,713 Females: 18,280
For population 25 years and over in 44120:
High school or higher: 90.0%Bachelor's degree or higher: 39.4%Graduate or professional degree: 19.4%Unemployed: 6.5%Mean travel time to work (commute): 24.3 minutes
For population 15 years and over in 44120:
Never married: 46.1%Now married: 30.7%Separated: 2.6%Widowed: 7.2%Divorced: 13.5%
Zip code 44120 compared to state average:
Median household income below state average. Median house value below state average. Unemployed percentage above state average. Black race population percentage significantly above state average. Hispanic race population percentage below state average. Renting percentage above state average. Length of stay since moving in significantly above state average. House age above state average. 22,978 67.6% Black 7,427 21.8% White 1,626 4.8% Two or more races 940 2.8% Asian 768 2.3% Hispanic or Latino 232 0.7% Some other race 21 0.06% American Indian
Data:
Median household income ($)
Median household income (% change since 2000)
Household income diversity
Ratio of average income to average house value (%)
Ratio of average income to average rent
Median household income ($) - White
Median household income ($) - Black or African American
Median household income ($) - Asian
Median household income ($) - Hispanic or Latino
Median household income ($) - American Indian and Alaska Native
Median household income ($) - Multirace
Median household income ($) - Other Race
Median household income for houses/condos with a mortgage ($)
Median household income for apartments without a mortgage ($)
Races - White alone (%)
Races - White alone (% change since 2000)
Races - Black alone (%)
Races - Black alone (% change since 2000)
Races - American Indian alone (%)
Races - American Indian alone (% change since 2000)
Races - Asian alone (%)
Races - Asian alone (% change since 2000)
Races - Hispanic (%)
Races - Hispanic (% change since 2000)
Races - Native Hawaiian and Other Pacific Islander alone (%)
Races - Native Hawaiian and Other Pacific Islander alone (% change since 2000)
Races - Two or more races (%)
Races - Two or more races (% change since 2000)
Races - Other race alone (%)
Races - Other race alone (% change since 2000)
Racial diversity
Unemployment (%)
Unemployment (% change since 2000)
Unemployment (%) - White
Unemployment (%) - Black or African American
Unemployment (%) - Asian
Unemployment (%) - Hispanic or Latino
Unemployment (%) - American Indian and Alaska Native
Unemployment (%) - Multirace
Unemployment (%) - Other Race
Population density (people per square mile)
Population - Males (%)
Population - Females (%)
Population - Males (%) - White
Population - Males (%) - Black or African American
Population - Males (%) - Asian
Population - Males (%) - Hispanic or Latino
Population - Males (%) - American Indian and Alaska Native
Population - Males (%) - Multirace
Population - Males (%) - Other Race
Population - Females (%) - White
Population - Females (%) - Black or African American
Population - Females (%) - Asian
Population - Females (%) - Hispanic or Latino
Population - Females (%) - American Indian and Alaska Native
Population - Females (%) - Multirace
Population - Females (%) - Other Race
Coronavirus confirmed cases (May 23, 2024)
Deaths caused by coronavirus (May 23, 2024)
Coronavirus confirmed cases (per 100k population) (May 23, 2024)
Deaths caused by coronavirus (per 100k population) (May 23, 2024)
Daily increase in number of cases (May 23, 2024)
Weekly increase in number of cases (May 23, 2024)
Cases doubled (in days) (May 23, 2024)
Hospitalized patients (Apr 18, 2022)
Negative test results (Apr 18, 2022)
Total test results (Apr 18, 2022)
COVID Vaccine doses distributed (per 100k population) (Sep 19, 2023)
COVID Vaccine doses administered (per 100k population) (Sep 19, 2023)
COVID Vaccine doses distributed (Sep 19, 2023)
COVID Vaccine doses administered (Sep 19, 2023)
Likely homosexual households (%)
Likely homosexual households (% change since 2000)
Likely homosexual households - Lesbian couples (%)
Likely homosexual households - Lesbian couples (% change since 2000)
Likely homosexual households - Gay men (%)
Likely homosexual households - Gay men (% change since 2000)
Cost of living index
Median gross rent ($)
Median contract rent ($)
Median monthly housing costs ($)
Median house or condo value ($)
Median house or condo value ($ change since 2000)
Mean house or condo value by units in structure - 1, detached ($)
Mean house or condo value by units in structure - 1, attached ($)
Mean house or condo value by units in structure - 2 ($)
Mean house or condo value by units in structure by units in structure - 3 or 4 ($)
Mean house or condo value by units in structure - 5 or more ($)
Mean house or condo value by units in structure - Boat, RV, van, etc. ($)
Mean house or condo value by units in structure - Mobile home ($)
Median house or condo value ($) - White
Median house or condo value ($) - Black or African American
Median house or condo value ($) - Asian
Median house or condo value ($) - Hispanic or Latino
Median house or condo value ($) - American Indian and Alaska Native
Median house or condo value ($) - Multirace
Median house or condo value ($) - Other Race
Median resident age
Resident age diversity
Median resident age - Males
Median resident age - Females
Median resident age - White
Median resident age - Black or African American
Median resident age - Asian
Median resident age - Hispanic or Latino
Median resident age - American Indian and Alaska Native
Median resident age - Multirace
Median resident age - Other Race
Median resident age - Males - White
Median resident age - Males - Black or African American
Median resident age - Males - Asian
Median resident age - Males - Hispanic or Latino
Median resident age - Males - American Indian and Alaska Native
Median resident age - Males - Multirace
Median resident age - Males - Other Race
Median resident age - Females - White
Median resident age - Females - Black or African American
Median resident age - Females - Asian
Median resident age - Females - Hispanic or Latino
Median resident age - Females - American Indian and Alaska Native
Median resident age - Females - Multirace
Median resident age - Females - Other Race
Commute - mean travel time to work (minutes)
Travel time to work - Less than 5 minutes (%)
Travel time to work - Less than 5 minutes (% change since 2000)
Travel time to work - 5 to 9 minutes (%)
Travel time to work - 5 to 9 minutes (% change since 2000)
Travel time to work - 10 to 19 minutes (%)
Travel time to work - 10 to 19 minutes (% change since 2000)
Travel time to work - 20 to 29 minutes (%)
Travel time to work - 20 to 29 minutes (% change since 2000)
Travel time to work - 30 to 39 minutes (%)
Travel time to work - 30 to 39 minutes (% change since 2000)
Travel time to work - 40 to 59 minutes (%)
Travel time to work - 40 to 59 minutes (% change since 2000)
Travel time to work - 60 to 89 minutes (%)
Travel time to work - 60 to 89 minutes (% change since 2000)
Travel time to work - 90 or more minutes (%)
Travel time to work - 90 or more minutes (% change since 2000)
Marital status - Never married (%)
Marital status - Now married (%)
Marital status - Separated (%)
Marital status - Widowed (%)
Marital status - Divorced (%)
Median family income ($)
Median family income (% change since 2000)
Median non-family income ($)
Median non-family income (% change since 2000)
Median per capita income ($)
Median per capita income (% change since 2000)
Median family income ($) - White
Median family income ($) - Black or African American
Median family income ($) - Asian
Median family income ($) - Hispanic or Latino
Median family income ($) - American Indian and Alaska Native
Median family income ($) - Multirace
Median family income ($) - Other Race
Median year house/condo built
Median year apartment built
Year house built - Built 2005 or later (%)
Year house built - Built 2000 to 2004 (%)
Year house built - Built 1990 to 1999 (%)
Year house built - Built 1980 to 1989 (%)
Year house built - Built 1970 to 1979 (%)
Year house built - Built 1960 to 1969 (%)
Year house built - Built 1950 to 1959 (%)
Year house built - Built 1940 to 1949 (%)
Year house built - Built 1939 or earlier (%)
Average household size
Household density (households per square mile)
Average household size - White
Average household size - Black or African American
Average household size - Asian
Average household size - Hispanic or Latino
Average household size - American Indian and Alaska Native
Average household size - Multirace
Average household size - Other Race
Occupied housing units (%)
Vacant housing units (%)
Owner occupied housing units (%)
Renter occupied housing units (%)
Vacancy status - For rent (%)
Vacancy status - For sale only (%)
Vacancy status - Rented or sold, not occupied (%)
Vacancy status - For seasonal, recreational, or occasional use (%)
Vacancy status - For migrant workers (%)
Vacancy status - Other vacant (%)
Residents with income below the poverty level (%)
Residents with income below 50% of the poverty level (%)
Children below poverty level (%)
Poor families by family type - Married-couple family (%)
Poor families by family type - Male, no wife present (%)
Poor families by family type - Female, no husband present (%)
Poverty status for native-born residents (%)
Poverty status for foreign-born residents (%)
Poverty among high school graduates not in families (%)
Poverty among people who did not graduate high school not in families (%)
Residents with income below the poverty level (%) - White
Residents with income below the poverty level (%) - Black or African American
Residents with income below the poverty level (%) - Asian
Residents with income below the poverty level (%) - Hispanic or Latino
Residents with income below the poverty level (%) - American Indian and Alaska Native
Residents with income below the poverty level (%) - Multirace
Residents with income below the poverty level (%) - Other Race
Air pollution - Air Quality Index (AQI)
Air pollution - CO
Air pollution - NO2
Air pollution - SO2
Air pollution - Ozone
Air pollution - PM10
Air pollution - PM25
Air pollution - Pb
Crime - Murders per 100,000 population
Crime - Rapes per 100,000 population
Crime - Robberies per 100,000 population
Crime - Assaults per 100,000 population
Crime - Burglaries per 100,000 population
Crime - Thefts per 100,000 population
Crime - Auto thefts per 100,000 population
Crime - Arson per 100,000 population
Crime - City-data.com crime index
Crime - Violent crime index
Crime - Property crime index
Crime - Murders per 100,000 population (5 year average)
Crime - Rapes per 100,000 population (5 year average)
Crime - Robberies per 100,000 population (5 year average)
Crime - Assaults per 100,000 population (5 year average)
Crime - Burglaries per 100,000 population (5 year average)
Crime - Thefts per 100,000 population (5 year average)
Crime - Auto thefts per 100,000 population (5 year average)
Crime - Arson per 100,000 population (5 year average)
Crime - City-data.com crime index (5 year average)
Crime - Violent crime index (5 year average)
Crime - Property crime index (5 year average)
1996 Presidential Elections Results (%) - Democratic Party (Clinton)
1996 Presidential Elections Results (%) - Republican Party (Dole)
1996 Presidential Elections Results (%) - Other
2000 Presidential Elections Results (%) - Democratic Party (Gore)
2000 Presidential Elections Results (%) - Republican Party (Bush)
2000 Presidential Elections Results (%) - Other
2004 Presidential Elections Results (%) - Democratic Party (Kerry)
2004 Presidential Elections Results (%) - Republican Party (Bush)
2004 Presidential Elections Results (%) - Other
2008 Presidential Elections Results (%) - Democratic Party (Obama)
2008 Presidential Elections Results (%) - Republican Party (McCain)
2008 Presidential Elections Results (%) - Other
2012 Presidential Elections Results (%) - Democratic Party (Obama)
2012 Presidential Elections Results (%) - Republican Party (Romney)
2012 Presidential Elections Results (%) - Other
2016 Presidential Elections Results (%) - Democratic Party (Clinton)
2016 Presidential Elections Results (%) - Republican Party (Trump)
2016 Presidential Elections Results (%) - Other
2020 Presidential Elections Results (%) - Democratic Party (Biden)
2020 Presidential Elections Results (%) - Republican Party (Trump)
2020 Presidential Elections Results (%) - Other
Ancestries Reported - Arab (%)
Ancestries Reported - Czech (%)
Ancestries Reported - Danish (%)
Ancestries Reported - Dutch (%)
Ancestries Reported - English (%)
Ancestries Reported - French (%)
Ancestries Reported - French Canadian (%)
Ancestries Reported - German (%)
Ancestries Reported - Greek (%)
Ancestries Reported - Hungarian (%)
Ancestries Reported - Irish (%)
Ancestries Reported - Italian (%)
Ancestries Reported - Lithuanian (%)
Ancestries Reported - Norwegian (%)
Ancestries Reported - Polish (%)
Ancestries Reported - Portuguese (%)
Ancestries Reported - Russian (%)
Ancestries Reported - Scotch-Irish (%)
Ancestries Reported - Scottish (%)
Ancestries Reported - Slovak (%)
Ancestries Reported - Subsaharan African (%)
Ancestries Reported - Swedish (%)
Ancestries Reported - Swiss (%)
Ancestries Reported - Ukrainian (%)
Ancestries Reported - United States (%)
Ancestries Reported - Welsh (%)
Ancestries Reported - West Indian (%)
Ancestries Reported - Other (%)
Educational Attainment - No schooling completed (%)
Educational Attainment - Less than high school (%)
Educational Attainment - High school or equivalent (%)
Educational Attainment - Less than 1 year of college (%)
Educational Attainment - 1 or more years of college (%)
Educational Attainment - Associate degree (%)
Educational Attainment - Bachelor's degree (%)
Educational Attainment - Master's degree (%)
Educational Attainment - Professional school degree (%)
Educational Attainment - Doctorate degree (%)
School Enrollment - Nursery, preschool (%)
School Enrollment - Kindergarten (%)
School Enrollment - Grade 1 to 4 (%)
School Enrollment - Grade 5 to 8 (%)
School Enrollment - Grade 9 to 12 (%)
School Enrollment - College undergrad (%)
School Enrollment - Graduate or professional (%)
School Enrollment - Not enrolled in school (%)
School enrollment - Public schools (%)
School enrollment - Private schools (%)
School enrollment - Not enrolled (%)
Median number of rooms in houses and condos
Median number of rooms in apartments
Housing units lacking complete plumbing facilities (%)
Housing units lacking complete kitchen facilities (%)
Density of houses
Urban houses (%)
Rural houses (%)
Households with people 60 years and over (%)
Households with people 65 years and over (%)
Households with people 75 years and over (%)
Households with one or more nonrelatives (%)
Households with no nonrelatives (%)
Population in households (%)
Family households (%)
Nonfamily households (%)
Population in families (%)
Family households with own children (%)
Median number of bedrooms in owner occupied houses
Mean number of bedrooms in owner occupied houses
Median number of bedrooms in renter occupied houses
Mean number of bedrooms in renter occupied houses
Median number of vehichles in owner occupied houses
Mean number of vehichles in owner occupied houses
Median number of vehichles in renter occupied houses
Mean number of vehichles in renter occupied houses
Mortgage status - with mortgage (%)
Mortgage status - with second mortgage (%)
Mortgage status - with home equity loan (%)
Mortgage status - with both second mortgage and home equity loan (%)
Mortgage status - without a mortgage (%)
Average family size
Average family size - White
Average family size - Black or African American
Average family size - Asian
Average family size - Hispanic or Latino
Average family size - American Indian and Alaska Native
Average family size - Multirace
Average family size - Other Race
Geographical mobility - Same house 1 year ago (%)
Geographical mobility - Moved within same county (%)
Geographical mobility - Moved from different county within same state (%)
Geographical mobility - Moved from different state (%)
Geographical mobility - Moved from abroad (%)
Place of birth - Born in state of residence (%)
Place of birth - Born in other state (%)
Place of birth - Native, outside of US (%)
Place of birth - Foreign born (%)
Housing units in structures - 1, detached (%)
Housing units in structures - 1, attached (%)
Housing units in structures - 2 (%)
Housing units in structures - 3 or 4 (%)
Housing units in structures - 5 to 9 (%)
Housing units in structures - 10 to 19 (%)
Housing units in structures - 20 to 49 (%)
Housing units in structures - 50 or more (%)
Housing units in structures - Mobile home (%)
Housing units in structures - Boat, RV, van, etc. (%)
House/condo owner moved in on average (years ago)
Renter moved in on average (years ago)
Year householder moved into unit - Moved in 1999 to March 2000 (%)
Year householder moved into unit - Moved in 1995 to 1998 (%)
Year householder moved into unit - Moved in 1990 to 1994 (%)
Year householder moved into unit - Moved in 1980 to 1989 (%)
Year householder moved into unit - Moved in 1970 to 1979 (%)
Year householder moved into unit - Moved in 1969 or earlier (%)
Means of transportation to work - Drove car alone (%)
Means of transportation to work - Carpooled (%)
Means of transportation to work - Public transportation (%)
Means of transportation to work - Bus or trolley bus (%)
Means of transportation to work - Streetcar or trolley car (%)
Means of transportation to work - Subway or elevated (%)
Means of transportation to work - Railroad (%)
Means of transportation to work - Ferryboat (%)
Means of transportation to work - Taxicab (%)
Means of transportation to work - Motorcycle (%)
Means of transportation to work - Bicycle (%)
Means of transportation to work - Walked (%)
Means of transportation to work - Other means (%)
Working at home (%)
Industry diversity
Most Common Industries - Agriculture, forestry, fishing and hunting, and mining (%)
Most Common Industries - Agriculture, forestry, fishing and hunting (%)
Most Common Industries - Mining, quarrying, and oil and gas extraction (%)
Most Common Industries - Construction (%)
Most Common Industries - Manufacturing (%)
Most Common Industries - Wholesale trade (%)
Most Common Industries - Retail trade (%)
Most Common Industries - Transportation and warehousing, and utilities (%)
Most Common Industries - Transportation and warehousing (%)
Most Common Industries - Utilities (%)
Most Common Industries - Information (%)
Most Common Industries - Finance and insurance, and real estate and rental and leasing (%)
Most Common Industries - Finance and insurance (%)
Most Common Industries - Real estate and rental and leasing (%)
Most Common Industries - Professional, scientific, and management, and administrative and waste management services (%)
Most Common Industries - Professional, scientific, and technical services (%)
Most Common Industries - Management of companies and enterprises (%)
Most Common Industries - Administrative and support and waste management services (%)
Most Common Industries - Educational services, and health care and social assistance (%)
Most Common Industries - Educational services (%)
Most Common Industries - Health care and social assistance (%)
Most Common Industries - Arts, entertainment, and recreation, and accommodation and food services (%)
Most Common Industries - Arts, entertainment, and recreation (%)
Most Common Industries - Accommodation and food services (%)
Most Common Industries - Other services, except public administration (%)
Most Common Industries - Public administration (%)
Occupation diversity
Most Common Occupations - Management, business, science, and arts occupations (%)
Most Common Occupations - Management, business, and financial occupations (%)
Most Common Occupations - Management occupations (%)
Most Common Occupations - Business and financial operations occupations (%)
Most Common Occupations - Computer, engineering, and science occupations (%)
Most Common Occupations - Computer and mathematical occupations (%)
Most Common Occupations - Architecture and engineering occupations (%)
Most Common Occupations - Life, physical, and social science occupations (%)
Most Common Occupations - Education, legal, community service, arts, and media occupations (%)
Most Common Occupations - Community and social service occupations (%)
Most Common Occupations - Legal occupations (%)
Most Common Occupations - Education, training, and library occupations (%)
Most Common Occupations - Arts, design, entertainment, sports, and media occupations (%)
Most Common Occupations - Healthcare practitioners and technical occupations (%)
Most Common Occupations - Health diagnosing and treating practitioners and other technical occupations (%)
Most Common Occupations - Health technologists and technicians (%)
Most Common Occupations - Service occupations (%)
Most Common Occupations - Healthcare support occupations (%)
Most Common Occupations - Protective service occupations (%)
Most Common Occupations - Fire fighting and prevention, and other protective service workers including supervisors (%)
Most Common Occupations - Law enforcement workers including supervisors (%)
Most Common Occupations - Food preparation and serving related occupations (%)
Most Common Occupations - Building and grounds cleaning and maintenance occupations (%)
Most Common Occupations - Personal care and service occupations (%)
Most Common Occupations - Sales and office occupations (%)
Most Common Occupations - Sales and related occupations (%)
Most Common Occupations - Office and administrative support occupations (%)
Most Common Occupations - Natural resources, construction, and maintenance occupations (%)
Most Common Occupations - Farming, fishing, and forestry occupations (%)
Most Common Occupations - Construction and extraction occupations (%)
Most Common Occupations - Installation, maintenance, and repair occupations (%)
Most Common Occupations - Production, transportation, and material moving occupations (%)
Most Common Occupations - Production occupations (%)
Most Common Occupations - Transportation occupations (%)
Most Common Occupations - Material moving occupations (%)
People in Group quarters - Institutionalized population (%)
People in Group quarters - Correctional institutions (%)
People in Group quarters - Federal prisons and detention centers (%)
People in Group quarters - Halfway houses (%)
People in Group quarters - Local jails and other confinement facilities (including police lockups) (%)
People in Group quarters - Military disciplinary barracks (%)
People in Group quarters - State prisons (%)
People in Group quarters - Other types of correctional institutions (%)
People in Group quarters - Nursing homes (%)
People in Group quarters - Hospitals/wards, hospices, and schools for the handicapped (%)
People in Group quarters - Hospitals/wards and hospices for chronically ill (%)
People in Group quarters - Hospices or homes for chronically ill (%)
People in Group quarters - Military hospitals or wards for chronically ill (%)
People in Group quarters - Other hospitals or wards for chronically ill (%)
People in Group quarters - Hospitals or wards for drug/alcohol abuse (%)
People in Group quarters - Mental (Psychiatric) hospitals or wards (%)
People in Group quarters - Schools, hospitals, or wards for the mentally retarded (%)
People in Group quarters - Schools, hospitals, or wards for the physically handicapped (%)
People in Group quarters - Institutions for the deaf (%)
People in Group quarters - Institutions for the blind (%)
People in Group quarters - Orthopedic wards and institutions for the physically handicapped (%)
People in Group quarters - Wards in general hospitals for patients who have no usual home elsewhere (%)
People in Group quarters - Wards in military hospitals for patients who have no usual home elsewhere (%)
People in Group quarters - Juvenile institutions (%)
People in Group quarters - Long-term care (%)
People in Group quarters - Homes for abused, dependent, and neglected children (%)
People in Group quarters - Residential treatment centers for emotionally disturbed children (%)
People in Group quarters - Training schools for juvenile delinquents (%)
People in Group quarters - Short-term care, detention or diagnostic centers for delinquent children (%)
People in Group quarters - Type of juvenile institution unknown (%)
People in Group quarters - Noninstitutionalized population (%)
People in Group quarters - College dormitories (includes college quarters off campus) (%)
People in Group quarters - Military quarters (%)
People in Group quarters - On base (%)
People in Group quarters - Barracks, unaccompanied personnel housing (UPH), (Enlisted/Officer), ;and similar group living quarters for military personnel (%)
People in Group quarters - Transient quarters for temporary residents (%)
People in Group quarters - Military ships (%)
People in Group quarters - Group homes (%)
People in Group quarters - Homes or halfway houses for drug/alcohol abuse (%)
People in Group quarters - Homes for the mentally ill (%)
People in Group quarters - Homes for the mentally retarded (%)
People in Group quarters - Homes for the physically handicapped (%)
People in Group quarters - Other group homes (%)
People in Group quarters - Religious group quarters (%)
People in Group quarters - Dormitories (%)
People in Group quarters - Agriculture workers' dormitories on farms (%)
People in Group quarters - Job Corps and vocational training facilities (%)
People in Group quarters - Other workers' dormitories (%)
People in Group quarters - Crews of maritime vessels (%)
People in Group quarters - Other nonhousehold living situations (%)
People in Group quarters - Other noninstitutional group quarters (%)
Residents speaking English at home (%)
Residents speaking English at home - Born in the United States (%)
Residents speaking English at home - Native, born elsewhere (%)
Residents speaking English at home - Foreign born (%)
Residents speaking Spanish at home (%)
Residents speaking Spanish at home - Born in the United States (%)
Residents speaking Spanish at home - Native, born elsewhere (%)
Residents speaking Spanish at home - Foreign born (%)
Residents speaking other language at home (%)
Residents speaking other language at home - Born in the United States (%)
Residents speaking other language at home - Native, born elsewhere (%)
Residents speaking other language at home - Foreign born (%)
Class of Workers - Employee of private company (%)
Class of Workers - Self-employed in own incorporated business (%)
Class of Workers - Private not-for-profit wage and salary workers (%)
Class of Workers - Local government workers (%)
Class of Workers - State government workers (%)
Class of Workers - Federal government workers (%)
Class of Workers - Self-employed workers in own not incorporated business and Unpaid family workers (%)
House heating fuel used in houses and condos - Utility gas (%)
House heating fuel used in houses and condos - Bottled, tank, or LP gas (%)
House heating fuel used in houses and condos - Electricity (%)
House heating fuel used in houses and condos - Fuel oil, kerosene, etc. (%)
House heating fuel used in houses and condos - Coal or coke (%)
House heating fuel used in houses and condos - Wood (%)
House heating fuel used in houses and condos - Solar energy (%)
House heating fuel used in houses and condos - Other fuel (%)
House heating fuel used in houses and condos - No fuel used (%)
House heating fuel used in apartments - Utility gas (%)
House heating fuel used in apartments - Bottled, tank, or LP gas (%)
House heating fuel used in apartments - Electricity (%)
House heating fuel used in apartments - Fuel oil, kerosene, etc. (%)
House heating fuel used in apartments - Coal or coke (%)
House heating fuel used in apartments - Wood (%)
House heating fuel used in apartments - Solar energy (%)
House heating fuel used in apartments - Other fuel (%)
House heating fuel used in apartments - No fuel used (%)
Armed forces status - In Armed Forces (%)
Armed forces status - Civilian (%)
Armed forces status - Civilian - Veteran (%)
Armed forces status - Civilian - Nonveteran (%)
Fatal accidents locations in years 2005-2021
Fatal accidents locations in 2005
Fatal accidents locations in 2006
Fatal accidents locations in 2007
Fatal accidents locations in 2008
Fatal accidents locations in 2009
Fatal accidents locations in 2010
Fatal accidents locations in 2011
Fatal accidents locations in 2012
Fatal accidents locations in 2013
Fatal accidents locations in 2014
Fatal accidents locations in 2015
Fatal accidents locations in 2016
Fatal accidents locations in 2017
Fatal accidents locations in 2018
Fatal accidents locations in 2019
Fatal accidents locations in 2020
Fatal accidents locations in 2021
Alcohol use - People drinking some alcohol every month (%)
Alcohol use - People not drinking at all (%)
Alcohol use - Average days/month drinking alcohol
Alcohol use - Average drinks/week
Alcohol use - Average days/year people drink much
Audiometry - Average condition of hearing (%)
Audiometry - People that can hear a whisper from across a quiet room (%)
Audiometry - People that can hear normal voice from across a quiet room (%)
Audiometry - Ears ringing, roaring, buzzing (%)
Audiometry - Had a job exposure to loud noise (%)
Audiometry - Had off-work exposure to loud noise (%)
Blood Pressure & Cholesterol - Has high blood pressure (%)
Blood Pressure & Cholesterol - Checking blood pressure at home (%)
Blood Pressure & Cholesterol - Frequently checking blood cholesterol (%)
Blood Pressure & Cholesterol - Has high cholesterol level (%)
Consumer Behavior - Money monthly spent on food at supermarket/grocery store
Consumer Behavior - Money monthly spent on food at other stores
Consumer Behavior - Money monthly spent on eating out
Consumer Behavior - Money monthly spent on carryout/delivered foods
Consumer Behavior - Income spent on food at supermarket/grocery store (%)
Consumer Behavior - Income spent on food at other stores (%)
Consumer Behavior - Income spent on eating out (%)
Consumer Behavior - Income spent on carryout/delivered foods (%)
Current Health Status - General health condition (%)
Current Health Status - Blood donors (%)
Current Health Status - Has blood ever tested for HIV virus (%)
Current Health Status - Left-handed people (%)
Dermatology - People using sunscreen (%)
Diabetes - Diabetics (%)
Diabetes - Had a blood test for high blood sugar (%)
Diabetes - People taking insulin (%)
Diet Behavior & Nutrition - Diet health (%)
Diet Behavior & Nutrition - Milk product consumption (# of products/month)
Diet Behavior & Nutrition - Meals not home prepared (#/week)
Diet Behavior & Nutrition - Meals from fast food or pizza place (#/week)
Diet Behavior & Nutrition - Ready-to-eat foods (#/month)
Diet Behavior & Nutrition - Frozen meals/pizza (#/month)
Drug Use - People that ever used marijuana or hashish (%)
Drug Use - Ever used hard drugs (%)
Drug Use - Ever used any form of cocaine (%)
Drug Use - Ever used heroin (%)
Drug Use - Ever used methamphetamine (%)
Health Insurance - People covered by health insurance (%)
Kidney Conditions-Urology - Avg. # of times urinating at night
Medical Conditions - People with asthma (%)
Medical Conditions - People with anemia (%)
Medical Conditions - People with psoriasis (%)
Medical Conditions - People with overweight (%)
Medical Conditions - Elderly people having difficulties in thinking or remembering (%)
Medical Conditions - People who ever received blood transfusion (%)
Medical Conditions - People having trouble seeing even with glass/contacts (%)
Medical Conditions - People with arthritis (%)
Medical Conditions - People with gout (%)
Medical Conditions - People with congestive heart failure (%)
Medical Conditions - People with coronary heart disease (%)
Medical Conditions - People with angina pectoris (%)
Medical Conditions - People who ever had heart attack (%)
Medical Conditions - People who ever had stroke (%)
Medical Conditions - People with emphysema (%)
Medical Conditions - People with thyroid problem (%)
Medical Conditions - People with chronic bronchitis (%)
Medical Conditions - People with any liver condition (%)
Medical Conditions - People who ever had cancer or malignancy (%)
Mental Health - People who have little interest in doing things (%)
Mental Health - People feeling down, depressed, or hopeless (%)
Mental Health - People who have trouble sleeping or sleeping too much (%)
Mental Health - People feeling tired or having little energy (%)
Mental Health - People with poor appetite or overeating (%)
Mental Health - People feeling bad about themself (%)
Mental Health - People who have trouble concentrating on things (%)
Mental Health - People moving or speaking slowly or too fast (%)
Mental Health - People having thoughts they would be better off dead (%)
Oral Health - Average years since last visit a dentist
Oral Health - People embarrassed because of mouth (%)
Oral Health - People with gum disease (%)
Oral Health - General health of teeth and gums (%)
Oral Health - Average days a week using dental floss/device
Oral Health - Average days a week using mouthwash for dental problem
Oral Health - Average number of teeth
Pesticide Use - Households using pesticides to control insects (%)
Pesticide Use - Households using pesticides to kill weeds (%)
Physical Activity - People doing vigorous-intensity work activities (%)
Physical Activity - People doing moderate-intensity work activities (%)
Physical Activity - People walking or bicycling (%)
Physical Activity - People doing vigorous-intensity recreational activities (%)
Physical Activity - People doing moderate-intensity recreational activities (%)
Physical Activity - Average hours a day doing sedentary activities
Physical Activity - Average hours a day watching TV or videos
Physical Activity - Average hours a day using computer
Physical Functioning - People having limitations keeping them from working (%)
Physical Functioning - People limited in amount of work they can do (%)
Physical Functioning - People that need special equipment to walk (%)
Physical Functioning - People experiencing confusion/memory problems (%)
Physical Functioning - People requiring special healthcare equipment (%)
Prescription Medications - Average number of prescription medicines taking
Preventive Aspirin Use - Adults 40+ taking low-dose aspirin (%)
Reproductive Health - Vaginal deliveries (%)
Reproductive Health - Cesarean deliveries (%)
Reproductive Health - Deliveries resulted in a live birth (%)
Reproductive Health - Pregnancies resulted in a delivery (%)
Reproductive Health - Women breastfeeding newborns (%)
Reproductive Health - Women that had a hysterectomy (%)
Reproductive Health - Women that had both ovaries removed (%)
Reproductive Health - Women that have ever taken birth control pills (%)
Reproductive Health - Women taking birth control pills (%)
Reproductive Health - Women that have ever used Depo-Provera or injectables (%)
Reproductive Health - Women that have ever used female hormones (%)
Sexual Behavior - People 18+ that ever had sex (vaginal, anal, or oral) (%)
Sexual Behavior - Males 18+ that ever had vaginal sex with a woman (%)
Sexual Behavior - Males 18+ that ever performed oral sex on a woman (%)
Sexual Behavior - Males 18+ that ever had anal sex with a woman (%)
Sexual Behavior - Males 18+ that ever had any sex with a man (%)
Sexual Behavior - Females 18+ that ever had vaginal sex with a man (%)
Sexual Behavior - Females 18+ that ever performed oral sex on a man (%)
Sexual Behavior - Females 18+ that ever had anal sex with a man (%)
Sexual Behavior - Females 18+ that ever had any kind of sex with a woman (%)
Sexual Behavior - Average age people first had sex
Sexual Behavior - Average number of female sex partners in lifetime (males 18+)
Sexual Behavior - Average number of female vaginal sex partners in lifetime (males 18+)
Sexual Behavior - Average age people first performed oral sex on a woman (18+)
Sexual Behavior - Average number of woman performed oral sex on in lifetime (18+)
Sexual Behavior - Average number of male sex partners in lifetime (males 18+)
Sexual Behavior - Average number of male anal sex partners in lifetime (males 18+)
Sexual Behavior - Average age people first performed oral sex on a man (18+)
Sexual Behavior - Average number of male oral sex partners in lifetime (18+)
Sexual Behavior - People using protection when performing oral sex (%)
Sexual Behavior - Average number of times people have vaginal or anal sex a year
Sexual Behavior - People having sex without condom (%)
Sexual Behavior - Average number of male sex partners in lifetime (females 18+)
Sexual Behavior - Average number of male vaginal sex partners in lifetime (females 18+)
Sexual Behavior - Average number of female sex partners in lifetime (females 18+)
Sexual Behavior - Circumcised males 18+ (%)
Sleep Disorders - Average hours sleeping at night
Sleep Disorders - People that has trouble sleeping (%)
Smoking-Cigarette Use - People smoking cigarettes (%)
Taste & Smell - People 40+ having problems with smell (%)
Taste & Smell - People 40+ having problems with taste (%)
Taste & Smell - People 40+ that ever had wisdom teeth removed (%)
Taste & Smell - People 40+ that ever had tonsils teeth removed (%)
Taste & Smell - People 40+ that ever had a loss of consciousness because of a head injury (%)
Taste & Smell - People 40+ that ever had a broken nose or other serious injury to face or skull (%)
Taste & Smell - People 40+ that ever had two or more sinus infections (%)
Weight - Average height (inches)
Weight - Average weight (pounds)
Weight - Average BMI
Weight - People that are obese (%)
Weight - People that ever were obese (%)
Weight - People trying to lose weight (%)
100%
urban population.
Estimated median house/condo value in 2022: $112,461
44120:
$112,461Ohio:
$204,100
According to our research of Ohio and other state lists, there were 75 registered sex offenders living in 44120 zip code as of May 23, 2024 . The ratio of all residents to sex offenders in zip code 44120 is 461 to 1.The ratio of registered sex offenders to all residents in this zip code is near the state average.
Median resident age: This zip code:
43.4 yearsOhio median age:
39.9 years
Average household size: This zip code:
2.0 peopleOhio:
2.4 people
Averages for the 2020 tax year for zip code 44120, filed in 2021:
Average Adjusted Gross Income (AGI) in 2020: $68,424 (Individual Income Tax Returns) Here:
$68,424State:
$67,288
Salary/wage: $54,101 (reported on 82.4% of returns )Here:
$54,101State:
$55,628
(% of AGI for various income ranges: 1120.1% for AGIs below $25k , 3515.1% for AGIs $25k-50k , 6629.6% for AGIs $50k-75k , 10145.0% for AGIs $75k-100k , 19966.7% for AGIs $100k-200k , 110357.5% for AGIs over 200k ) Taxable interest for individuals: $2,352 (reported on 18.1% of returns )This zip code:
$2,352Ohio:
$1,518
(% of AGI for various income ranges: 6.9% for AGIs below $25k , 6.0% for AGIs $25k-50k , 25.2% for AGIs $50k-75k , 59.8% for AGIs $75k-100k , 161.4% for AGIs $100k-200k , 1872.5% for AGIs over 200k ) Ordinary dividends: $20,011 (reported on 14.8% of returns )(% of AGI for various income ranges: 13.6% for AGIs below $25k , 24.9% for AGIs $25k-50k , 88.6% for AGIs $50k-75k , 208.9% for AGIs $75k-100k , 816.2% for AGIs $100k-200k , 15555.0% for AGIs over 200k ) Net capital gain/loss in AGI: +$40,531 (reported on 13.3% of returns )Here:
+$40,531State:
+$18,919
(% of AGI for various income ranges: 9.2% for AGIs below $25k , 21.6% for AGIs $25k-50k , 78.0% for AGIs $50k-75k , 205.9% for AGIs $75k-100k , 858.3% for AGIs $100k-200k , 31261.7% for AGIs over 200k ) Profit/loss from business: +$10,404 (reported on 17.5% of returns )Here:
+$10,404State:
+$13,744
(% of AGI for various income ranges: 53.7% for AGIs below $25k , 55.5% for AGIs $25k-50k , 151.1% for AGIs $50k-75k , 439.8% for AGIs $75k-100k , 957.2% for AGIs $100k-200k , 5803.8% for AGIs over 200k ) Taxable individual retirement arrangement distribution: $28,177 (reported on 5.9% of returns )44120:
$28,177Ohio:
$18,876
(% of AGI for various income ranges: 18.8% for AGIs below $25k , 41.2% for AGIs $25k-50k , 193.2% for AGIs $50k-75k , 300.0% for AGIs $75k-100k , 1164.5% for AGIs $100k-200k , 5244.2% for AGIs over 200k ) Self-employed (Keogh) retirement plans: $29,520 (reported on 1.0% of returns )44120:
$29,520Ohio:
$24,898
(% of AGI for various income ranges: 4.6% for AGIs below $25k , 72.4% for AGIs $100k-200k , 1570.4% for AGIs over 200k ) Total itemized deductions: $49,944 (reported on 6.6% of returns )Here:
$49,944State:
$33,869
(% of AGI for various income ranges: 19.4% for AGIs below $25k , 76.9% for AGIs $25k-50k , 316.0% for AGIs $50k-75k , 531.7% for AGIs $75k-100k , 1005.9% for AGIs $100k-200k , 14514.6% for AGIs over 200k ) Charity contributions: $33,356 (reported on 5.8% of returns )Here:
$33,356State:
$14,577
(% of AGI for various income ranges: 1.3% for AGIs below $25k , 14.6% for AGIs $25k-50k , 66.7% for AGIs $50k-75k , 155.4% for AGIs $75k-100k , 314.1% for AGIs $100k-200k , 10752.9% for AGIs over 200k ) Taxes paid: $7,973 (reported on 6.6% of returns )(% of AGI for various income ranges: 2.5% for AGIs below $25k , 14.9% for AGIs $25k-50k , 81.7% for AGIs $50k-75k , 172.2% for AGIs $75k-100k , 333.3% for AGIs $100k-200k , 1559.2% for AGIs over 200k ) Earned income credit: $2,515 (reported on 26.7% of returns )(% of AGI for various income ranges: 142.5% for AGIs below $25k , 82.2% for AGIs $25k-50k ) Percentage of individuals using paid preparers for their 2020 taxes: 92.5%(% for various income ranges: 92.7% for AGIs below $25k , 93.0% for AGIs $25k-50k , 92.2% for AGIs $50k-75k , 88.5% for AGIs $75k-100k , 90.8% for AGIs $100k-200k , 94.4% for AGIs over 200k )
Averages for the 2012 tax year for zip code 44120, filed in 2013:
Average Adjusted Gross Income (AGI) in 2012: $57,937 (Individual Income Tax Returns) Here:
$57,937State:
$54,926
Salary/wage: $45,352 (reported on 83.5% of returns )Here:
$45,352State:
$45,869
(% of AGI for various income ranges: 77.5% for AGIs below $25k , 81.6% for AGIs $25k-50k , 77.1% for AGIs $50k-75k , 71.2% for AGIs $75k-100k , 69.3% for AGIs $100k-200k , 51.4% for AGIs over 200k ) Taxable interest for individuals: $2,365 (reported on 20.1% of returns )This zip code:
$2,365Ohio:
$1,297
(% of AGI for various income ranges: 0.4% for AGIs below $25k , 0.3% for AGIs $25k-50k , 0.5% for AGIs $50k-75k , 0.4% for AGIs $75k-100k , 0.7% for AGIs $100k-200k , 1.3% for AGIs over 200k ) Ordinary dividends: $14,512 (reported on 14.5% of returns )(% of AGI for various income ranges: 0.9% for AGIs below $25k , 0.6% for AGIs $25k-50k , 1.2% for AGIs $50k-75k , 1.8% for AGIs $75k-100k , 3.6% for AGIs $100k-200k , 6.3% for AGIs over 200k ) Net capital gain/loss in AGI: +$28,115 (reported on 11.3% of returns )Here:
+$28,115State:
+$11,232
(% of AGI for various income ranges: 0.2% for AGIs below $25k , 0.2% for AGIs $25k-50k , 0.5% for AGIs $50k-75k , 0.4% for AGIs $75k-100k , 2.4% for AGIs $100k-200k , 11.9% for AGIs over 200k ) Profit/loss from business: +$11,210 (reported on 16.0% of returns )Here:
+$11,210State:
+$12,773
(% of AGI for various income ranges: 9.6% for AGIs below $25k , 0.9% for AGIs $25k-50k , 0.8% for AGIs $50k-75k , 2.2% for AGIs $75k-100k , 3.6% for AGIs $100k-200k , 2.7% for AGIs over 200k ) Taxable individual retirement arrangement distribution: $23,690 (reported on 6.7% of returns )44120:
$23,690Ohio:
$14,511
(% of AGI for various income ranges: 1.2% for AGIs below $25k , 1.2% for AGIs $25k-50k , 2.6% for AGIs $50k-75k , 3.0% for AGIs $75k-100k , 4.1% for AGIs $100k-200k , 3.2% for AGIs over 200k ) Self-employment retirement plans: $39,953 (reported on 1.0% of returns )44120:
$39,953Ohio:
$20,257
(% of AGI for various income ranges: 0.2% for AGIs below $25k , 0.5% for AGIs $100k-200k , 1.4% for AGIs over 200k ) Total itemized deductions: $33,254 (20% of AGI, reported on 23.4% of returns )Here:
$33,254State:
$21,278
Here:
19.5% of AGIState:
18.8% of AGI
(% of AGI for various income ranges: 3.6% for AGIs below $25k , 7.2% for AGIs $25k-50k , 12.5% for AGIs $50k-75k , 15.6% for AGIs $75k-100k , 18.6% for AGIs $100k-200k , 16.2% for AGIs over 200k ) Charity contributions: $7,723 (reported on 20.2% of returns )(% of AGI for various income ranges: 0.4% for AGIs below $25k , 1.2% for AGIs $25k-50k , 2.2% for AGIs $50k-75k , 2.4% for AGIs $75k-100k , 2.9% for AGIs $100k-200k , 3.9% for AGIs over 200k ) Taxes paid: $17,340 (reported on 23.3% of returns )44120:
$17,340State:
$9,568
(% of AGI for various income ranges: 1.0% for AGIs below $25k , 2.5% for AGIs $25k-50k , 5.0% for AGIs $50k-75k , 7.4% for AGIs $75k-100k , 10.0% for AGIs $100k-200k , 9.4% for AGIs over 200k ) Earned income credit: $2,610 (reported on 31.8% of returns )(% of AGI for various income ranges: 11.6% for AGIs below $25k , 1.1% for AGIs $25k-50k ) Percentage of individuals using paid preparers for their 2012 taxes: 45.4%(% for various income ranges: 41.0% for AGIs below $25k , 42.3% for AGIs $25k-50k , 51.9% for AGIs $50k-75k , 54.5% for AGIs $75k-100k , 56.9% for AGIs $100k-200k , 75.4% for AGIs over 200k )
Averages for the 2004 tax year for zip code 44120, filed in 2005:
Average Adjusted Gross Income (AGI) in 2004: $47,626 (Individual Income Tax Returns) Here:
$47,626State:
$44,480
Salary/wage: $39,547 (reported on 84.9% of returns )Here:
$39,547State:
$39,198
(% of AGI for various income ranges: 99.4% for AGIs below $10k , 82.0% for AGIs $10k-25k , 84.9% for AGIs $25k-50k , 78.6% for AGIs $50k-75k , 75.8% for AGIs $75k-100k , 59.1% for AGIs over 100k ) Taxable interest for individuals: $2,248 (reported on 29.0% of returns )This zip code:
$2,248Ohio:
$1,532
(% of AGI for various income ranges: 2.4% for AGIs below $10k , 0.7% for AGIs $10k-25k , 0.6% for AGIs $25k-50k , 0.9% for AGIs $50k-75k , 1.4% for AGIs $75k-100k , 1.8% for AGIs over 100k ) Taxable dividends: $8,867 (reported on 17.6% of returns )(% of AGI for various income ranges: 3.3% for AGIs below $10k , 0.8% for AGIs $10k-25k , 0.9% for AGIs $25k-50k , 1.5% for AGIs $50k-75k , 2.2% for AGIs $75k-100k , 5.2% for AGIs over 100k ) Net capital gain/loss: +$25,036 (reported on 13.6% of returns )Here:
+$25,036State:
+$8,582
(% of AGI for various income ranges: -0.4% for AGIs below $10k , 0.2% for AGIs $10k-25k , 0.4% for AGIs $25k-50k , 0.8% for AGIs $50k-75k , 1.7% for AGIs $75k-100k , 13.5% for AGIs over 100k ) Profit/loss from business: +$11,577 (reported on 12.3% of returns )Here:
+$11,577State:
+$10,813
(% of AGI for various income ranges: 8.2% for AGIs below $10k , 3.9% for AGIs $10k-25k , 1.1% for AGIs $25k-50k , 1.6% for AGIs $50k-75k , 2.8% for AGIs $75k-100k , 3.6% for AGIs over 100k ) IRA payment deduction: $2,403 (reported on 1.4% of returns )(% of AGI for various income ranges: 0.1% for AGIs $10k-25k , 0.1% for AGIs $25k-50k , 0.1% for AGIs $50k-75k , 0.1% for AGIs $75k-100k , 0.0% for AGIs over 100k ) Self-employed pension: $19,650 (reported on 1.1% of returns )(% of AGI for various income ranges: 0.1% for AGIs $10k-25k , 0.1% for AGIs $50k-75k , 0.2% for AGIs $75k-100k , 0.8% for AGIs over 100k ) Total itemized deductions: $25,291 (21% of AGI, reported on 28.1% of returns )Here:
$25,291State:
$17,503
Here:
21.4% of AGIState:
20.8% of AGI
(% of AGI for various income ranges: 9.2% for AGIs below $10k , 6.5% for AGIs $10k-25k , 10.4% for AGIs $25k-50k , 17.0% for AGIs $50k-75k , 20.8% for AGIs $75k-100k , 17.4% for AGIs over 100k ) Charity contributions deductions: $6,721 (5% of AGI, reported on 24.7% of returns )Here:
5.2% of AGIState:
3.4% of AGI
(% of AGI for various income ranges: 0.7% for AGIs below $10k , 0.8% for AGIs $10k-25k , 1.9% for AGIs $25k-50k , 3.1% for AGIs $50k-75k , 3.7% for AGIs $75k-100k , 4.8% for AGIs over 100k ) Total tax: $10,243 (reported on 64.7% of returns )44120:
$10,243State:
$6,781
(% of AGI for various income ranges: 2.5% for AGIs below $10k , 3.2% for AGIs $10k-25k , 6.7% for AGIs $25k-50k , 10.2% for AGIs $50k-75k , 11.2% for AGIs $75k-100k , 20.5% for AGIs over 100k ) Earned income credit: $2,004 (reported on 30.1% of returns )Percentage of individuals using paid preparers for their 2004 taxes: 55.4%(% for various income ranges: 51.4% for AGIs below $10k , 59.2% for AGIs $10k-25k , 51.4% for AGIs $25k-50k , 57.1% for AGIs $50k-75k , 52.9% for AGIs $75k-100k , 64.8% for AGIs over 100k )
Estimated median household income in 2022: This zip code:
$42,496Ohio:
$65,720
Nearest zip codes: 44118 ,
44106 ,
44104 ,
44128 ,
44105 ,
44112 .
Shaker Heights Zip Code Map
Percentage of family households: This zip code:
29.0%Ohio:
43.3%
Percentage of households with unmarried partners: This zip code:
3.5%Ohio:
44.6%
Likely homosexual households (counted as self-reported same-sex unmarried-partner households)
Lesbian couples: 0.2% of all households Gay men: 0.3% of all households
Household received Food Stamps/SNAP in the past 12 months: 3,422Household did not receive Food Stamps/SNAP in the past 12 months: 13,638
Women who had a birth in the past 12 months: 517 (146 now married , 359 unmarried) Women who did not have a birth in the past 12 months: 7,020 (1,485 now married , 5,540 unmarried)
Housing units in zip code 44120 with a mortgage: 4,301 (417
second mortgage , 9
home equity loan , 262
both second mortgage and home equity loan )
Houses without a mortgage: 204
Median monthly owner costs for units with a mortgage: $1,274
Median monthly owner costs for units without a mortgage: $656
Residents with income below the poverty level in 2022:
This zip code:
21.8%Whole state:
13.4%
Residents with income below 50% of the poverty level in 2022:
This zip code:
11.1%Whole state:
7.0%
Median number of rooms in houses and condos: Median number of rooms in apartments: Notable locations in this zip code not listed on our city pages
Click to draw/clear zip code borders Notable locations in zip code 44120: (A) , Shaker Heights Fire Department Station 1 (B) , Mount Pleasant Branch Cleveland Public Library (C) , Rice Branch Library (D) , Shaker Heights City Hall (E) . Display/hide their locations on the map
Shopping Centers: (1) , Shaker-Moreland Shopping Center (2) , Chagrin-Lee-Avalon Shopping Center (3) . Display/hide their locations on the map
Churches in zip code 44120 include: (A) , Saint Pauls United Church of Christ (B) , First Magyar Presbyterian Church (C) , Our Lady of Peace Catholic Church (D) , Plymouth Church (E) , Second Tabernacle Baptist Church (F) , Mount Pleasant Baptist Church (G) , Saint Cecilias Catholic Church (H) . Display/hide their locations on the map
Cemetery: (1) . Display/hide its location on the map
Reservoirs: (A) , Green Lake (B) , Upper Shaker Lake (C) . Display/hide their locations on the map
Parks in zip code 44120 include: (1) , Shaker Square Historic District (2) , Fairhill Road Village Historic District (3) , Shaker Square (4) . Display/hide their locations on the map
Year house built (houses)
16 2020 or later250 2010 to 2019527 2000 to 2009348 1990 to 1999456 1980 to 1989729 1970 to 19791,582 1960 to 19692,354 1950 to 19593,393 1940 to 194910,676 1939 or earlier
Zip code 44120 household income distribution in 2022 2,319 Less than $10,0001,252 $10,000 to $14,9991,138 $15,000 to $19,999904 $20,000 to $24,9991,092 $25,000 to $29,999759 $30,000 to $34,999751 $35,000 to $39,999688 $40,000 to $44,999693 $45,000 to $49,9991,165 $50,000 to $59,9991,311 $60,000 to $74,9991,647 $75,000 to $99,999815 $100,000 to $124,999599 $125,000 to $149,999786 $150,000 to $199,9991,215 $200,000 or moreEstimate of home value of owner-occupied houses/condos in 2022 in zip code 44120 209 Less than $10,00092 $10,000 to $14,99944 $15,000 to $19,99968 $20,000 to $24,999102 $25,000 to $29,999216 $30,000 to $34,999169 $35,000 to $39,999430 $40,000 to $49,999554 $50,000 to $59,999448 $60,000 to $69,999376 $70,000 to $79,999474 $80,000 to $89,999321 $90,000 to $99,999489 $100,000 to $124,999261 $125,000 to $149,999441 $150,000 to $174,999152 $175,000 to $199,999751 $200,000 to $249,999565 $250,000 to $299,999746 $300,000 to $399,999215 $400,000 to $499,999447 $500,000 to $749,999209 $750,000 to $999,99934 $1,000,000 to $1,499,99918 $2,000,000 or moreRent paid by renters in 2022 in zip code 44120 55 $100 to $14980 $150 to $199189 $200 to $249283 $250 to $299168 $300 to $349132 $350 to $399325 $400 to $449461 $450 to $499312 $500 to $549445 $550 to $599591 $600 to $649442 $650 to $699528 $700 to $749664 $750 to $7991,052 $800 to $899663 $900 to $999863 $1,000 to $1,249590 $1,250 to $1,499146 $1,500 to $1,99953 $2,000 to $2,499148 $2,500 to $2,999402 No cash rent
Median gross rent in 2022: $894.
Median price asked for vacant for-sale houses and condos in 2022: $155,034.
Estimated median house (or condo) value in 2022 for: White Non-Hispanic householders: $281,618Black or African American householders: $95,292Asian householders: $247,946Two or more races householders: $185,128Hispanic or Latino householders: $118,316Estimated median house or condo value in 2022: $112,461
44120:
$112,461Ohio:
$204,100
Lower value quartile - upper value quartile: $62,765 - $268,180
Mean price in 2022: Detached houses: $243,002Here:
$243,002State:
$254,366
Townhouses or other attached units: $82,576Here:
$82,576State:
$225,733
In 2-unit structures: $186,246Here:
$186,246State:
$144,384
In 3-to-4-unit structures: $117,656Here:
$117,656State:
$203,002
In 5-or-more-unit structures: $135,550Here:
$135,550State:
$211,593
Housing units in structures:
One, detached: 9,907One, attached: 1,043Two: 3,0163 or 4: 9155 to 9: 1,31810 to 19: 1,05620 to 49: 1,45450 or more: 1,890Mobile homes: 124Unemployment : 6.5%
Means of transportation to work in zip code 44120 64.8% 9,505 Drove a car alone7.0% 1,020 Carpooled6.2% 909 Bus or trolley bus1.4% 200 Streetcar or trolley car0.2% 33 Subway or elevated0.4% 62 Railroad0.0% 3 Taxi0.2% 32 Bicycle1.5% 226 Walked1.1% 167 Other means16.7% 2,449 Worked at homeTravel time to work (commute) in zip code 44120 195 Less than 5 minutes441 5 to 9 minutes1,434 10 to 14 minutes2,272 15 to 19 minutes2,712 20 to 24 minutes1,215 25 to 29 minutes2,214 30 to 34 minutes434 35 to 39 minutes400 40 to 44 minutes484 45 to 59 minutes392 60 to 89 minutes170 90 or more minutes
Neighborhoods in zip code 44120: Percentage of zip code residents living and working in this county: 94.5%
Household type by relationship:
Households: 33,996
Male householders: 6,481 (3,173 living alone ), Female householders: 10,571 (5,390 living alone )3,847 spouses (3,777 opposite-sex spouses ), 686 unmarried partners , (670 opposite-sex unmarried partners ), 9,271 children (8,878 natural , 168 adopted , 230 stepchildren ), 1,222 grandchildren , 419 brothers or sisters , 262 parents , 48 foster children , 349 other relatives , 713 non-relatives In group quarters: 183 (-1 institutionalized population )
Size of family households: 3,866 2-persons , 1,654 3-persons , 1,301 4-persons , 578 5-persons , 153 6-persons , 52 7-or-more-persons
Size of nonfamily households: 8,575 1-person , 760 2-persons , 74 3-persons , 34 4-persons , 33 5-persons
2,318 married couples with children. single-parent households (796 men , 2,228 women ).
93.3% of residents of 44120 zip code speak English at home. of residents speak Spanish at home (57% very well, 25% well, 8% not well, 10% not at all ).of residents speak other Indo-European language at home (88% very well, 11% well, 1% not well ).of residents speak Asian or Pacific Island language at home (49% very well, 30% well, 21% not well ).of residents speak other language at home (85% very well, 12% well, 2% not well ).
Foreign born population: 1,721 (5.1%)
(48.9%
of them are naturalized citizens )
This zip code:
5.1%Whole state:
5.0%
9% Bhutan 8% Haiti 7% Ethiopia 5% Sudan 4% Sweden 4% United Kingdom, excluding England and Scotland 3% France 2% African 2% American 2% English 2% European 1% German 1% Irish 1% Italian
Year of entry for the foreign-born population
1,046 2010 or later 323 2000 to 2009 239 1990 to 1999 340 Before 1990
There are
251 Other Medical Specialists in Zip Code 44120.
Facilities with environmental interests located in this zip code:
BP OIL CO NO 04922 * (13165 LARCHMERE AVE in SHAKER HEIGHTS, OH)
AIR MINOR (AIRS/AFS) STATE MASTER (Ohio general info) - -18-5541-905-24, EPCRA, RCRA-OHD987027166, HAZARDOUS WASTE PROGRAM Conditionally Exempt Small Quantity Generators, less than 100 kg/month of hazardous waste (Resource Conservation and Recovery Act (tracking hazardous waste)) - notification Business SIC classification: GASOLINE SERVICE STATIONSOrganizations: BP OIL COMPANY (CONTACT/OWNER)
Alternative names: BP OIL CO SITE 04922
BOULEVARD ELEMENTARY SCHOOL (14900 DREXMORE RD in SHAKER HEIGHTS, OH)
(Geographic Names Information System) (National Center for Education Statistics) - STATE ID-003244 Organizations: SHAKER HEIGHTS CITY SD (SCHOOL DISTRICT)
ALEXANDER HAMILTON JUNIOR HIGH SCHOOL (3465 E 130TH ST in CLEVELAND, OH)
STATE MASTER (Ohio general info) - AIR MAJOR, RCRA-OHD986984441, HAZARDOUS WASTE PROGRAM Small Quantity Generators, between 100 kg and 1000 kg of hazardous waste/month (Resource Conservation and Recovery Act (tracking hazardous waste)) - notification Organizations: CLEVELAND BD OF ED (CONTACT/OWNER)
Alternative names: HAMILTON ALEXANDER
ANDREW J RICKOFF SCHOOL (3500 EAST 147TH STREET in CLEVELAND, OH)
STATE MASTER (Ohio general info) - AIR MAJOR, RCRA-OHD986984466, HAZARDOUS WASTE PROGRAM Small Quantity Generators, between 100 kg and 1000 kg of hazardous waste/month (Resource Conservation and Recovery Act (tracking hazardous waste)) - notification Organizations: CLEVELAND BD OF ED (CONTACT/OWNER)
Alternative names: ANDREW J RICKOFF elementary school, RICKOFF ANDREW J
ANTHONY WAYNE ELEMENTARY SCHOOL (11711 WOODLAND AVE in CLEVELAND, OH)
STATE MASTER (Ohio general info) - AIR MAJOR, RCRA-OHD986984474, HAZARDOUS WASTE PROGRAM Small Quantity Generators, between 100 kg and 1000 kg of hazardous waste/month (Resource Conservation and Recovery Act (tracking hazardous waste)) - notification Organizations: CLEVELAND BD OF ED (CONTACT/OWNER)
Alternative names: WAYNE ANTHONY
ALEXANDER HAMILTON MIDDLE SCH (3465 E 130TH ST in CLEVELAND, OH)
(National Center for Education Statistics) - STATE ID-000307 Organizations: CLEVELAND MUNICIPAL SD (SCHOOL DISTRICT)
BP OIL CO (17009 CHAGRIN BLVD in SHAKER HEIGHTS, OH)
(Resource Conservation and Recovery Act (tracking hazardous waste))
ABANDONED GAS STATION (11601 SHAKER BLVD in CLEVELAND, OH)
(Resource Conservation and Recovery Act (tracking hazardous waste)) Organizations: PRIMA MARKETING LLC (CONTACT/OWNER)
B AND E AUTO BODY INC (15215 TO 21 KINSMAN in CLEVELAND, OH)
Small Quantity Generators, between 100 kg and 1000 kg of hazardous waste/month (Resource Conservation and Recovery Act (tracking hazardous waste)) - notification Organizations: PINNIX ERNIE (CONTACT/OWNER)
Housing units lacking complete plumbing facilities: 6.7%
Housing units lacking complete kitchen facilities: 9.8%
80.1% Utility gas 13.7% Electricity 3.3% No fuel used 1.6% Other fuel 1.2% Bottled, tank, or LP gas
Population in 1990: 49,357.
Place of birth for U.S.-born residents:
This state: 24,248Northeast: 1,509Midwest: 1,536South: 4,341West: 403
58% of the 44120 zip code residents lived in the same house 5 years ago.
Out of people who lived in different houses, 83% lived in this county.
Out of people who lived in different counties, 50% lived in Ohio.
89% of the 44120 zip code residents lived in the same house 1 year ago.
Out of people who lived in different houses, 59% moved from this county.
Out of people who lived in different houses, 9% moved from different county within same state.
Out of people who lived in different houses, 25% moved from different state.
Out of people who lived in different houses, 5% moved from abroad.
Private vs. public school enrollment:
Students in private schools in grades 1 to 8 (elementary and middle school): 329
Students in private schools in grades 9 to 12 (high school): 155
Students in private undergraduate colleges: 228
Occupation by median earnings in the past 12 months ($)
137,503 Legal occupations 109,090 Architecture and engineering occupations 81,256 Management occupations 76,144 Computer and mathematical occupations 74,542 Business and financial operations occupations 71,912 Health diagnosing and treating practitioners and other technical occupations
Companies with federal contracts located in this zip code:
JME INC (17210 PARKLAND DR in SHAKER HEIGHTS, OH; small business) in 4 contracts from 2005 to 2006
$250,000 with Navy for Other Defense -- Applied Research and Exploratory Development (R&D). Signed on 2005-11-02. Completion date: 2007-10-26.
, same as above. Signed on 2006-06-19. Completion date: 2007-11-02.
, same as above. Signed on 2006-04-17. Completion date: 2007-11-02.
, same as above. Signed on 2005-12-29. Completion date: 2007-11-02.
Top industries in this zip code by the number of employees in 2005:
Accommodation and Food Services: Limited-Service Restaurants (50-99 employees: 1 establishment, 20-49 employees: 6 establishments, 10-19 employees: 7 establishments, 5-9 employees: 3 establishments, 1-4 employees: 10 establishments)Health Care and Social Assistance: Nursing Care Facilities (250-499: 1)Health Care and Social Assistance: Home Health Care Services (100-249: 1, 50-99: 1, 20-49: 1, 10-19: 1, 5-9: 2, 1-4: 1)Health Care and Social Assistance: Child Day Care Services (100-249: 1, 10-19: 2, 5-9: 5, 1-4: 4)Accommodation and Food Services: Full-Service Restaurants (50-99: 1, 20-49: 3, 10-19: 2, 5-9: 4, 1-4: 3)Health Care and Social Assistance: Other Individual and Family Services (100-249: 1, 20-49: 1, 10-19: 1, 5-9: 1)Other Services (except Public Administration): Religious Organizations (20-49: 3, 10-19: 3, 5-9: 4, 1-4: 6)Arts, Entertainment, and Recreation: Fitness and Recreational Sports Centers (100-249: 1, 1-4: 1)Professional, Scientific, and Technical Services: Architectural Services (50-99: 1, 20-49: 1, 5-9: 2, 1-4: 3)
People in group quarters in 2010:
63 people in group homes intended for adults
24 people in emergency and transitional shelters (with sleeping facilities) for people experiencing homelessness
8 people in residential treatment centers for adults
5 people in local jails and other municipal confinement facilities
3 people in workers' group living quarters and job corps centers
People in group quarters in 2000:
233 people in nursing homes
46 people in other noninstitutional group quarters
38 people in homes or halfway houses for drug/alcohol abuse
31 people in homes for the mentally retarded
23 people in homes for the mentally ill
16 people in wards in general hospitals for patients who have no usual home elsewhere
10 people in local jails and other confinement facilities (including police lockups)
8 people in religious group quarters
Fatal accident statistics in 2013:
Fatal accident count: 1Vehicles involved in fatal accidents: 1Fatal accidents caused by drunken drivers: 1Fatalities: 1Persons involved in fatal accidents: 1Pedestrians involved in fatal accidents: 1
Fatal accident statistics in 2011:
Fatal accident count: 1Vehicles involved in fatal accidents: 1Fatal accidents caused by drunken drivers: 0Fatalities: 1Persons involved in fatal accidents: 1Pedestrians involved in fatal accidents: 0
Home Mortgage Disclosure Act Aggregated Statistics For Year 2009(Based on 18 full and 22 partial tracts) A) FHA, FSA/RHS & VA B) Conventional C) Refinancings D) Home Improvement Loans E) Loans on Dwellings For 5+ Families F) Non-occupant Loans on G) Loans On Manufactured Number Average Value Number Average Value Number Average Value Number Average Value Number Average Value Number Average Value Number Average Value
LOANS ORIGINATED 89 $109,649 144 $208,471 418 $207,272 109 $24,408 5 $622,570 41 $57,720 0 $0 APPLICATIONS APPROVED, NOT ACCEPTED 4 $79,542 14 $150,659 71 $174,855 36 $30,830 0 $0 18 $65,286 0 $0 APPLICATIONS DENIED 31 $86,887 31 $212,398 302 $125,663 235 $17,816 0 $0 75 $58,575 2 $28,600 APPLICATIONS WITHDRAWN 21 $106,031 20 $159,620 124 $165,903 17 $23,772 0 $0 16 $80,794 0 $0 FILES CLOSED FOR INCOMPLETENESS 6 $83,485 3 $254,187 51 $141,732 7 $36,481 0 $0 9 $66,270 0 $0
Aggregated Statistics For Year 2008(Based on 18 full and 22 partial tracts) A) FHA, FSA/RHS & VA B) Conventional C) Refinancings D) Home Improvement Loans E) Loans on Dwellings For 5+ Families F) Non-occupant Loans on G) Loans On Manufactured Number Average Value Number Average Value Number Average Value Number Average Value Number Average Value Number Average Value Number Average Value
LOANS ORIGINATED 111 $116,738 272 $180,697 345 $145,285 158 $28,329 5 $1,980,000 149 $81,856 1 $11,900 APPLICATIONS APPROVED, NOT ACCEPTED 11 $83,538 32 $145,188 79 $123,433 38 $18,480 1 $160,000 24 $68,029 0 $0 APPLICATIONS DENIED 42 $102,486 58 $111,470 554 $99,267 400 $28,947 4 $531,500 199 $62,945 3 $22,790 APPLICATIONS WITHDRAWN 20 $100,586 33 $110,575 146 $131,368 10 $16,708 0 $0 40 $66,644 1 $10,000 FILES CLOSED FOR INCOMPLETENESS 6 $85,270 10 $130,547 28 $126,004 10 $31,516 0 $0 11 $75,534 0 $0
Aggregated Statistics For Year 2007(Based on 18 full and 22 partial tracts) A) FHA, FSA/RHS & VA B) Conventional C) Refinancings D) Home Improvement Loans E) Loans on Dwellings For 5+ Families F) Non-occupant Loans on G) Loans On Manufactured Number Average Value Number Average Value Number Average Value Number Average Value Number Average Value Number Average Value Number Average Value
LOANS ORIGINATED 57 $107,917 542 $146,693 610 $126,904 243 $38,213 18 $416,728 327 $82,889 0 $0 APPLICATIONS APPROVED, NOT ACCEPTED 7 $115,273 129 $100,528 176 $110,770 70 $27,899 1 $193,410 80 $84,913 0 $0 APPLICATIONS DENIED 26 $88,006 510 $93,754 892 $113,281 414 $35,851 8 $555,212 467 $79,564 7 $92,649 APPLICATIONS WITHDRAWN 6 $122,277 100 $108,676 227 $124,538 27 $44,623 1 $2,400,000 76 $76,795 0 $0 FILES CLOSED FOR INCOMPLETENESS 0 $0 33 $165,535 82 $112,808 5 $115,578 0 $0 28 $94,597 0 $0
Aggregated Statistics For Year 2006(Based on 18 full and 22 partial tracts) A) FHA, FSA/RHS & VA B) Conventional C) Refinancings D) Home Improvement Loans E) Loans on Dwellings For 5+ Families F) Non-occupant Loans on G) Loans On Manufactured Number Average Value Number Average Value Number Average Value Number Average Value Number Average Value Number Average Value Number Average Value
LOANS ORIGINATED 45 $119,512 1,102 $123,800 842 $117,407 214 $47,950 9 $886,556 647 $85,120 2 $25,855 APPLICATIONS APPROVED, NOT ACCEPTED 3 $105,923 239 $101,303 182 $106,578 42 $47,117 4 $131,775 158 $84,643 0 $0 APPLICATIONS DENIED 13 $81,817 857 $90,007 1,143 $114,183 385 $35,257 12 $626,636 563 $90,594 3 $83,380 APPLICATIONS WITHDRAWN 5 $154,600 335 $95,005 379 $115,630 30 $65,969 2 $248,785 207 $84,623 2 $145,415 FILES CLOSED FOR INCOMPLETENESS 0 $0 52 $95,910 81 $112,729 4 $64,520 1 $1,213,130 39 $88,388 0 $0
Aggregated Statistics For Year 2005(Based on 18 full and 22 partial tracts) A) FHA, FSA/RHS & VA B) Conventional C) Refinancings D) Home Improvement Loans E) Loans on Dwellings For 5+ Families F) Non-occupant Loans on G) Loans On Manufactured Number Average Value Number Average Value Number Average Value Number Average Value Number Average Value Number Average Value Number Average Value
LOANS ORIGINATED 60 $108,544 1,144 $126,915 1,340 $111,529 230 $49,639 13 $482,382 708 $87,701 5 $22,360 APPLICATIONS APPROVED, NOT ACCEPTED 3 $86,617 284 $99,065 255 $98,805 32 $32,659 0 $0 153 $81,186 0 $0 APPLICATIONS DENIED 13 $141,654 692 $94,896 1,506 $102,854 394 $31,651 1 $42,410 502 $81,685 3 $42,623 APPLICATIONS WITHDRAWN 4 $90,362 356 $103,778 706 $114,718 73 $142,810 4 $1,080,330 235 $87,114 3 $109,790 FILES CLOSED FOR INCOMPLETENESS 2 $125,865 37 $102,772 153 $126,340 2 $73,030 0 $0 37 $92,040 0 $0
Aggregated Statistics For Year 2004(Based on 18 full and 22 partial tracts) A) FHA, FSA/RHS & VA B) Conventional C) Refinancings D) Home Improvement Loans E) Loans on Dwellings For 5+ Families F) Non-occupant Loans on G) Loans On Manufactured Number Average Value Number Average Value Number Average Value Number Average Value Number Average Value Number Average Value Number Average Value
LOANS ORIGINATED 46 $113,711 1,016 $121,659 1,556 $108,195 243 $47,675 17 $1,017,805 655 $79,398 5 $71,058 APPLICATIONS APPROVED, NOT ACCEPTED 3 $81,513 378 $90,872 407 $96,554 52 $38,875 0 $0 264 $78,265 0 $0 APPLICATIONS DENIED 17 $125,123 258 $92,331 1,399 $94,933 440 $37,681 8 $237,758 275 $78,837 8 $61,570 APPLICATIONS WITHDRAWN 5 $115,106 171 $100,788 649 $100,192 35 $62,173 0 $0 148 $73,011 6 $91,125 FILES CLOSED FOR INCOMPLETENESS 6 $103,250 26 $105,487 204 $109,488 7 $46,914 4 $108,705 48 $90,094 0 $0
Aggregated Statistics For Year 2003(Based on 18 full and 22 partial tracts) A) FHA, FSA/RHS & VA B) Conventional C) Refinancings D) Home Improvement Loans E) Loans on Dwellings For 5+ Families F) Non-occupant Loans on Number Average Value Number Average Value Number Average Value Number Average Value Number Average Value Number Average Value
LOANS ORIGINATED 74 $115,658 836 $122,549 2,228 $128,797 171 $21,301 13 $981,612 586 $80,344 APPLICATIONS APPROVED, NOT ACCEPTED 12 $73,927 228 $84,445 463 $98,392 40 $15,474 5 $98,346 201 $71,589 APPLICATIONS DENIED 12 $90,972 251 $92,648 1,386 $95,829 314 $18,354 9 $190,909 325 $62,411 APPLICATIONS WITHDRAWN 23 $97,463 188 $125,611 580 $102,755 16 $24,648 0 $0 130 $80,797 FILES CLOSED FOR INCOMPLETENESS 6 $80,980 49 $115,278 98 $107,073 2 $25,855 0 $0 26 $64,765
Aggregated Statistics For Year 2002(Based on 18 full and 22 partial tracts) A) FHA, FSA/RHS & VA B) Conventional C) Refinancings D) Home Improvement Loans E) Loans on Dwellings For 5+ Families F) Non-occupant Loans on Number Average Value Number Average Value Number Average Value Number Average Value Number Average Value Number Average Value
LOANS ORIGINATED 113 $100,337 703 $118,536 1,719 $121,069 183 $20,499 11 $692,132 420 $76,321 APPLICATIONS APPROVED, NOT ACCEPTED 4 $84,215 196 $97,051 486 $89,992 93 $24,444 2 $71,620 127 $63,866 APPLICATIONS DENIED 30 $80,200 288 $84,032 1,574 $83,323 357 $14,890 7 $111,654 259 $60,899 APPLICATIONS WITHDRAWN 22 $95,461 128 $90,474 689 $88,527 44 $20,545 0 $0 70 $72,096 FILES CLOSED FOR INCOMPLETENESS 5 $87,906 60 $76,451 172 $104,004 2 $35,115 0 $0 33 $65,320
Aggregated Statistics For Year 2001(Based on 18 full and 22 partial tracts) A) FHA, FSA/RHS & VA B) Conventional C) Refinancings D) Home Improvement Loans E) Loans on Dwellings For 5+ Families F) Non-occupant Loans on Number Average Value Number Average Value Number Average Value Number Average Value Number Average Value Number Average Value
LOANS ORIGINATED 127 $98,082 748 $113,683 1,763 $107,468 308 $25,481 9 $554,144 401 $68,244 APPLICATIONS APPROVED, NOT ACCEPTED 15 $96,879 199 $79,209 613 $75,241 106 $22,410 7 $1,838,506 129 $68,489 APPLICATIONS DENIED 24 $85,990 406 $78,178 1,963 $73,843 580 $14,901 3 $67,883 246 $59,687 APPLICATIONS WITHDRAWN 23 $90,108 167 $89,214 731 $81,382 63 $27,620 6 $69,127 69 $68,804 FILES CLOSED FOR INCOMPLETENESS 5 $76,382 39 $83,172 166 $82,482 4 $25,352 0 $0 11 $57,777
Aggregated Statistics For Year 2000(Based on 18 full and 22 partial tracts) A) FHA, FSA/RHS & VA B) Conventional C) Refinancings D) Home Improvement Loans E) Loans on Dwellings For 5+ Families F) Non-occupant Loans on Number Average Value Number Average Value Number Average Value Number Average Value Number Average Value Number Average Value
LOANS ORIGINATED 148 $90,842 741 $111,704 1,069 $79,738 372 $14,930 7 $226,861 321 $59,985 APPLICATIONS APPROVED, NOT ACCEPTED 7 $71,821 151 $71,609 528 $66,789 212 $15,233 0 $0 83 $53,596 APPLICATIONS DENIED 16 $79,449 540 $73,409 1,859 $71,275 588 $15,799 4 $71,048 346 $58,026 APPLICATIONS WITHDRAWN 27 $84,372 177 $79,372 720 $74,189 62 $30,260 7 $68,476 91 $75,564 FILES CLOSED FOR INCOMPLETENESS 0 $0 66 $77,934 194 $68,366 19 $15,643 1 $62,750 23 $55,936
Aggregated Statistics For Year 1999(Based on 12 full and 11 partial tracts) A) FHA, FSA/RHS & VA B) Conventional C) Refinancings D) Home Improvement Loans E) Loans on Dwellings For 5+ Families F) Non-occupant Loans on Number Average Value Number Average Value Number Average Value Number Average Value Number Average Value Number Average Value
LOANS ORIGINATED 74 $86,478 463 $104,806 877 $78,521 204 $13,546 16 $857,806 207 $57,652 APPLICATIONS APPROVED, NOT ACCEPTED 4 $76,695 143 $69,083 492 $65,982 137 $14,243 0 $0 86 $57,848 APPLICATIONS DENIED 20 $81,920 230 $70,407 914 $70,010 367 $13,776 4 $43,298 145 $54,666 APPLICATIONS WITHDRAWN 18 $75,423 96 $72,440 433 $71,149 37 $30,163 1 $72,000 56 $56,667 FILES CLOSED FOR INCOMPLETENESS 0 $0 24 $69,837 194 $70,919 4 $24,845 0 $0 21 $63,930
Private Mortgage Insurance Companies Aggregated Statistics For Year 2009(Based on 7 full and 8 partial tracts) A) Conventional B) Refinancings C) Non-occupant Loans on Number Average Value Number Average Value Number Average Value
LOANS ORIGINATED 16 $237,986 7 $232,099 2 $70,670 APPLICATIONS APPROVED, NOT ACCEPTED 2 $171,555 3 $175,600 0 $0 APPLICATIONS DENIED 3 $73,003 3 $143,933 0 $0 APPLICATIONS WITHDRAWN 0 $0 0 $0 0 $0 FILES CLOSED FOR INCOMPLETENESS 2 $66,000 2 $157,000 0 $0
Aggregated Statistics For Year 2008(Based on 18 full and 20 partial tracts) A) Conventional B) Refinancings C) Non-occupant Loans on Number Average Value Number Average Value Number Average Value
LOANS ORIGINATED 69 $151,728 19 $122,615 22 $81,525 APPLICATIONS APPROVED, NOT ACCEPTED 31 $110,447 14 $158,811 7 $89,551 APPLICATIONS DENIED 9 $123,138 4 $205,298 3 $124,667 APPLICATIONS WITHDRAWN 4 $208,568 5 $133,594 4 $113,598 FILES CLOSED FOR INCOMPLETENESS 2 $80,110 3 $327,833 2 $80,110
Aggregated Statistics For Year 2007(Based on 18 full and 22 partial tracts) A) Conventional B) Refinancings C) Non-occupant Loans on Number Average Value Number Average Value Number Average Value
LOANS ORIGINATED 119 $112,080 71 $127,926 37 $105,171 APPLICATIONS APPROVED, NOT ACCEPTED 21 $88,602 25 $123,242 18 $101,203 APPLICATIONS DENIED 6 $78,975 14 $145,011 11 $161,769 APPLICATIONS WITHDRAWN 8 $108,474 4 $82,795 2 $103,935 FILES CLOSED FOR INCOMPLETENESS 1 $86,080 1 $86,000 0 $0
Aggregated Statistics For Year 2006(Based on 18 full and 22 partial tracts) A) Conventional B) Refinancings C) Non-occupant Loans on Number Average Value Number Average Value Number Average Value
LOANS ORIGINATED 108 $125,729 38 $114,085 39 $105,887 APPLICATIONS APPROVED, NOT ACCEPTED 23 $133,550 8 $109,555 10 $67,011 APPLICATIONS DENIED 3 $122,907 12 $117,418 8 $97,068 APPLICATIONS WITHDRAWN 6 $113,672 14 $175,590 2 $100,000 FILES CLOSED FOR INCOMPLETENESS 0 $0 0 $0 0 $0
Aggregated Statistics For Year 2005(Based on 18 full and 22 partial tracts) A) Conventional B) Refinancings C) Non-occupant Loans on Number Average Value Number Average Value Number Average Value
LOANS ORIGINATED 113 $126,173 57 $129,428 27 $103,246 APPLICATIONS APPROVED, NOT ACCEPTED 18 $95,627 18 $101,730 14 $79,714 APPLICATIONS DENIED 6 $74,163 3 $220,130 5 $162,832 APPLICATIONS WITHDRAWN 10 $127,752 2 $82,940 1 $87,000 FILES CLOSED FOR INCOMPLETENESS 2 $258,745 2 $72,000 3 $199,667
Aggregated Statistics For Year 2004(Based on 18 full and 22 partial tracts) A) Conventional B) Refinancings C) Non-occupant Loans on Number Average Value Number Average Value Number Average Value
LOANS ORIGINATED 137 $112,280 81 $102,225 53 $73,875 APPLICATIONS APPROVED, NOT ACCEPTED 21 $104,036 37 $97,585 6 $71,305 APPLICATIONS DENIED 9 $75,778 4 $76,172 4 $92,428 APPLICATIONS WITHDRAWN 2 $267,970 10 $98,734 3 $77,283 FILES CLOSED FOR INCOMPLETENESS 0 $0 6 $85,533 4 $83,185
Aggregated Statistics For Year 2003(Based on 18 full and 22 partial tracts) A) Conventional B) Refinancings C) Non-occupant Loans on Number Average Value Number Average Value Number Average Value
LOANS ORIGINATED 162 $105,251 102 $113,532 59 $83,291 APPLICATIONS APPROVED, NOT ACCEPTED 23 $127,873 47 $112,087 9 $60,329 APPLICATIONS DENIED 5 $95,430 10 $99,422 2 $72,710 APPLICATIONS WITHDRAWN 13 $89,599 17 $121,023 3 $62,157 FILES CLOSED FOR INCOMPLETENESS 1 $67,800 0 $0 1 $44,000
Aggregated Statistics For Year 2002(Based on 18 full and 22 partial tracts) A) Conventional B) Refinancings C) Non-occupant Loans on Number Average Value Number Average Value Number Average Value
LOANS ORIGINATED 196 $106,389 127 $105,676 94 $86,316 APPLICATIONS APPROVED, NOT ACCEPTED 45 $91,397 40 $126,328 13 $74,754 APPLICATIONS DENIED 7 $75,990 11 $115,867 6 $78,822 APPLICATIONS WITHDRAWN 11 $93,345 12 $97,297 2 $84,085 FILES CLOSED FOR INCOMPLETENESS 0 $0 4 $84,335 1 $102,340
Aggregated Statistics For Year 2001(Based on 18 full and 22 partial tracts) A) Conventional B) Refinancings C) Non-occupant Loans on Number Average Value Number Average Value Number Average Value
LOANS ORIGINATED 175 $111,435 107 $100,934 63 $73,447 APPLICATIONS APPROVED, NOT ACCEPTED 43 $91,969 33 $109,111 15 $89,764 APPLICATIONS DENIED 2 $111,500 11 $78,740 8 $83,222 APPLICATIONS WITHDRAWN 10 $118,528 5 $121,086 2 $55,915 FILES CLOSED FOR INCOMPLETENESS 2 $88,765 2 $72,070 0 $0
Aggregated Statistics For Year 2000(Based on 18 full and 22 partial tracts) A) Conventional B) Refinancings C) Non-occupant Loans on Number Average Value Number Average Value Number Average Value
LOANS ORIGINATED 196 $99,631 73 $80,780 45 $68,283 APPLICATIONS APPROVED, NOT ACCEPTED 25 $121,157 9 $62,903 5 $73,074 APPLICATIONS DENIED 21 $52,860 11 $89,952 9 $57,206 APPLICATIONS WITHDRAWN 6 $78,522 1 $207,610 1 $31,460 FILES CLOSED FOR INCOMPLETENESS 4 $100,320 0 $0 2 $113,890
Aggregated Statistics For Year 1999(Based on 12 full and 10 partial tracts) A) Conventional B) Refinancings C) Non-occupant Loans on Number Average Value Number Average Value Number Average Value
LOANS ORIGINATED 102 $119,798 41 $99,590 17 $80,388 APPLICATIONS APPROVED, NOT ACCEPTED 13 $109,848 9 $106,753 3 $72,020 APPLICATIONS DENIED 10 $76,401 4 $91,710 3 $51,470 APPLICATIONS WITHDRAWN 4 $78,715 2 $62,295 1 $130,490 FILES CLOSED FOR INCOMPLETENESS 3 $127,690 1 $92,000 2 $90,625
2002 - 2018 National Fire Incident Reporting System (NFIRS) incidents See full 2006 National Fire Incident Reporting System statistics for zip code 44120, Ohio
Most common first names in zip code 44120 among deceased individuals Name Count Lived (average)
John 515 74.7 years Mary 440 79.0 years James 393 71.6 years William 366 74.0 years Joseph 258 77.1 years Robert 242 72.0 years George 223 75.0 years Charles 223 75.1 years Frank 206 75.8 years Helen 204 77.6 years
Most common last names in zip code 44120 among deceased individuals Last name Count Lived (average)
Smith 249 73.0 years Williams 222 73.0 years Johnson 217 72.5 years Jones 181 72.8 years Brown 154 73.3 years Jackson 137 72.9 years Davis 117 72.3 years Harris 109 74.6 years Robinson 99 71.9 years Miller 91 74.9 years
Businesses in zip code 44120
Name Count Name Count
Advance Auto Parts 1 Pizza Hut 1 Baskin-Robbins 1 Popeyes 1 Blockbuster 1 RadioShack 1 CVS 2 T-Mobile 1 Firestone Complete Auto Care 1 UPS 3 GameStop 1 Walgreens 1 H&R Block 2 Wendy's 1 Papa John's Pizza 1
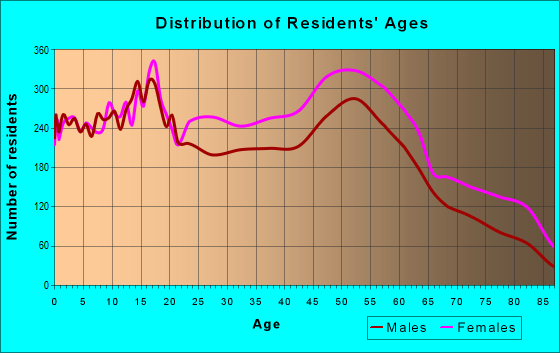
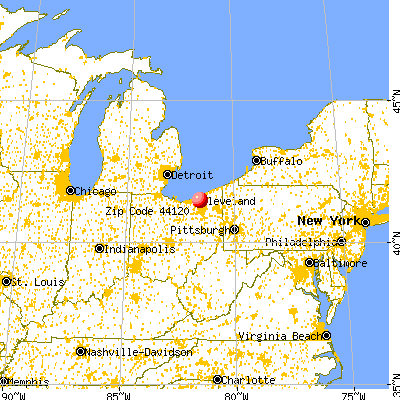


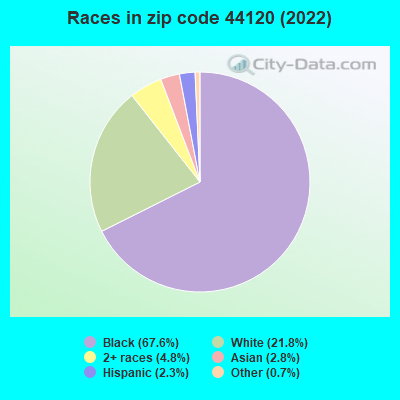


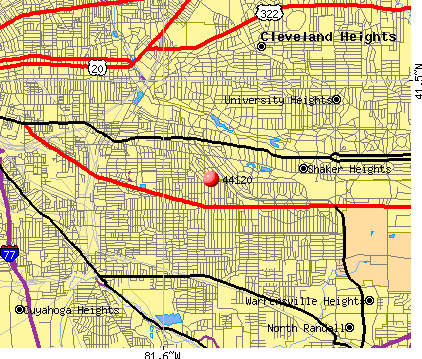 Nearest zip codes: 44118, 44106, 44104, 44128, 44105, 44112.
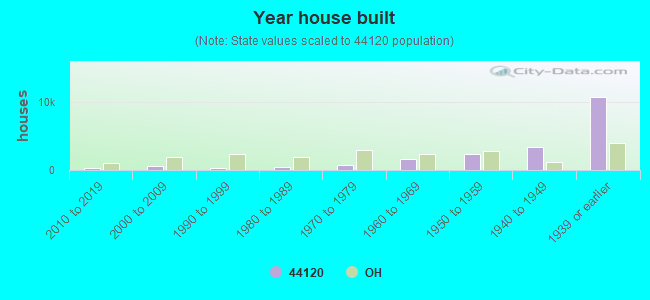

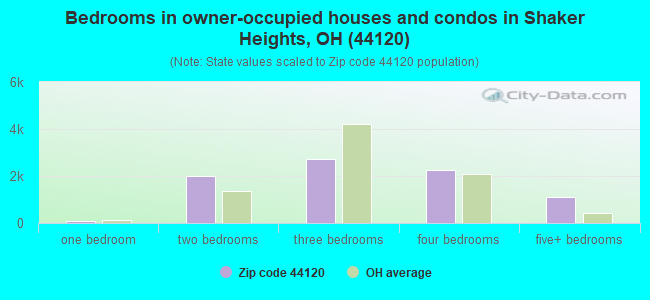
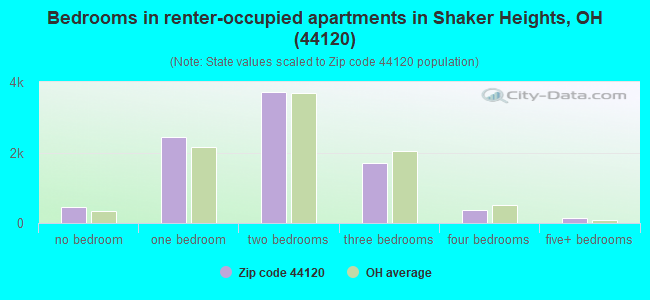
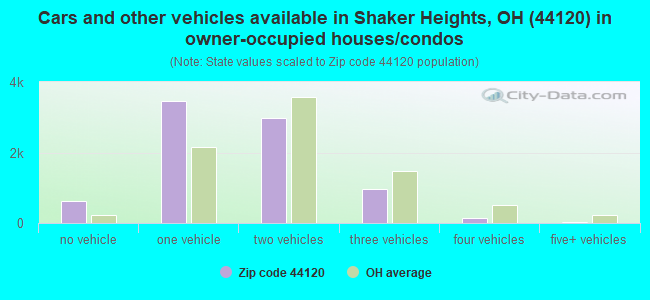


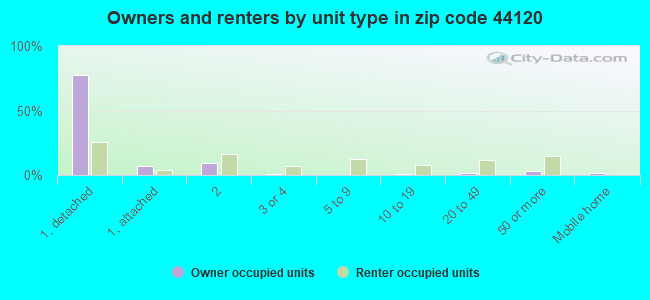
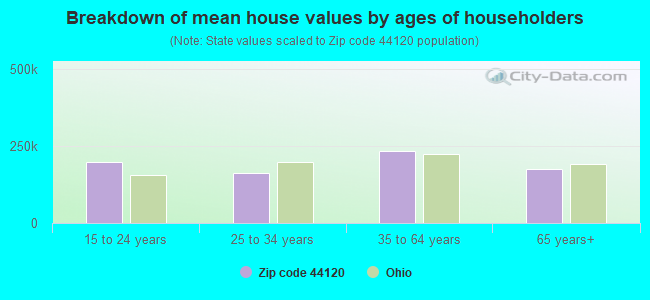


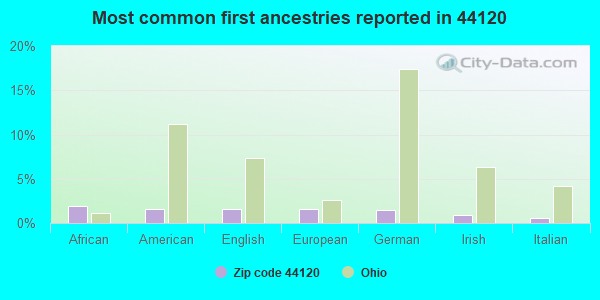
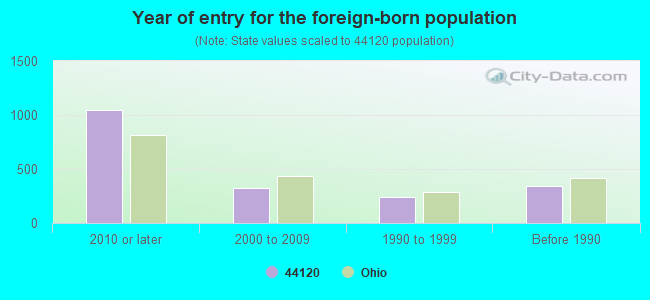


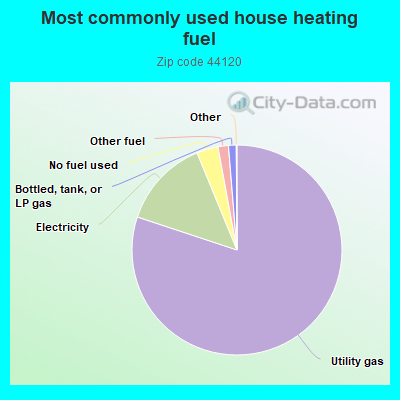

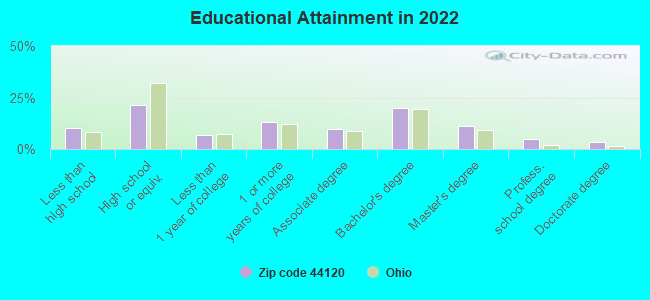
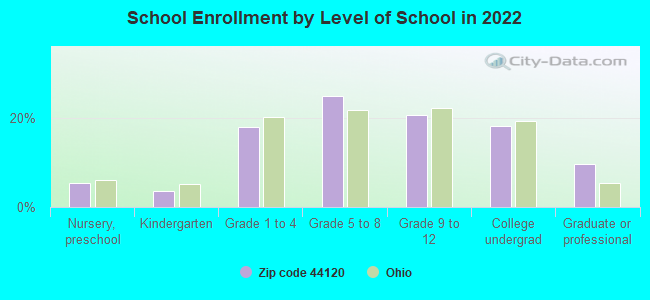
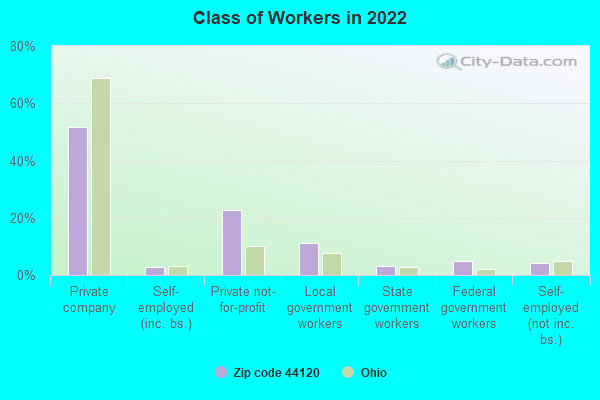
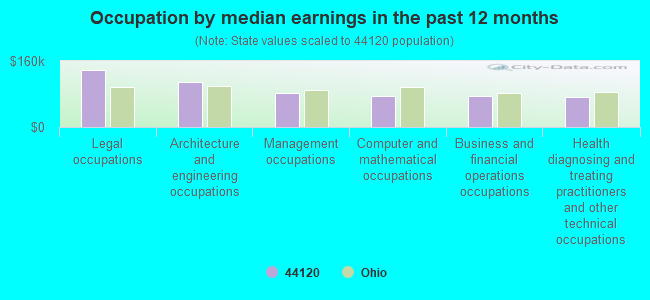

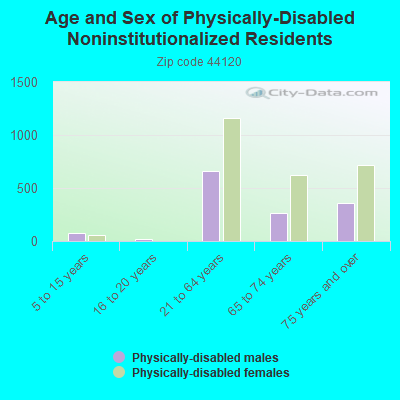
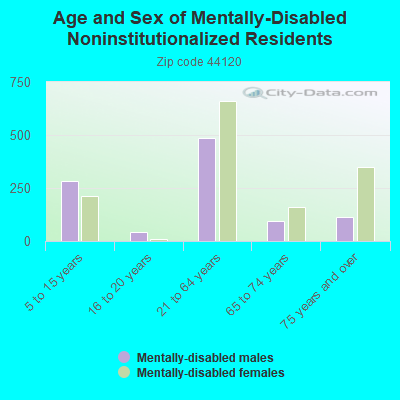
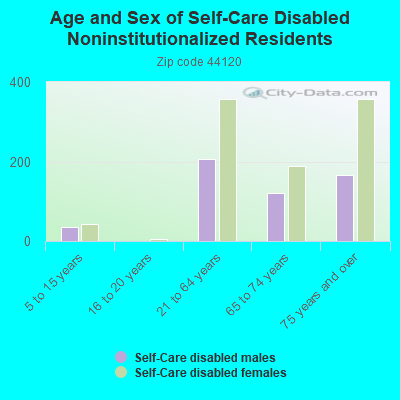
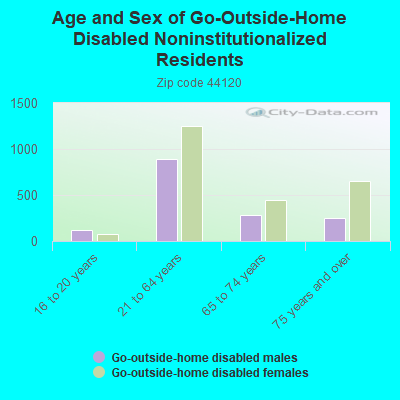

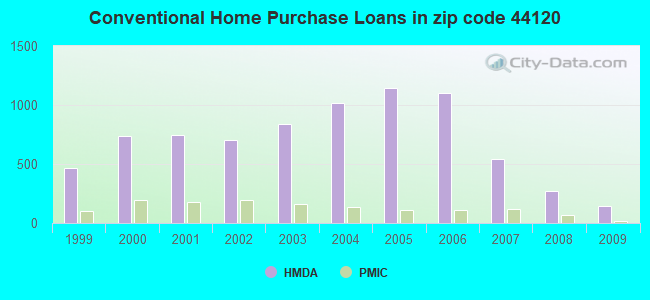
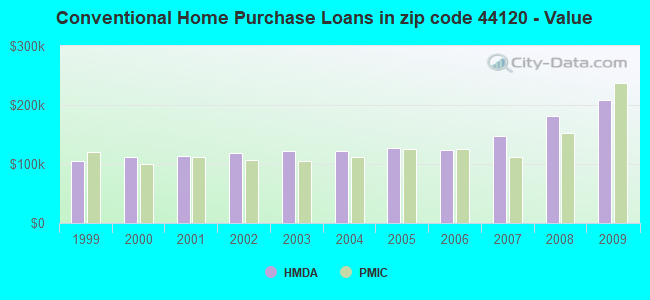
 Based on the data from the years 2002 - 2018 the average number of fire incidents per year is 108. The highest number of reported fires - 192 took place in 2016, and the least - 27 in 2003. The data has a growing trend.
 When looking into fire subcategories, the most reports belonged to: Structure Fires (66.8%), and Outside Fires (20.2%).