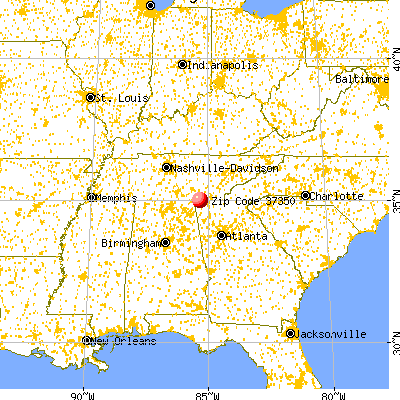
Estimated zip code population in 2022: 2,167 Zip code population in 2010: 1,866 Zip code population in 2000: 2,109
Houses and condos: 888 Renter-occupied apartments: 60
% of renters here:
7%
State:
33%
March 2022 cost of living index in zip code 37350: 90.9 (less than average, U.S. average is 100)
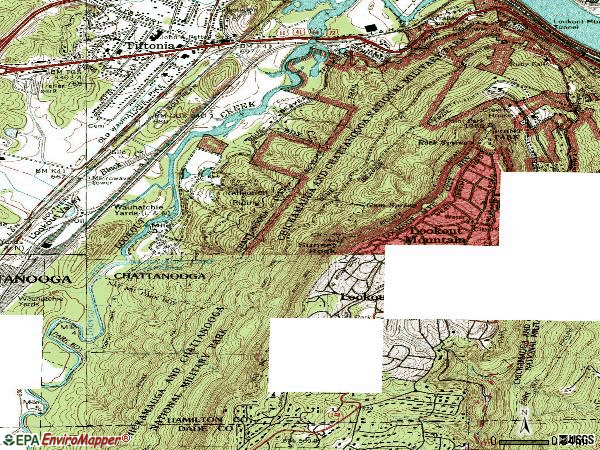
Land area: 1.5 sq. mi. Water area: 0.0 sq. mi.
Population density: 1,494 people per square mile
(low).
OSM Map
General Map
Google Map
MSN Map
OSM Map
General Map
Google Map
MSN Map
OSM Map
General Map
Google Map
MSN Map
OSM Map
General Map
Google Map
MSN Map
Please wait while loading the map...
Real estate property taxes paid for housing units in 2022:
This zip code:
0.7% ($6,322)
Tennessee:
0.5% ($1,376)
Median real estate property taxes paid for housing units with mortgages in 2022: $6,401 (0.6%) Median real estate property taxes paid for housing units with no mortgage in 2022: $6,225 (1.0%)
Business Search- 14 Million verified businesses
Males: 968
(44.7%)
Females: 1,199
(55.3%)
For population 25 years and over in 37350:
High school or higher: 103.3%
Bachelor's degree or higher: 90.9%
Graduate or professional degree: 37.9%
Unemployed: 0.5%
Mean travel time to work (commute): 20.0 minutes
For population 15 years and over in 37350:
Never married: 16.4%
Now married: 67.4%
Separated: 0.0%
Widowed: 8.7%
Divorced: 7.5%
Zip code 37350 compared to state average:
Median household income significantly above state average.
Median house value significantly above state average.
Unemployed percentage significantly below state average.
Black race population percentage significantly below state average.
Hispanic race population percentage significantly below state average.
Median age significantly above state average.
Foreign-born population percentage below state average.
Renting percentage significantly below state average.
Length of stay since moving in significantly above state average.
Number of rooms per house significantly above state average.
House age significantly above state average.
Percentage of population with a bachelor's degree or higher significantly above state average.
Estimated median house/condo value in 2022: $871,947
37350:
$871,947
Tennessee:
$284,800
Median resident age:
This zip code:
49.7 years
Tennessee median age:
39.2 years
Average household size:
This zip code:
2.6 people
Tennessee:
2.4 people
Averages for the 2020 tax year for zip code 37350, filed in 2021:
Average Adjusted Gross Income (AGI) in 2020: $328,121 (Individual Income Tax Returns)
Here:
$328,121
State:
$69,014
Salary/wage: $182,052 (reported on 63.7% of returns)
Here:
$182,052
State:
$55,872
(% of AGI for various income ranges: 1543.0% for AGIs below $25k, 2942.0% for AGIs $25k-50k, 5497.5% for AGIs $50k-75k, 7865.0% for AGIs $75k-100k, 18351.4% for AGIs $100k-200k, 121411.2% for AGIs over 200k)
Taxable interest for individuals: $8,658 (reported on 64.7% of returns)
This zip code:
$8,658
Tennessee:
$1,945
(% of AGI for various income ranges: 18.0% for AGIs below $25k, 44.0% for AGIs $25k-50k, 310.0% for AGIs $50k-75k, 190.0% for AGIs $75k-100k, 594.3% for AGIs $100k-200k, 6322.5% for AGIs over 200k)
Ordinary dividends: $28,807 (reported on 66.7% of returns)
Here:
$28,807
State:
$8,105
(% of AGI for various income ranges: 308.0% for AGIs below $25k, 546.0% for AGIs $25k-50k, 1387.5% for AGIs $50k-75k, 1777.5% for AGIs $75k-100k, 4535.7% for AGIs $100k-200k, 18208.8% for AGIs over 200k)
Net capital gain/loss in AGI: +$150,198 (reported on 61.8% of returns)
Here:
+$150,198
State:
+$33,664
(% of AGI for various income ranges: 147.0% for AGIs below $25k, 494.0% for AGIs $25k-50k, 662.5% for AGIs $50k-75k, 1347.5% for AGIs $75k-100k, 3220.0% for AGIs $100k-200k, 113966.2% for AGIs over 200k)
Profit/loss from business: +$42,700 (reported on 27.5% of returns)
Here:
+$42,700
State:
+$18,991
(% of AGI for various income ranges: 192.0% for AGIs below $25k, 294.0% for AGIs $25k-50k, 1662.5% for AGIs $50k-75k, 3477.1% for AGIs $100k-200k, 10647.5% for AGIs over 200k)
Taxable individual retirement arrangement distribution: $40,206 (reported on 16.7% of returns)
37350:
$40,206
Tennessee:
$20,036
(% of AGI for various income ranges: 2262.5% for AGIs $50k-75k, 2542.9% for AGIs $100k-200k, 5187.5% for AGIs over 200k)
Self-employed (Keogh) retirement plans: $37,000 (reported on 3.9% of returns)
37350:
$37,000
Tennessee:
$28,955
(% of AGI for various income ranges: 1850.0% for AGIs over 200k)
Total itemized deductions: $71,542 (reported on 35.3% of returns)
Here:
$71,542
State:
$40,136
(% of AGI for various income ranges: 3490.0% for AGIs $50k-75k, 3794.3% for AGIs $100k-200k, 27128.8% for AGIs over 200k)
Charity contributions: $44,488 (reported on 33.3% of returns)
Here:
$44,488
State:
$19,852
(% of AGI for various income ranges: 1000.0% for AGIs $50k-75k, 1371.4% for AGIs $100k-200k, 17207.5% for AGIs over 200k)
Taxes paid: $8,642 (reported on 35.3% of returns)
37350:
$8,642
State:
$6,038
(% of AGI for various income ranges: 765.0% for AGIs $50k-75k, 762.9% for AGIs $100k-200k, 2838.8% for AGIs over 200k)
Earned income credit: $1,767 (reported on 2.9% of returns)
Here:
$1,767
State:
$2,391
(% of AGI for various income ranges: 53.0% for AGIs below $25k)
Percentage of individuals using paid preparers for their 2020 taxes: 92.2%
Here:
92%
State:
93%
(% for various income ranges: 87.0% for AGIs below $25k, 87.5% for AGIs $25k-50k, 100.0% for AGIs $50k-75k, 100.0% for AGIs $75k-100k, 89.5% for AGIs $100k-200k, 94.4% for AGIs over 200k)
Averages for the 2012 tax year for zip code 37350, filed in 2013:
Average Adjusted Gross Income (AGI) in 2012: $279,586 (Individual Income Tax Returns)
Here:
$279,586
State:
$53,767
Salary/wage: $143,682 (reported on 67.7% of returns)
Here:
$143,682
State:
$45,421
(% of AGI for various income ranges: 52.9% for AGIs below $25k, 54.7% for AGIs $25k-50k, 46.6% for AGIs $50k-75k, 50.3% for AGIs $75k-100k, 54.2% for AGIs $100k-200k, 31.5% for AGIs over 200k)
Taxable interest for individuals: $13,215 (reported on 63.5% of returns)
This zip code:
$13,215
Tennessee:
$1,732
(% of AGI for various income ranges: 3.6% for AGIs below $25k, 2.4% for AGIs $25k-50k, 2.3% for AGIs $50k-75k, 2.0% for AGIs $75k-100k, 2.4% for AGIs $100k-200k, 3.1% for AGIs over 200k)
Ordinary dividends: $27,957 (reported on 65.6% of returns)
Here:
$27,957
State:
$6,739
(% of AGI for various income ranges: 17.2% for AGIs below $25k, 11.5% for AGIs $25k-50k, 12.5% for AGIs $50k-75k, 11.3% for AGIs $75k-100k, 9.5% for AGIs $100k-200k, 5.8% for AGIs over 200k)
Net capital gain/loss in AGI: +$94,568 (reported on 59.4% of returns)
Here:
+$94,568
State:
+$19,082
(% of AGI for various income ranges: 4.0% for AGIs below $25k, 2.7% for AGIs $25k-50k, 4.5% for AGIs $50k-75k, 5.9% for AGIs $75k-100k, 11.6% for AGIs $100k-200k, 22.3% for AGIs over 200k)
Profit/loss from business: +$44,313 (reported on 24.0% of returns)
Here:
+$44,313
State:
+$15,240
(% of AGI for various income ranges: 7.8% for AGIs below $25k, 4.2% for AGIs $25k-50k, 8.9% for AGIs $50k-75k, 6.0% for AGIs $100k-200k, 3.5% for AGIs over 200k)
Taxable individual retirement arrangement distribution: $35,076 (reported on 21.9% of returns)
37350:
$35,076
Tennessee:
$15,505
(% of AGI for various income ranges: 7.1% for AGIs $25k-50k, 7.9% for AGIs $50k-75k, 7.4% for AGIs $75k-100k, 5.1% for AGIs $100k-200k, 2.2% for AGIs over 200k)
Self-employment retirement plans: $26,625 (reported on 4.2% of returns)
37350:
$26,625
Tennessee:
$22,567
(% of AGI for various income ranges: 0.5% for AGIs over 200k)
Total itemized deductions: $57,103 (14% of AGI, reported on 62.5% of returns)
Here:
$57,103
State:
$21,976
Here:
13.6% of AGI
State:
17.8% of AGI
(% of AGI for various income ranges: 43.1% for AGIs below $25k, 29.7% for AGIs $25k-50k, 24.2% for AGIs $50k-75k, 19.5% for AGIs $75k-100k, 20.4% for AGIs $100k-200k, 10.9% for AGIs over 200k)
Charity contributions: $23,113 (reported on 57.3% of returns)
Here:
$23,113
State:
$6,709
(% of AGI for various income ranges: 4.2% for AGIs below $25k, 4.9% for AGIs $25k-50k, 4.3% for AGIs $50k-75k, 3.7% for AGIs $75k-100k, 4.2% for AGIs $100k-200k, 4.8% for AGIs over 200k)
Taxes paid: $13,766 (reported on 61.5% of returns)
37350:
$13,766
State:
$4,829
(% of AGI for various income ranges: 7.7% for AGIs below $25k, 7.4% for AGIs $25k-50k, 7.0% for AGIs $50k-75k, 5.4% for AGIs $75k-100k, 4.1% for AGIs $100k-200k, 2.6% for AGIs over 200k)
Earned income credit: $1,850 (reported on 4.2% of returns)
Here:
$1,850
State:
$2,404
(% of AGI for various income ranges: 3.2% for AGIs below $25k)
Percentage of individuals using paid preparers for their 2012 taxes: 71.9%
Here:
72%
State:
52%
(% for various income ranges: 64.0% for AGIs below $25k, 66.7% for AGIs $25k-50k, 66.7% for AGIs $50k-75k, 62.5% for AGIs $75k-100k, 75.0% for AGIs $100k-200k, 84.6% for AGIs over 200k)
Averages for the 2004 tax year for zip code 37350, filed in 2005:
Average Adjusted Gross Income (AGI) in 2004: $197,066 (Individual Income Tax Returns)
Here:
$197,066
State:
$44,088
Salary/wage: $116,028 (reported on 60.2% of returns)
Here:
$116,028
State:
$38,825
(% of AGI for various income ranges: 43.8% for AGIs $10k-25k, 48.8% for AGIs $25k-50k, 44.5% for AGIs $50k-75k, 45.0% for AGIs $75k-100k, 33.6% for AGIs over 100k)
Taxable interest for individuals: $7,507 (reported on 72.2% of returns)
This zip code:
$7,507
Tennessee:
$1,802
(% of AGI for various income ranges: 7.2% for AGIs $10k-25k, 4.1% for AGIs $25k-50k, 3.8% for AGIs $50k-75k, 2.5% for AGIs $75k-100k, 2.6% for AGIs over 100k)
Taxable dividends: $21,274 (reported on 74.6% of returns)
Here:
$21,274
State:
$3,727
(% of AGI for various income ranges: 18.6% for AGIs $10k-25k, 11.7% for AGIs $25k-50k, 12.2% for AGIs $50k-75k, 8.8% for AGIs $75k-100k, 7.4% for AGIs over 100k)
Net capital gain/loss: +$99,083 (reported on 68.7% of returns)
Here:
+$99,083
State:
+$15,776
(% of AGI for various income ranges: 3.9% for AGIs $10k-25k, 4.2% for AGIs $25k-50k, 6.9% for AGIs $50k-75k, 17.8% for AGIs $75k-100k, 36.6% for AGIs over 100k)
Profit/loss from business: +$48,298 (reported on 21.3% of returns)
Here:
+$48,298
State:
+$12,882
(% of AGI for various income ranges: 4.6% for AGIs $10k-25k, 10.6% for AGIs $25k-50k, 2.0% for AGIs $50k-75k, 6.7% for AGIs $75k-100k, 5.1% for AGIs over 100k)
IRA payment deduction: $3,541 (reported on 3.5% of returns)
37350:
$3,541
Tennessee:
$2,934
Self-employed pension: $23,200 (reported on 4.3% of returns)
Here:
$23,200
Tennessee:
$16,857
Total itemized deductions: $46,915 (16% of AGI, reported on 58.3% of returns)
Here:
$46,915
State:
$18,035
Here:
15.6% of AGI
State:
19.9% of AGI
(% of AGI for various income ranges: 39.0% for AGIs $10k-25k, 30.0% for AGIs $25k-50k, 23.7% for AGIs $50k-75k, 24.7% for AGIs $75k-100k, 12.4% for AGIs over 100k)
Charity contributions deductions: $22,118 (7% of AGI, reported on 55.3% of returns)
Here:
$22,118
State:
$5,167
Here:
7.1% of AGI
State:
5.3% of AGI
(% of AGI for various income ranges: 4.0% for AGIs $10k-25k, 5.9% for AGIs $25k-50k, 5.8% for AGIs $50k-75k, 5.4% for AGIs $75k-100k, 6.2% for AGIs over 100k)
Total tax: $47,577 (reported on 80.8% of returns)
37350:
$47,577
State:
$7,482
(% of AGI for various income ranges: 5.1% for AGIs $10k-25k, 8.4% for AGIs $25k-50k, 9.7% for AGIs $50k-75k, 10.7% for AGIs $75k-100k, 20.2% for AGIs over 100k)
Earned income credit: $1,346 (reported on 2.5% of returns)
Here:
$1,346
State:
$1,826
Percentage of individuals using paid preparers for their 2004 taxes: 77.4%
Here:
77%
State:
60%
(% for various income ranges: 74.7% for AGIs below $10k, 71.8% for AGIs $10k-25k, 69.4% for AGIs $25k-50k, 76.5% for AGIs $50k-75k, 69.9% for AGIs $75k-100k, 84.5% for AGIs over 100k)
Household received Food Stamps/SNAP in the past 12 months: 0 Household did not receive Food Stamps/SNAP in the past 12 months: 845
Women who had a birth in the past 12 months: 19 (12 now married, 7 unmarried) Women who did not have a birth in the past 12 months: 366 (239 now married, 127 unmarried)
Housing units in zip code 37350 with a mortgage: 419 (67 second mortgage, 68 both second mortgage and home equity loan) Houses without a mortgage: 25
Median monthly owner costs for units with a mortgage: $2,938 Median monthly owner costs for units without a mortgage: $1,209
Residents with income below the poverty level in 2022:
This zip code:
2.2%
Whole state:
13.3%
Residents with income below 50% of the poverty level in 2022:
This zip code:
1.4%
Whole state:
7.1%
Median number of rooms in houses and condos:
Here:
10.0
State:
6.5
Median number of rooms in apartments:
Here:
5.0
State:
4.4
Notable locations in this zip code not listed on our city pages
Churches in zip code 37350 include: Episcopal Church of the Good Shepherd (A), First Baptist Church of Lookout Mountain (B), Lookout Mountain Presbyterian Church (C), Reformed Presbyterian Church (D). Display/hide their locations on the map
Size of family households: 329 2-persons, 96 3-persons, 131 4-persons, 49 5-persons, 17 6-persons, 15 7-or-more-persons
Size of nonfamily households: 174 1-person, 16 2-persons, 9 4-persons
506 married couples with children.
0 single-parent households ().
97.6% of residents of 37350 zip code speak English at home.
1.2% of residents speak Spanish at home (79% very well, 21% not well).
1.1% of residents speak other Indo-European language at home (70% very well, 9% well, 22% not well).
0.1% of residents speak Asian or Pacific Island language at home (50% very well, 50% well).
Foreign born population: 64 (3.0%) (70.6% of them are naturalized citizens)
This zip code:
3.0%
Whole state:
5.6%
27%Sweden
27%United Kingdom, excluding England and Scotland
20%Romania
12%Bhutan
9%Germany
3%Japan
38%English
14%American
9%Irish
9%Scotch-Irish
5%German
3%European
3%Scottish
Year of entry for the foreign-born population
332010 or later
212000 to 2009
111990 to 1999
36Before 1990
Housing units lacking complete kitchen facilities: 1.2%
72.4%Utility gas
26.6%Electricity
1.1%Bottled, tank, or LP gas
Population in 1990: 1,899. Population change in the 1990s: +210 (+11.1%).
Place of birth for U.S.-born residents:
This state: 900
Northeast: 242
Midwest: 211
South: 640
West: 83
64% of the 37350 zip code residents lived in the same house 5 years ago. Out of people who lived in different houses, 58% lived in this county. Out of people who lived in different counties, 50% lived in Tennessee.
91% of the 37350 zip code residents lived in the same house 1 year ago. Out of people who lived in different houses, 31% moved from this county. Out of people who lived in different houses, 15% moved from different county within same state. Out of people who lived in different houses, 51% moved from different state. Out of people who lived in different houses, 8% moved from abroad.
Private vs. public school enrollment:
Students in private schools in grades 1 to 8 (elementary and middle school): 119
Here:
43.1%
Tennessee:
15.0%
Students in private schools in grades 9 to 12 (high school): 134
Here:
96.4%
Tennessee:
16.2%
Students in private undergraduate colleges: 20
Here:
47.6%
Tennessee:
23.5%
Occupation by median earnings in the past 12 months ($)
243,348Legal occupations
178,188Health diagnosing and treating practitioners and other technical occupations
151,636Management occupations
136,544Sales and related occupations
89,646Business and financial operations occupations
86,812Computer and mathematical occupations
Top industries in this zip code by the number of employees in 2005:
Other Services (except Public Administration): Religious Organizations (50-99 employees: 2 establishments, 1-4 employees: 2 establishments)
Accommodation and Food Services: Full-Service Restaurants (10-19: 1, 1-4: 1)
Arts, Entertainment, and Recreation: Fitness and Recreational Sports Centers (10-19: 1)
Health Care and Social Assistance: Offices of Dentists (10-19: 1)
Information: Television Broadcasting (5-9: 1)
Professional, Scientific, and Technical Services: Veterinary Services (5-9: 1)
Other Services (except Public Administration): Other Personal Care Services (5-9: 1)
Home Mortgage Disclosure Act Aggregated Statistics For Year 2009 (Based on 2 full tracts)
A) FHA, FSA/RHS & VA Home Purchase Loans
B) Conventional Home Purchase Loans
C) Refinancings
D) Home Improvement Loans
F) Non-occupant Loans on < 5 Family Dwellings (A B C & D)
Number
Average Value
Number
Average Value
Number
Average Value
Number
Average Value
Number
Average Value
LOANS ORIGINATED
4
$160,410
33
$475,744
90
$328,603
8
$296,292
2
$72,600
APPLICATIONS APPROVED, NOT ACCEPTED
0
$0
2
$31,395
6
$377,070
0
$0
2
$31,395
APPLICATIONS DENIED
8
$214,861
4
$304,632
22
$425,619
2
$58,865
2
$225,655
APPLICATIONS WITHDRAWN
0
$0
2
$206,030
18
$306,648
0
$0
0
$0
FILES CLOSED FOR INCOMPLETENESS
0
$0
0
$0
4
$635,262
0
$0
0
$0
Aggregated Statistics For Year 2008 (Based on 2 full tracts)
A) FHA, FSA/RHS & VA Home Purchase Loans
B) Conventional Home Purchase Loans
C) Refinancings
D) Home Improvement Loans
F) Non-occupant Loans on < 5 Family Dwellings (A B C & D)
Number
Average Value
Number
Average Value
Number
Average Value
Number
Average Value
Number
Average Value
LOANS ORIGINATED
2
$204,070
31
$343,828
57
$399,222
2
$372,820
6
$185,428
APPLICATIONS APPROVED, NOT ACCEPTED
0
$0
4
$247,238
4
$232,520
0
$0
0
$0
APPLICATIONS DENIED
0
$0
4
$342,405
10
$185,035
4
$129,995
0
$0
APPLICATIONS WITHDRAWN
0
$0
10
$377,135
8
$224,918
0
$0
0
$0
FILES CLOSED FOR INCOMPLETENESS
0
$0
0
$0
2
$409,120
0
$0
0
$0
Aggregated Statistics For Year 2007 (Based on 2 full tracts)
A) FHA, FSA/RHS & VA Home Purchase Loans
B) Conventional Home Purchase Loans
C) Refinancings
D) Home Improvement Loans
F) Non-occupant Loans on < 5 Family Dwellings (A B C & D)
G) Loans On Manufactured Home Dwelling (A B C & D)
Number
Average Value
Number
Average Value
Number
Average Value
Number
Average Value
Number
Average Value
Number
Average Value
LOANS ORIGINATED
2
$199,165
57
$385,934
65
$272,444
4
$32,868
16
$226,266
2
$33,355
APPLICATIONS APPROVED, NOT ACCEPTED
0
$0
2
$318,860
6
$410,753
2
$353,195
4
$213,880
0
$0
APPLICATIONS DENIED
0
$0
12
$313,134
27
$204,796
4
$78,488
12
$128,687
0
$0
APPLICATIONS WITHDRAWN
0
$0
14
$315,494
10
$280,791
0
$0
2
$187,390
0
$0
FILES CLOSED FOR INCOMPLETENESS
0
$0
2
$383,610
4
$200,635
0
$0
0
$0
0
$0
Aggregated Statistics For Year 2006 (Based on 2 full tracts)
B) Conventional Home Purchase Loans
C) Refinancings
D) Home Improvement Loans
F) Non-occupant Loans on < 5 Family Dwellings (A B C & D)
Number
Average Value
Number
Average Value
Number
Average Value
Number
Average Value
LOANS ORIGINATED
51
$376,011
67
$259,977
0
$0
10
$152,267
APPLICATIONS APPROVED, NOT ACCEPTED
2
$500,360
10
$255,675
0
$0
2
$49,055
APPLICATIONS DENIED
4
$474,852
8
$169,730
2
$2,945
0
$0
APPLICATIONS WITHDRAWN
2
$269,805
14
$249,480
0
$0
2
$39,245
FILES CLOSED FOR INCOMPLETENESS
2
$181,505
4
$673,035
0
$0
0
$0
Aggregated Statistics For Year 2005 (Based on 2 full tracts)
B) Conventional Home Purchase Loans
C) Refinancings
D) Home Improvement Loans
F) Non-occupant Loans on < 5 Family Dwellings (A B C & D)
Number
Average Value
Number
Average Value
Number
Average Value
Number
Average Value
LOANS ORIGINATED
80
$320,231
59
$310,161
2
$73,580
8
$216,332
APPLICATIONS APPROVED, NOT ACCEPTED
6
$95,820
10
$148,146
4
$29,922
2
$210,935
APPLICATIONS DENIED
2
$784,880
6
$400,288
0
$0
0
$0
APPLICATIONS WITHDRAWN
4
$267,350
18
$301,852
0
$0
2
$122,640
FILES CLOSED FOR INCOMPLETENESS
0
$0
6
$206,685
0
$0
0
$0
Aggregated Statistics For Year 2004 (Based on 2 full tracts)
B) Conventional Home Purchase Loans
C) Refinancings
D) Home Improvement Loans
F) Non-occupant Loans on < 5 Family Dwellings (A B C & D)
Number
Average Value
Number
Average Value
Number
Average Value
Number
Average Value
LOANS ORIGINATED
80
$381,206
92
$258,157
6
$13,082
12
$129,996
APPLICATIONS APPROVED, NOT ACCEPTED
6
$92,877
14
$203,088
2
$49,055
2
$84,375
APPLICATIONS DENIED
12
$166,623
14
$118,152
2
$2,945
0
$0
APPLICATIONS WITHDRAWN
4
$38,262
14
$146,604
0
$0
0
$0
FILES CLOSED FOR INCOMPLETENESS
2
$209,955
2
$194,260
0
$0
0
$0
Aggregated Statistics For Year 2003 (Based on 2 full tracts)
B) Conventional Home Purchase Loans
C) Refinancings
D) Home Improvement Loans
F) Non-occupant Loans on < 5 Family Dwellings (A B C & D)
Number
Average Value
Number
Average Value
Number
Average Value
Number
Average Value
LOANS ORIGINATED
78
$291,261
237
$286,912
6
$268,167
10
$123,619
APPLICATIONS APPROVED, NOT ACCEPTED
12
$316,895
22
$224,583
2
$196,220
0
$0
APPLICATIONS DENIED
4
$273,728
22
$212,364
0
$0
6
$165,807
APPLICATIONS WITHDRAWN
4
$323,272
10
$209,955
0
$0
0
$0
FILES CLOSED FOR INCOMPLETENESS
0
$0
0
$0
0
$0
0
$0
Aggregated Statistics For Year 2002 (Based on 2 full tracts)
A) FHA, FSA/RHS & VA Home Purchase Loans
B) Conventional Home Purchase Loans
C) Refinancings
D) Home Improvement Loans
F) Non-occupant Loans on < 5 Family Dwellings (A B C & D)
Number
Average Value
Number
Average Value
Number
Average Value
Number
Average Value
Number
Average Value
LOANS ORIGINATED
2
$66,715
53
$232,909
145
$306,442
4
$150,108
6
$230,885
APPLICATIONS APPROVED, NOT ACCEPTED
0
$0
4
$322,782
12
$288,771
0
$0
0
$0
APPLICATIONS DENIED
0
$0
4
$461,118
16
$308,066
12
$16,842
2
$82,410
APPLICATIONS WITHDRAWN
0
$0
2
$175,615
0
$0
0
$0
0
$0
FILES CLOSED FOR INCOMPLETENESS
0
$0
2
$54,940
0
$0
0
$0
0
$0
Aggregated Statistics For Year 2001 (Based on 2 full tracts)
B) Conventional Home Purchase Loans
C) Refinancings
D) Home Improvement Loans
F) Non-occupant Loans on < 5 Family Dwellings (A B C & D)
Number
Average Value
Number
Average Value
Number
Average Value
Number
Average Value
LOANS ORIGINATED
63
$292,835
122
$264,270
4
$99,090
10
$143,437
APPLICATIONS APPROVED, NOT ACCEPTED
2
$237,425
10
$209,759
0
$0
0
$0
APPLICATIONS DENIED
6
$55,595
10
$241,743
4
$9,320
0
$0
APPLICATIONS WITHDRAWN
8
$140,298
16
$280,349
0
$0
0
$0
FILES CLOSED FOR INCOMPLETENESS
2
$156,975
4
$292,858
0
$0
0
$0
Aggregated Statistics For Year 2000 (Based on 2 full tracts)
B) Conventional Home Purchase Loans
C) Refinancings
D) Home Improvement Loans
F) Non-occupant Loans on < 5 Family Dwellings (A B C & D)
Number
Average Value
Number
Average Value
Number
Average Value
Number
Average Value
LOANS ORIGINATED
47
$273,831
29
$192,634
10
$49,251
4
$206,030
APPLICATIONS APPROVED, NOT ACCEPTED
6
$513,442
0
$0
2
$3,925
0
$0
APPLICATIONS DENIED
6
$19,295
8
$132,204
2
$3,925
0
$0
APPLICATIONS WITHDRAWN
8
$111,355
6
$131,140
0
$0
0
$0
FILES CLOSED FOR INCOMPLETENESS
4
$490,550
2
$196,220
0
$0
0
$0
Aggregated Statistics For Year 1999 (Based on 1 full and 1 partial tracts)
A) FHA, FSA/RHS & VA Home Purchase Loans
B) Conventional Home Purchase Loans
C) Refinancings
D) Home Improvement Loans
F) Non-occupant Loans on < 5 Family Dwellings (A B C & D)


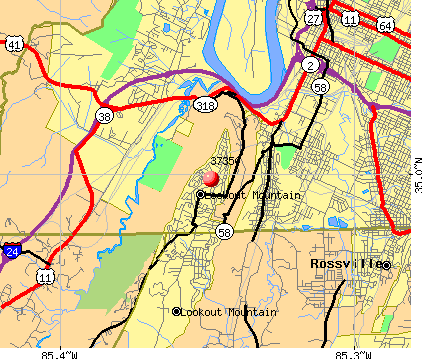 Nearest zip codes: 37409, 37410, 37408, 37402, 37407, 30750.