Estimated zip code population in 2022: 4,266 Zip code population in 2010: 3,033 Zip code population in 2000: 2,629
Houses and condos: 1,513 Renter-occupied apartments: 270
% of renters here:
18%
State:
33%
March 2022 cost of living index in zip code 37180: 79.2 (low, U.S. average is 100)
Land area: 31.7 sq. mi. Water area: 0.2 sq. mi.
Population density: 135 people per square mile
(very low).
OSM Map
General Map
Google Map
MSN Map
OSM Map
General Map
Google Map
MSN Map
OSM Map
General Map
Google Map
MSN Map
OSM Map
General Map
Google Map
MSN Map
Please wait while loading the map...
Real estate property taxes paid for housing units in 2022:
This zip code:
0.4% ($1,140)
Tennessee:
0.5% ($1,376)
Median real estate property taxes paid for housing units with mortgages in 2022: $1,257 (0.4%) Median real estate property taxes paid for housing units with no mortgage in 2022: $860 (0.4%)
Estimated median house/condo value in 2022: $314,863
37180:
$314,863
Tennessee:
$284,800
According to our research of Tennessee and other state lists, there were 8 registered sex offenders living in 37180 zip code as of May 28, 2024. The ratio of all residents to sex offenders in zip code 37180 is 420 to 1. The ratio of registered sex offenders to all residents in this zip code is lower than the state average.
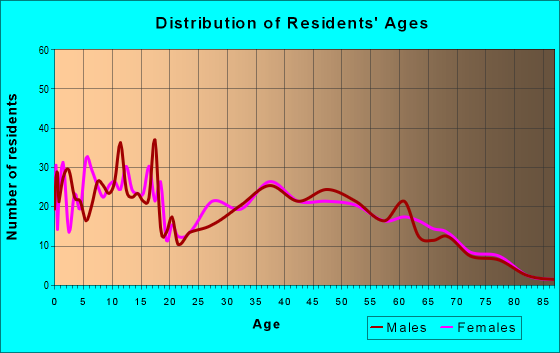
Median resident age:
This zip code:
42.8 years
Tennessee median age:
39.2 years
Average household size:
This zip code:
2.8 people
Tennessee:
2.4 people
Averages for the 2020 tax year for zip code 37180, filed in 2021:
Average Adjusted Gross Income (AGI) in 2020: $53,809 (Individual Income Tax Returns)
Here:
$53,809
State:
$69,014
Salary/wage: $48,182 (reported on 85.4% of returns)
Here:
$48,182
State:
$55,872
(% of AGI for various income ranges: 1061.0% for AGIs below $25k, 3380.0% for AGIs $25k-50k, 6579.6% for AGIs $50k-75k, 9100.0% for AGIs $75k-100k, 14240.0% for AGIs $100k-200k)
Taxable interest for individuals: $830 (reported on 23.4% of returns)
This zip code:
$830
Tennessee:
$1,945
(% of AGI for various income ranges: 21.2% for AGIs below $25k, 6.0% for AGIs $25k-50k, 21.7% for AGIs $50k-75k, 17.9% for AGIs $75k-100k, 112.7% for AGIs $100k-200k)
Ordinary dividends: $2,107 (reported on 9.5% of returns)
Here:
$2,107
State:
$8,105
(% of AGI for various income ranges: 7.8% for AGIs below $25k, 7.7% for AGIs $25k-50k, 12.5% for AGIs $50k-75k, 78.6% for AGIs $75k-100k, 107.3% for AGIs $100k-200k)
Net capital gain/loss in AGI: +$22,793 (reported on 8.9% of returns)
Here:
+$22,793
State:
+$33,664
(% of AGI for various income ranges: 19.5% for AGIs below $25k, 49.6% for AGIs $50k-75k, 61.4% for AGIs $75k-100k, 623.6% for AGIs $100k-200k)
Profit/loss from business: +$10,872 (reported on 15.8% of returns)
Here:
+$10,872
State:
+$18,991
(% of AGI for various income ranges: 189.8% for AGIs below $25k, 178.0% for AGIs $25k-50k, 102.9% for AGIs $50k-75k, 227.9% for AGIs $75k-100k, 700.0% for AGIs $100k-200k)
Taxable individual retirement arrangement distribution: $12,171 (reported on 4.4% of returns)
37180:
$12,171
Tennessee:
$20,036
(% of AGI for various income ranges: 22.8% for AGIs below $25k, 102.0% for AGIs $25k-50k, 288.6% for AGIs $75k-100k)
Total itemized deductions: $33,933 (reported on 1.9% of returns)
Here:
$33,933
State:
$40,136
(% of AGI for various income ranges: 727.1% for AGIs $75k-100k)
Charity contributions: $14,800 (reported on 1.3% of returns)
Here:
$14,800
State:
$19,852
(% of AGI for various income ranges: 84.6% for AGIs $25k-50k)
Taxes paid: $4,400 (reported on 1.9% of returns)
37180:
$4,400
State:
$6,038
(% of AGI for various income ranges: 94.3% for AGIs $75k-100k)
Earned income credit: $2,246 (reported on 16.5% of returns)
Here:
$2,246
State:
$2,391
(% of AGI for various income ranges: 81.8% for AGIs below $25k, 73.4% for AGIs $25k-50k)
Percentage of individuals using paid preparers for their 2020 taxes: 94.3%
Here:
94%
State:
93%
(% for various income ranges: 92.3% for AGIs below $25k, 97.4% for AGIs $25k-50k, 96.7% for AGIs $50k-75k, 94.4% for AGIs $75k-100k, 93.3% for AGIs $100k-200k, 75.0% for AGIs over 200k)
Averages for the 2012 tax year for zip code 37180, filed in 2013:
Average Adjusted Gross Income (AGI) in 2012: $41,052 (Individual Income Tax Returns)
Here:
$41,052
State:
$53,767
Salary/wage: $38,019 (reported on 86.6% of returns)
Here:
$38,019
State:
$45,421
(% of AGI for various income ranges: 74.1% for AGIs below $25k, 84.3% for AGIs $25k-50k, 85.6% for AGIs $50k-75k, 83.9% for AGIs $75k-100k, 69.8% for AGIs $100k-200k)
Taxable interest for individuals: $924 (reported on 26.0% of returns)
This zip code:
$924
Tennessee:
$1,732
(% of AGI for various income ranges: 1.9% for AGIs below $25k, 0.3% for AGIs $25k-50k, 0.2% for AGIs $50k-75k, 0.4% for AGIs $75k-100k, 0.7% for AGIs $100k-200k)
Ordinary dividends: $1,340 (reported on 7.9% of returns)
Here:
$1,340
State:
$6,739
(% of AGI for various income ranges: 0.2% for AGIs below $25k, 0.5% for AGIs $25k-50k, 0.6% for AGIs $75k-100k)
Net capital gain/loss in AGI: +$2,250 (reported on 4.7% of returns)
Here:
+$2,250
State:
+$19,082
(% of AGI for various income ranges: 1.0% for AGIs below $25k, 0.4% for AGIs $25k-50k, 0.2% for AGIs $75k-100k)
Profit/loss from business: +$7,643 (reported on 16.5% of returns)
Here:
+$7,643
State:
+$15,240
(% of AGI for various income ranges: 8.5% for AGIs below $25k, 2.1% for AGIs $25k-50k, 4.7% for AGIs $50k-75k, 2.1% for AGIs $75k-100k)
Taxable individual retirement arrangement distribution: $7,114 (reported on 5.5% of returns)
37180:
$7,114
Tennessee:
$15,505
Total itemized deductions: $16,435 (23% of AGI, reported on 15.7% of returns)
Here:
$16,435
State:
$21,976
Here:
23.2% of AGI
State:
17.8% of AGI
(% of AGI for various income ranges: 7.7% for AGIs $25k-50k, 6.7% for AGIs $50k-75k, 6.5% for AGIs $75k-100k, 7.7% for AGIs $100k-200k)
Charity contributions: $4,500 (reported on 11.0% of returns)
Here:
$4,500
State:
$6,709
(% of AGI for various income ranges: 0.6% for AGIs $25k-50k, 1.4% for AGIs $50k-75k, 1.3% for AGIs $75k-100k, 2.3% for AGIs $100k-200k)
Taxes paid: $3,042 (reported on 15.0% of returns)
37180:
$3,042
State:
$4,829
(% of AGI for various income ranges: 1.0% for AGIs $25k-50k, 1.1% for AGIs $50k-75k, 1.2% for AGIs $75k-100k, 1.8% for AGIs $100k-200k)
Earned income credit: $2,239 (reported on 26.0% of returns)
Here:
$2,239
State:
$2,404
(% of AGI for various income ranges: 8.0% for AGIs below $25k, 1.6% for AGIs $25k-50k)
Percentage of individuals using paid preparers for their 2012 taxes: 59.1%
Here:
59%
State:
52%
(% for various income ranges: 55.8% for AGIs below $25k, 59.5% for AGIs $25k-50k, 57.1% for AGIs $50k-75k, 70.0% for AGIs $75k-100k, 71.4% for AGIs $100k-200k)
Averages for the 2004 tax year for zip code 37180, filed in 2005:
Average Adjusted Gross Income (AGI) in 2004: $35,027 (Individual Income Tax Returns)
Here:
$35,027
State:
$44,088
Salary/wage: $34,986 (reported on 87.9% of returns)
Here:
$34,986
State:
$38,825
(% of AGI for various income ranges: 115.3% for AGIs below $10k, 80.3% for AGIs $10k-25k, 90.0% for AGIs $25k-50k, 93.0% for AGIs $50k-75k, 87.2% for AGIs $75k-100k, 74.3% for AGIs over 100k)
Taxable interest for individuals: $1,003 (reported on 31.6% of returns)
This zip code:
$1,003
Tennessee:
$1,802
(% of AGI for various income ranges: 7.3% for AGIs below $10k, 1.8% for AGIs $10k-25k, 0.8% for AGIs $25k-50k, 0.7% for AGIs $50k-75k, 0.2% for AGIs $75k-100k, 0.7% for AGIs over 100k)
Taxable dividends: $714 (reported on 10.1% of returns)
Here:
$714
State:
$3,727
(% of AGI for various income ranges: 2.6% for AGIs below $10k, 0.4% for AGIs $10k-25k, 0.1% for AGIs $25k-50k, 0.2% for AGIs $50k-75k, 0.1% for AGIs $75k-100k, 0.1% for AGIs over 100k)
Net capital gain/loss: +$7,538 (reported on 8.2% of returns)
Here:
+$7,538
State:
+$15,776
(% of AGI for various income ranges: 2.3% for AGIs below $10k, 1.6% for AGIs $10k-25k, 0.1% for AGIs $25k-50k, 0.0% for AGIs $50k-75k, 9.5% for AGIs $75k-100k)
Profit/loss from business: +$4,276 (reported on 16.6% of returns)
Here:
+$4,276
State:
+$12,882
(% of AGI for various income ranges: 1.2% for AGIs below $10k, 4.6% for AGIs $10k-25k, 2.6% for AGIs $25k-50k, 1.1% for AGIs $50k-75k, 2.0% for AGIs $75k-100k)
IRA payment deduction: $2,083 (reported on 1.1% of returns)
37180:
$2,083
Tennessee:
$2,934
Total itemized deductions: $14,762 (26% of AGI, reported on 16.3% of returns)
Here:
$14,762
State:
$18,035
Here:
25.9% of AGI
State:
19.9% of AGI
(% of AGI for various income ranges: 7.4% for AGIs $10k-25k, 6.0% for AGIs $25k-50k, 6.6% for AGIs $50k-75k, 6.7% for AGIs $75k-100k, 10.4% for AGIs over 100k)
Charity contributions deductions: $3,060 (5% of AGI, reported on 12.0% of returns)
Here:
$3,060
State:
$5,167
Here:
5.0% of AGI
State:
5.3% of AGI
(% of AGI for various income ranges: 0.4% for AGIs $10k-25k, 0.5% for AGIs $25k-50k, 1.1% for AGIs $50k-75k, 1.6% for AGIs $75k-100k, 2.7% for AGIs over 100k)
Total tax: $3,862 (reported on 72.5% of returns)
37180:
$3,862
State:
$7,482
(% of AGI for various income ranges: 4.5% for AGIs below $10k, 4.0% for AGIs $10k-25k, 6.1% for AGIs $25k-50k, 8.2% for AGIs $50k-75k, 10.5% for AGIs $75k-100k, 14.6% for AGIs over 100k)
Earned income credit: $1,671 (reported on 21.9% of returns)
Here:
$1,671
State:
$1,826
Percentage of individuals using paid preparers for their 2004 taxes: 67.9%
Here:
68%
State:
60%
(% for various income ranges: 64.0% for AGIs below $10k, 73.3% for AGIs $10k-25k, 67.8% for AGIs $25k-50k, 63.1% for AGIs $50k-75k, 73.2% for AGIs $75k-100k, 58.8% for AGIs over 100k)
Household received Food Stamps/SNAP in the past 12 months: 130 Household did not receive Food Stamps/SNAP in the past 12 months: 1,395
Women who had a birth in the past 12 months: 80 (81 now married, 0 unmarried) Women who did not have a birth in the past 12 months: 912 (433 now married, 478 unmarried)
Housing units in zip code 37180 with a mortgage: 722 (49 second mortgage, 39 both second mortgage and home equity loan) Houses without a mortgage: 43
Median monthly owner costs for units with a mortgage: $1,236 Median monthly owner costs for units without a mortgage: $427
Residents with income below the poverty level in 2022:
This zip code:
4.1%
Whole state:
13.3%
Residents with income below 50% of the poverty level in 2022:
This zip code:
1.0%
Whole state:
7.1%
Median number of rooms in houses and condos:
Here:
6.0
State:
6.5
Median number of rooms in apartments:
Here:
4.6
State:
4.4
Notable locations in this zip code not listed on our city pages
Churches in zip code 37180 include: Longview Baptist Church (A), Rover Baptist Church (B), Enon Church (C), Unionville First Baptist Church (D), Unionville Methodist Church (E), Kingdom Church (F), Zion Hill United Methodist Church (G), Maxwell Chapel United Methodist Church (H). Display/hide their locations on the map
Cemeteries: Tarpley Cemetery (1), Taylor Cemetery (2), Jones Cemetery (3), Kimmins Cemetery (4), Landers Cemetery (5), Winsett Cemetery (6), Woodson Cemetery (7). Display/hide their locations on the map
Size of family households: 501 2-persons, 468 3-persons, 207 4-persons, 80 5-persons, 17 6-persons, 16 7-or-more-persons
Size of nonfamily households: 218 1-person, 14 2-persons
499 married couples with children.
163 single-parent households (73 men, 90 women).
99.6% of residents of 37180 zip code speak English at home.
Foreign born population: 10 (0.2%) (0.0% of them are naturalized citizens)
:
0.2%
Whole state:
5.6%
60%Serbia
64%American
9%English
7%Irish
3%German
2%Scottish
2%Dutch
1%European
Year of entry for the foreign-born population
122010 or later
02000 to 2009
01990 to 1999
0Before 1990
Facilities with environmental interests located in this zip code:
COMMUNITY ELEMENTARY (3480 HIGHWAY 41A in UNIONVILLE, TN)
(National Center for Education Statistics) - STATE ID-0033 Organizations: BEDFORD COUNTY SCHOOL DISTRICT (SCHOOL DISTRICT)
COMMUNITY SCHOOL (3470 HWY 41A N in UNIONVILLE, TN)
(National Center for Education Statistics) - STATE ID-0035 Organizations: BEDFORD COUNTY SCHOOL DISTRICT (SCHOOL DISTRICT)
87.9%Electricity
10.1%Bottled, tank, or LP gas
2.1%Wood
Population in 1990: 1,772. Population change in the 1990s: +857 (+48.4%).
Place of birth for U.S.-born residents:
This state: 3,187
Northeast: 113
Midwest: 508
South: 314
West: 86
57% of the 37180 zip code residents lived in the same house 5 years ago. Out of people who lived in different houses, 57% lived in this county. Out of people who lived in different counties, 50% lived in Tennessee.
97% of the 37180 zip code residents lived in the same house 1 year ago. Out of people who lived in different houses, 42% moved from this county. Out of people who lived in different houses, 70% moved from different county within same state.
Private vs. public school enrollment:
Students in private schools in grades 1 to 8 (elementary and middle school): 13
Here:
4.0%
Tennessee:
15.0%
Students in private schools in grades 9 to 12 (high school):
Here:
0.0%
Tennessee:
16.2%
Students in private undergraduate colleges: 11
Here:
20.3%
Tennessee:
23.5%
Occupation by median earnings in the past 12 months ($)
96,564Management occupations
74,880Construction and extraction occupations
53,139Transportation occupations
52,688Education, training, and library occupations
50,099Production occupations
49,183Installation, maintenance, and repair occupations
Top industries in this zip code by the number of employees in 2005:
Health Care and Social Assistance: Child Day Care Services (5-9: 1)
Other Services (except Public Administration): General Automotive Repair (1-4: 1)
Administrative and Support and Waste Management and Remediation Services: Exterminating and Pest Control Services (1-4: 1)
Other Services (except Public Administration): Religious Organizations (1-4: 1)
Other Services (except Public Administration): Commercial and Industrial Machinery and Equipment (except Automotive and Electronic) Repair and Maintenance (1-4: 1)
Construction: Plumbing, Heating, and Air-Conditioning Contractors (1-4: 1)
Fatal accident statistics in 2012:
Fatal accident count: 1
Vehicles involved in fatal accidents: 1
Fatal accidents caused by drunken drivers: 1
Fatalities: 1
Persons involved in fatal accidents: 2
Pedestrians involved in fatal accidents: 0
2002 - 2018 National Fire Incident Reporting System (NFIRS) incidents
According to the data from the years 2002 - 2018 the average number of fire incidents per year is 16. The highest number of reported fires - 30 took place in 2010, and the least - 8 in 2013. The data has an increasing trend.
When looking into fire subcategories, the most incidents belonged to: Outside Fires (48.7%), and Structure Fires (31.9%).
Fire incident types reported to NFIRS in Zip Code 37180
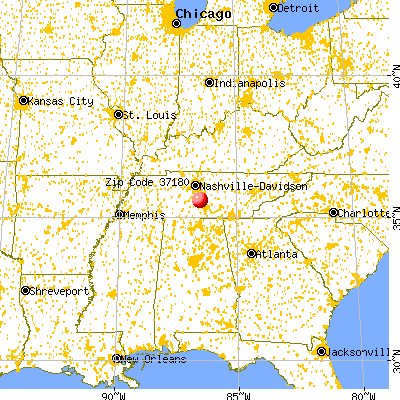


 Nearest zip codes: 37034, 37060, 37153, 37020, 37160, 37128.


 According to the data from the years 2002 - 2018 the average number of fire incidents per year is 16. The highest number of reported fires - 30 took place in 2010, and the least - 8 in 2013. The data has an increasing trend.
 When looking into fire subcategories, the most incidents belonged to: Outside Fires (48.7%), and Structure Fires (31.9%).