Estimated zip code population in 2022: 4,143 Zip code population in 2010: 3,818 Zip code population in 2000: 4,333
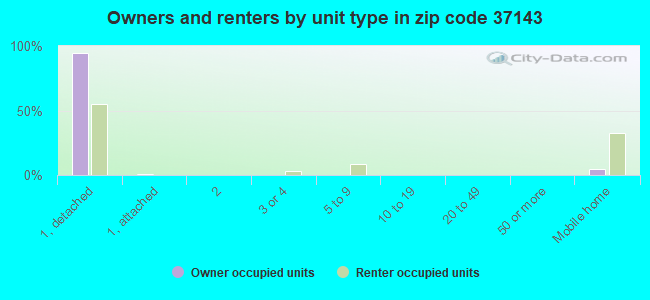
Houses and condos: 1,668 Renter-occupied apartments: 231
% of renters here:
15%
State:
33%
March 2022 cost of living index in zip code 37143: 81.7 (low, U.S. average is 100)
Land area: 27.9 sq. mi. Water area: 0.0 sq. mi.
Population density: 149 people per square mile
(very low).
OSM Map
General Map
Google Map
MSN Map
OSM Map
General Map
Google Map
MSN Map
OSM Map
General Map
Google Map
MSN Map
OSM Map
General Map
Google Map
MSN Map
Please wait while loading the map...
Real estate property taxes paid for housing units in 2022:
This zip code:
0.5% ($1,786)
Tennessee:
0.5% ($1,376)
Median real estate property taxes paid for housing units with mortgages in 2022: $1,725 (0.4%) Median real estate property taxes paid for housing units with no mortgage in 2022: $2,080 (0.6%)
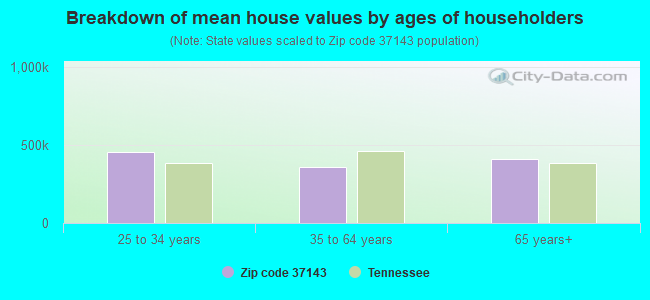
Estimated median house/condo value in 2022: $375,480
37143:
$375,480
Tennessee:
$284,800
According to our research of Tennessee and other state lists, there were 6 registered sex offenders living in 37143 zip code as of May 22, 2024. The ratio of all residents to sex offenders in zip code 37143 is 650 to 1. The ratio of registered sex offenders to all residents in this zip code is lower than the state average.
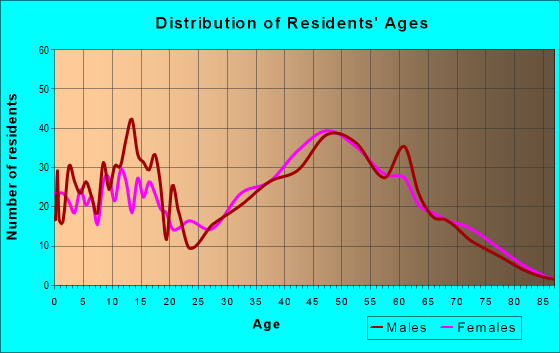
Median resident age:
This zip code:
41.0 years
Tennessee median age:
39.2 years
Average household size:
This zip code:
2.6 people
Tennessee:
2.4 people
Averages for the 2020 tax year for zip code 37143, filed in 2021:
Average Adjusted Gross Income (AGI) in 2020: $65,333 (Individual Income Tax Returns)
Here:
$65,333
State:
$69,014
Salary/wage: $59,526 (reported on 79.6% of returns)
Here:
$59,526
State:
$55,872
(% of AGI for various income ranges: 1032.7% for AGIs below $25k, 3574.4% for AGIs $25k-50k, 6661.0% for AGIs $50k-75k, 9732.5% for AGIs $75k-100k, 17176.7% for AGIs $100k-200k)
Taxable interest for individuals: $998 (reported on 26.4% of returns)
This zip code:
$998
Tennessee:
$1,945
(% of AGI for various income ranges: 13.4% for AGIs below $25k, 14.4% for AGIs $25k-50k, 36.7% for AGIs $50k-75k, 32.5% for AGIs $75k-100k, 52.4% for AGIs $100k-200k)
Ordinary dividends: $5,144 (reported on 16.9% of returns)
Here:
$5,144
State:
$8,105
(% of AGI for various income ranges: 6.8% for AGIs below $25k, 35.9% for AGIs $25k-50k, 78.1% for AGIs $50k-75k, 88.8% for AGIs $75k-100k, 221.0% for AGIs $100k-200k)
Net capital gain/loss in AGI: +$16,829 (reported on 13.9% of returns)
Here:
+$16,829
State:
+$33,664
(% of AGI for various income ranges: 4.5% for AGIs below $25k, 47.9% for AGIs $25k-50k, 125.7% for AGIs $50k-75k, 20.0% for AGIs $75k-100k, 757.6% for AGIs $100k-200k)
Profit/loss from business: +$19,300 (reported on 22.4% of returns)
Here:
+$19,300
State:
+$18,991
(% of AGI for various income ranges: 254.8% for AGIs below $25k, 392.9% for AGIs $25k-50k, 346.7% for AGIs $50k-75k, 603.1% for AGIs $75k-100k, 1329.0% for AGIs $100k-200k)
Taxable individual retirement arrangement distribution: $17,300 (reported on 8.5% of returns)
37143:
$17,300
Tennessee:
$20,036
(% of AGI for various income ranges: 59.3% for AGIs below $25k, 117.6% for AGIs $25k-50k, 262.9% for AGIs $50k-75k, 349.4% for AGIs $75k-100k, 556.7% for AGIs $100k-200k)
Total itemized deductions: $29,238 (reported on 4.0% of returns)
Here:
$29,238
State:
$40,136
(% of AGI for various income ranges: 349.5% for AGIs $50k-75k, 764.3% for AGIs $100k-200k)
Charity contributions: $14,620 (reported on 2.5% of returns)
Here:
$14,620
State:
$19,852
(% of AGI for various income ranges: 12.6% for AGIs $25k-50k, 327.6% for AGIs $100k-200k)
Taxes paid: $5,212 (reported on 4.0% of returns)
37143:
$5,212
State:
$6,038
(% of AGI for various income ranges: 76.7% for AGIs $50k-75k, 121.9% for AGIs $100k-200k)
Earned income credit: $2,019 (reported on 13.4% of returns)
Here:
$2,019
State:
$2,391
(% of AGI for various income ranges: 86.6% for AGIs below $25k, 48.2% for AGIs $25k-50k)
Percentage of individuals using paid preparers for their 2020 taxes: 91.5%
Here:
92%
State:
93%
(% for various income ranges: 90.3% for AGIs below $25k, 93.3% for AGIs $25k-50k, 90.0% for AGIs $50k-75k, 90.9% for AGIs $75k-100k, 91.4% for AGIs $100k-200k, 100.0% for AGIs over 200k)
Averages for the 2012 tax year for zip code 37143, filed in 2013:
Average Adjusted Gross Income (AGI) in 2012: $51,849 (Individual Income Tax Returns)
Here:
$51,849
State:
$53,767
Salary/wage: $47,646 (reported on 84.6% of returns)
Here:
$47,646
State:
$45,421
(% of AGI for various income ranges: 66.6% for AGIs below $25k, 77.2% for AGIs $25k-50k, 84.5% for AGIs $50k-75k, 84.3% for AGIs $75k-100k, 82.6% for AGIs $100k-200k, 41.7% for AGIs over 200k)
Taxable interest for individuals: $528 (reported on 31.9% of returns)
This zip code:
$528
Tennessee:
$1,732
(% of AGI for various income ranges: 1.1% for AGIs below $25k, 0.4% for AGIs $25k-50k, 0.2% for AGIs $50k-75k, 0.2% for AGIs $75k-100k, 0.3% for AGIs $100k-200k)
Ordinary dividends: $1,968 (reported on 15.4% of returns)
Here:
$1,968
State:
$6,739
(% of AGI for various income ranges: 2.1% for AGIs below $25k, 0.5% for AGIs $25k-50k, 0.3% for AGIs $50k-75k, 0.7% for AGIs $75k-100k, 0.5% for AGIs $100k-200k)
Net capital gain/loss in AGI: +$5,311 (reported on 10.4% of returns)
Here:
+$5,311
State:
+$19,082
(% of AGI for various income ranges: 0.8% for AGIs $25k-50k, 0.7% for AGIs $50k-75k, 3.0% for AGIs $100k-200k)
Profit/loss from business: +$15,025 (reported on 22.0% of returns)
Here:
+$15,025
State:
+$15,240
(% of AGI for various income ranges: 17.5% for AGIs below $25k, 6.5% for AGIs $25k-50k, 2.7% for AGIs $50k-75k, 5.8% for AGIs $75k-100k, 7.6% for AGIs $100k-200k)
Taxable individual retirement arrangement distribution: $13,087 (reported on 8.2% of returns)
37143:
$13,087
Tennessee:
$15,505
(% of AGI for various income ranges: 3.3% for AGIs below $25k, 2.9% for AGIs $25k-50k, 2.0% for AGIs $50k-75k, 1.5% for AGIs $75k-100k, 2.2% for AGIs $100k-200k)
Total itemized deductions: $17,960 (21% of AGI, reported on 26.4% of returns)
Here:
$17,960
State:
$21,976
Here:
21.3% of AGI
State:
17.8% of AGI
(% of AGI for various income ranges: 9.6% for AGIs below $25k, 8.3% for AGIs $25k-50k, 8.8% for AGIs $50k-75k, 9.9% for AGIs $75k-100k, 8.2% for AGIs $100k-200k, 12.8% for AGIs over 200k)
Charity contributions: $4,156 (reported on 19.8% of returns)
Here:
$4,156
State:
$6,709
(% of AGI for various income ranges: 0.5% for AGIs below $25k, 1.0% for AGIs $25k-50k, 1.1% for AGIs $50k-75k, 1.3% for AGIs $75k-100k, 2.0% for AGIs $100k-200k, 4.3% for AGIs over 200k)
Taxes paid: $3,704 (reported on 25.8% of returns)
37143:
$3,704
State:
$4,829
(% of AGI for various income ranges: 1.6% for AGIs below $25k, 1.5% for AGIs $25k-50k, 1.7% for AGIs $50k-75k, 1.9% for AGIs $75k-100k, 1.9% for AGIs $100k-200k, 2.9% for AGIs over 200k)
Earned income credit: $1,983 (reported on 15.9% of returns)
Here:
$1,983
State:
$2,404
(% of AGI for various income ranges: 5.5% for AGIs below $25k, 0.9% for AGIs $25k-50k)
Percentage of individuals using paid preparers for their 2012 taxes: 48.4%
Here:
48%
State:
52%
(% for various income ranges: 43.9% for AGIs below $25k, 47.7% for AGIs $25k-50k, 51.9% for AGIs $50k-75k, 50.0% for AGIs $75k-100k, 52.4% for AGIs $100k-200k, 100.0% for AGIs over 200k)
Averages for the 2004 tax year for zip code 37143, filed in 2005:
Average Adjusted Gross Income (AGI) in 2004: $44,181 (Individual Income Tax Returns)
Here:
$44,181
State:
$44,088
Salary/wage: $42,592 (reported on 86.9% of returns)
Here:
$42,592
State:
$38,825
(% of AGI for various income ranges: 135.4% for AGIs below $10k, 72.0% for AGIs $10k-25k, 82.8% for AGIs $25k-50k, 88.6% for AGIs $50k-75k, 91.3% for AGIs $75k-100k, 75.2% for AGIs over 100k)
Taxable interest for individuals: $676 (reported on 38.1% of returns)
This zip code:
$676
Tennessee:
$1,802
(% of AGI for various income ranges: 3.2% for AGIs below $10k, 1.4% for AGIs $10k-25k, 0.8% for AGIs $25k-50k, 0.3% for AGIs $50k-75k, 0.3% for AGIs $75k-100k, 0.5% for AGIs over 100k)
Taxable dividends: $946 (reported on 16.4% of returns)
Here:
$946
State:
$3,727
(% of AGI for various income ranges: 1.1% for AGIs below $10k, 0.8% for AGIs $10k-25k, 0.2% for AGIs $25k-50k, 0.4% for AGIs $50k-75k, 0.1% for AGIs $75k-100k, 0.4% for AGIs over 100k)
Net capital gain/loss: +$6,878 (reported on 13.1% of returns)
Here:
+$6,878
State:
+$15,776
(% of AGI for various income ranges: -1.1% for AGIs below $10k, 0.4% for AGIs $10k-25k, 0.4% for AGIs $25k-50k, 0.3% for AGIs $50k-75k, -0.1% for AGIs $75k-100k, 7.4% for AGIs over 100k)
Profit/loss from business: +$12,039 (reported on 24.2% of returns)
Here:
+$12,039
State:
+$12,882
(% of AGI for various income ranges: 1.4% for AGIs below $10k, 12.3% for AGIs $10k-25k, 7.6% for AGIs $25k-50k, 6.2% for AGIs $50k-75k, 4.4% for AGIs $75k-100k, 6.2% for AGIs over 100k)
IRA payment deduction: $3,128 (reported on 2.1% of returns)
37143:
$3,128
Tennessee:
$2,934
Self-employed pension: $6,889 (reported on 1.0% of returns)
Here:
$6,889
Tennessee:
$16,857
Total itemized deductions: $14,795 (22% of AGI, reported on 34.5% of returns)
Here:
$14,795
State:
$18,035
Here:
21.9% of AGI
State:
19.9% of AGI
(% of AGI for various income ranges: 18.8% for AGIs below $10k, 12.1% for AGIs $10k-25k, 12.8% for AGIs $25k-50k, 11.8% for AGIs $50k-75k, 11.6% for AGIs $75k-100k, 9.7% for AGIs over 100k)
Charity contributions deductions: $2,976 (4% of AGI, reported on 27.6% of returns)
Here:
$2,976
State:
$5,167
Here:
4.1% of AGI
State:
5.3% of AGI
(% of AGI for various income ranges: 1.3% for AGIs below $10k, 0.9% for AGIs $10k-25k, 1.6% for AGIs $25k-50k, 1.7% for AGIs $50k-75k, 2.2% for AGIs $75k-100k, 2.3% for AGIs over 100k)
Total tax: $6,050 (reported on 79.7% of returns)
37143:
$6,050
State:
$7,482
(% of AGI for various income ranges: 5.1% for AGIs below $10k, 5.0% for AGIs $10k-25k, 7.6% for AGIs $25k-50k, 8.9% for AGIs $50k-75k, 10.8% for AGIs $75k-100k, 17.9% for AGIs over 100k)
Earned income credit: $1,704 (reported on 13.2% of returns)
Here:
$1,704
State:
$1,826
Percentage of individuals using paid preparers for their 2004 taxes: 52.4%
Here:
52%
State:
60%
(% for various income ranges: 42.7% for AGIs below $10k, 57.5% for AGIs $10k-25k, 53.1% for AGIs $25k-50k, 49.8% for AGIs $50k-75k, 56.4% for AGIs $75k-100k, 59.4% for AGIs over 100k)
Likely homosexual households (counted as self-reported same-sex unmarried-partner households)
Lesbian couples: 0.6% of all households
Gay men: 0.0% of all households
Household received Food Stamps/SNAP in the past 12 months: 71 Household did not receive Food Stamps/SNAP in the past 12 months: 1,526
Women who had a birth in the past 12 months: 17 (8 now married, 9 unmarried) Women who did not have a birth in the past 12 months: 911 (443 now married, 467 unmarried)
Housing units in zip code 37143 with a mortgage: 907 (128 second mortgage, 31 home equity loan, 107 both second mortgage and home equity loan) Houses without a mortgage: 17
Median monthly owner costs for units with a mortgage: $1,660 Median monthly owner costs for units without a mortgage: $518
Residents with income below the poverty level in 2022:
This zip code:
3.1%
Whole state:
13.3%
Residents with income below 50% of the poverty level in 2022:
This zip code:
3.1%
Whole state:
7.1%
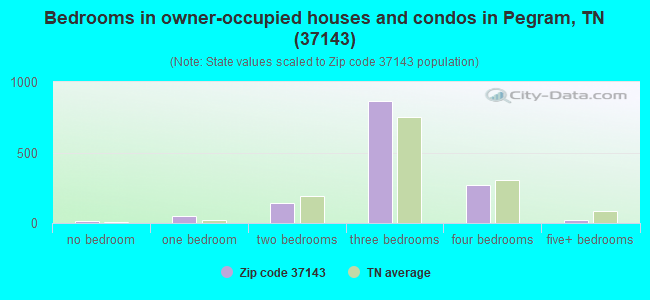
Median number of rooms in houses and condos:
Here:
6.2
State:
6.5
Median number of rooms in apartments:
Here:
4.2
State:
4.4
Notable locations in this zip code not listed on our city pages
In group quarters: 10 (-1 institutionalized population)
Size of family households: 426 2-persons, 298 3-persons, 172 4-persons, 140 5-persons, 51 6-persons, 31 7-or-more-persons
Size of nonfamily households: 434 1-person, 35 2-persons
649 married couples with children.
107 single-parent households (107 women).
97.0% of residents of 37143 zip code speak English at home.
1.0% of residents speak Spanish at home (40% very well, 60% well).
0.9% of residents speak other Indo-European language at home (56% very well, 44% well).
0.6% of residents speak other language at home (54% very well, 25% well, 21% not at all).
Foreign born population: 95 (2.3%) (37.0% of them are naturalized citizens)
This zip code:
2.3%
Whole state:
5.6%
38%Bhutan
27%Costa Rica
9%El Salvador
4%Kuwait
30%American
25%English
12%Irish
4%European
3%German
1%Scottish
1%Danish
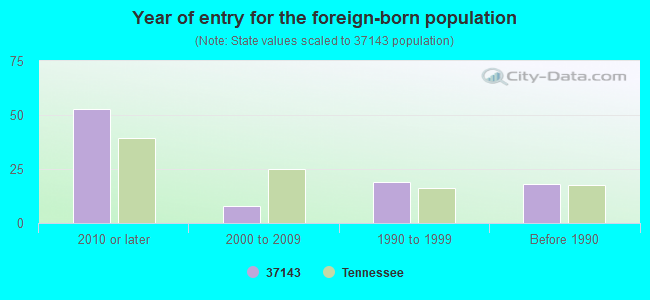
Year of entry for the foreign-born population
532010 or later
82000 to 2009
191990 to 1999
18Before 1990
Facilities with environmental interests located in this zip code:
DESIGN KRAFT CABINETS (518 THOMPSON ROAD in PEGRAM, TN)
(Resource Conservation and Recovery Act (tracking hazardous waste)) Organizations: MICHAEL ERNEST (CONTACT/OPERATOR)
CA-JON WELDING CO (RT 1 PONDS CREEK RD in PEGRAM, TN)
(Resource Conservation and Recovery Act (tracking hazardous waste)) Business NAICS classification: ALL OTHER TRANSPORTATION EQUIPMENT MANUFACTURING.
Housing units lacking complete plumbing facilities: 0.9% Housing units lacking complete kitchen facilities: 0.9%
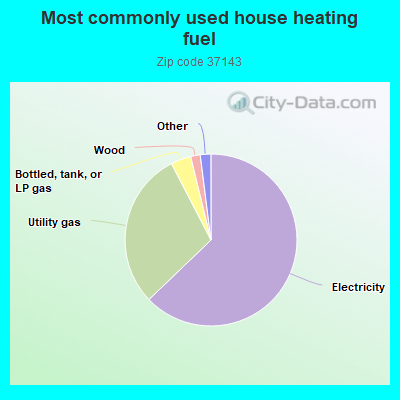
62.9%Electricity
29.6%Utility gas
3.8%Bottled, tank, or LP gas
1.8%Wood
1.0%Solar energy
0.6%Fuel oil, kerosene, etc.
0.5%Other fuel
Population in 1990: 2,742. Population change in the 1990s: +1,591 (+58.0%).
Place of birth for U.S.-born residents:
This state: 2,638
Northeast: 215
Midwest: 398
South: 550
West: 239
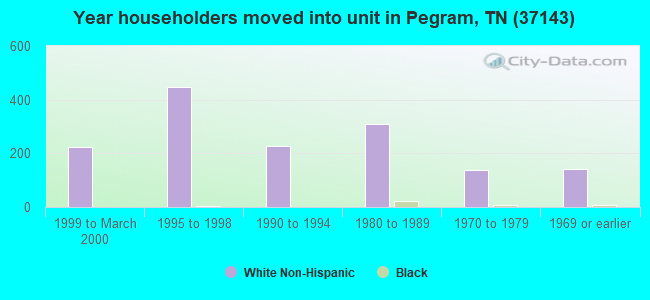
57% of the 37143 zip code residents lived in the same house 5 years ago. Out of people who lived in different houses, 27% lived in this county. Out of people who lived in different counties, 50% lived in Tennessee.
96% of the 37143 zip code residents lived in the same house 1 year ago. Out of people who lived in different houses, 92% moved from different county within same state. Out of people who lived in different houses, 15% moved from different state. Out of people who lived in different houses, 11% moved from abroad.
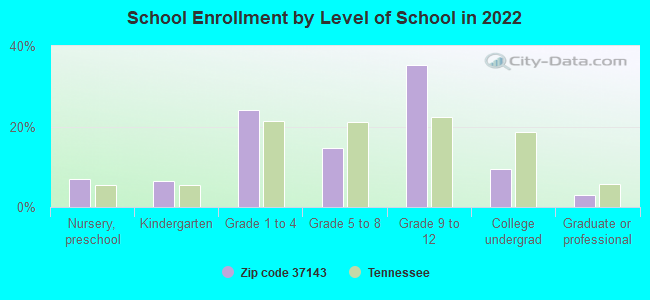
Private vs. public school enrollment:
Students in private schools in grades 1 to 8 (elementary and middle school): 49
Here:
13.5%
Tennessee:
15.0%
Students in private schools in grades 9 to 12 (high school): 18
Here:
5.7%
Tennessee:
16.2%
Students in private undergraduate colleges: 74
Here:
84.9%
Tennessee:
23.5%
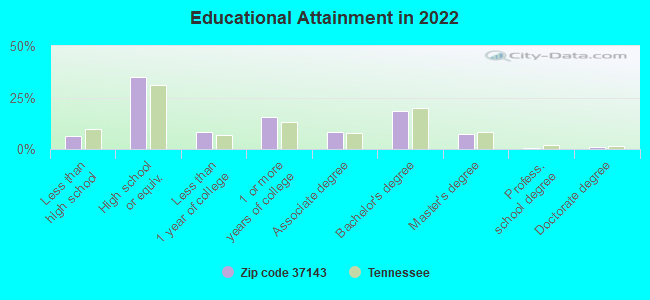
Occupation by median earnings in the past 12 months ($)
95,515Business and financial operations occupations
88,095Computer and mathematical occupations
77,034Management occupations
71,847Health diagnosing and treating practitioners and other technical occupations
59,520Transportation occupations
47,327Healthcare support occupations
Companies with federal contracts located in this zip code:
NANNEY, BERT (535 JUNIPER DR in PEGRAM, TN) : $132,530 in 10 contractsfrom 2004 to 2005
Contracts for Landscaping/Groundskeeping Services by U.S. Army Corps of Engineers - civil program financing only, Army Signed by year:2000: $0; 2001: $0; 2002: $0; 2003: $0; 2004: $96,000; 2005: $36,530; 2006: $0.
Biggest contracts:
$24,000 with U.S. Army Corps of Engineers - civil program financing only for Landscaping/Groundskeeping Services. Signed on 2004-09-24. Completion date: 2004-09-30.
$24,000 with Army for Landscaping/Groundskeeping Services. Signed on 2004-09-24. Completion date: 2004-09-30.
$24,000, same as above.Signed on 2004-08-27. Completion date: 2004-09-30.
$24,000 with U.S. Army Corps of Engineers - civil program financing only for Landscaping/Groundskeeping Services. Signed on 2004-08-27. Completion date: 2004-09-30.
Top industries in this zip code by the number of employees in 2005:
Health Care and Social Assistance: Child Day Care Services (20-49 employees: 1 establishment, 5-9 employees: 1 establishment, 1-4 employees: 1 establishment)
Finance and Insurance: Commercial Banking (10-19: 1, 5-9: 1)
Professional, Scientific, and Technical Services: Landscape Architectural Services (10-19: 1)
Construction: New Single-Family Housing Construction (except Operative Builders) (5-9: 1, 1-4: 1)
Administrative and Support and Waste Management and Remediation Services: Landscaping Services (1-4: 4)
Construction: Site Preparation Contractors (5-9: 1)
Construction: Siding Contractors (5-9: 1)
Wholesale Trade: Other Professional Equipment and Supplies Merchant Wholesalers (5-9: 1)
People in group quarters in 2010:
12 people in workers' group living quarters and job corps centers
People in group quarters in 2000:
28 people in schools, hospitals, or wards for the intellectually disabled
Fatal accident statistics in 2014:
Fatal accident count: 2
Vehicles involved in fatal accidents: 2
Fatal accidents caused by drunken drivers: 1
Fatalities: 2
Persons involved in fatal accidents: 3
Pedestrians involved in fatal accidents: 0
Fatal accident statistics in 2013:
Fatal accident count: 2
Vehicles involved in fatal accidents: 3
Fatal accidents caused by drunken drivers: 1
Fatalities: 2
Persons involved in fatal accidents: 4
Pedestrians involved in fatal accidents: 0
Home Mortgage Disclosure Act Aggregated Statistics For Year 2009 (Based on 4 partial tracts)
A) FHA, FSA/RHS & VA Home Purchase Loans
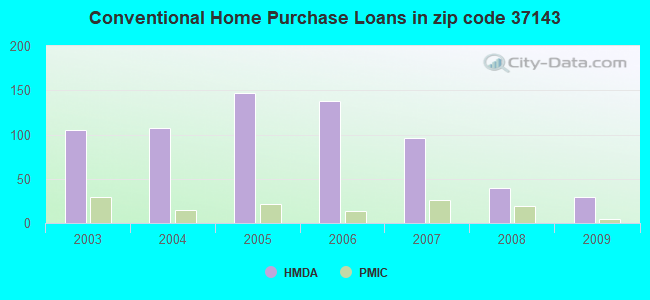
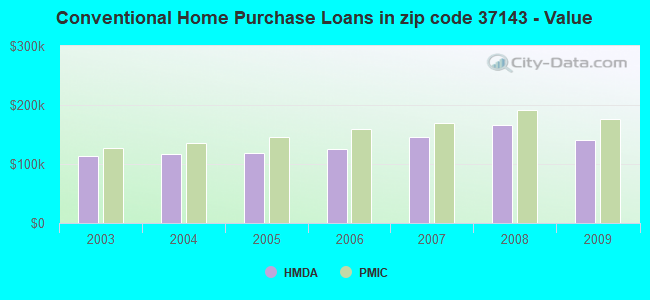
B) Conventional Home Purchase Loans
C) Refinancings
D) Home Improvement Loans
F) Non-occupant Loans on < 5 Family Dwellings (A B C & D)
G) Loans On Manufactured Home Dwelling (A B C & D)
Number
Average Value
Number
Average Value
Number
Average Value
Number
Average Value
Number
Average Value
Number
Average Value
LOANS ORIGINATED
33
$161,501
29
$141,069
172
$161,590
8
$60,360
8
$129,925
9
$85,241
APPLICATIONS APPROVED, NOT ACCEPTED
1
$205,030
2
$127,570
19
$165,446
0
$0
0
$0
2
$61,380
APPLICATIONS DENIED
5
$152,660
9
$124,769
61
$171,662
10
$46,056
5
$116,126
4
$84,925
APPLICATIONS WITHDRAWN
4
$157,812
5
$194,360
46
$164,509
2
$130,095
2
$97,775
3
$102,367
FILES CLOSED FOR INCOMPLETENESS
1
$82,570
1
$69,530
11
$174,254
0
$0
0
$0
1
$52,150
Aggregated Statistics For Year 2008 (Based on 4 partial tracts)
A) FHA, FSA/RHS & VA Home Purchase Loans
B) Conventional Home Purchase Loans
C) Refinancings
D) Home Improvement Loans
F) Non-occupant Loans on < 5 Family Dwellings (A B C & D)
G) Loans On Manufactured Home Dwelling (A B C & D)
Number
Average Value
Number
Average Value
Number
Average Value
Number
Average Value
Number
Average Value
Number
Average Value
LOANS ORIGINATED
28
$159,984
40
$166,118
122
$151,832
18
$64,214
14
$90,273
13
$85,026
APPLICATIONS APPROVED, NOT ACCEPTED
1
$138,200
5
$135,256
12
$113,222
3
$30,640
0
$0
1
$79,000
APPLICATIONS DENIED
5
$172,366
8
$156,290
76
$149,372
14
$87,084
4
$163,915
9
$90,473
APPLICATIONS WITHDRAWN
2
$195,875
6
$168,523
36
$167,405
3
$109,913
3
$158,867
1
$133,160
FILES CLOSED FOR INCOMPLETENESS
0
$0
1
$200,440
6
$155,682
1
$280,290
0
$0
1
$87,240
Aggregated Statistics For Year 2007 (Based on 4 partial tracts)
A) FHA, FSA/RHS & VA Home Purchase Loans
B) Conventional Home Purchase Loans
C) Refinancings
D) Home Improvement Loans
E) Loans on Dwellings For 5+ Families
F) Non-occupant Loans on < 5 Family Dwellings (A B C & D)
G) Loans On Manufactured Home Dwelling (A B C & D)
Number
Average Value
Number
Average Value
Number
Average Value
Number
Average Value
Number
Average Value
Number
Average Value
Number
Average Value
LOANS ORIGINATED
18
$139,075
96
$145,453
114
$149,295
18
$60,761
0
$0
15
$103,024
14
$80,833
APPLICATIONS APPROVED, NOT ACCEPTED
2
$85,280
15
$121,383
24
$135,033
6
$48,092
0
$0
2
$99,845
3
$74,783
APPLICATIONS DENIED
5
$129,010
22
$113,431
77
$160,714
22
$63,977
0
$0
5
$106,978
12
$80,970
APPLICATIONS WITHDRAWN
3
$181,837
16
$116,248
41
$146,964
8
$83,762
1
$98,860
2
$198,540
4
$92,558
FILES CLOSED FOR INCOMPLETENESS
2
$136,615
1
$141,030
14
$135,072
1
$166,220
0
$0
0
$0
1
$63,010
Aggregated Statistics For Year 2006 (Based on 4 partial tracts)
A) FHA, FSA/RHS & VA Home Purchase Loans
B) Conventional Home Purchase Loans
C) Refinancings
D) Home Improvement Loans
F) Non-occupant Loans on < 5 Family Dwellings (A B C & D)
G) Loans On Manufactured Home Dwelling (A B C & D)
Number
Average Value
Number
Average Value
Number
Average Value
Number
Average Value
Number
Average Value
Number
Average Value
LOANS ORIGINATED
22
$133,141
138
$125,623
128
$127,149
23
$61,443
32
$106,381
19
$64,741
APPLICATIONS APPROVED, NOT ACCEPTED
1
$102,660
25
$121,534
23
$132,868
5
$47,630
4
$107,148
4
$86,505
APPLICATIONS DENIED
3
$99,200
51
$109,360
101
$116,485
25
$33,517
15
$85,951
22
$81,644
APPLICATIONS WITHDRAWN
3
$105,400
19
$139,598
72
$137,612
5
$50,844
5
$99,218
3
$104,310
FILES CLOSED FOR INCOMPLETENESS
0
$0
7
$125,647
19
$132,698
3
$62,833
1
$97,840
0
$0
Aggregated Statistics For Year 2005 (Based on 4 partial tracts)
A) FHA, FSA/RHS & VA Home Purchase Loans
B) Conventional Home Purchase Loans
C) Refinancings
D) Home Improvement Loans
F) Non-occupant Loans on < 5 Family Dwellings (A B C & D)
G) Loans On Manufactured Home Dwelling (A B C & D)
Number
Average Value
Number
Average Value
Number
Average Value
Number
Average Value
Number
Average Value
Number
Average Value
LOANS ORIGINATED
17
$150,923
147
$117,826
162
$122,071
16
$45,418
24
$87,839
21
$65,155
APPLICATIONS APPROVED, NOT ACCEPTED
1
$218,570
19
$109,751
34
$102,094
5
$43,850
2
$74,670
6
$91,912
APPLICATIONS DENIED
3
$133,807
32
$98,419
137
$124,617
15
$47,299
2
$103,480
18
$74,851
APPLICATIONS WITHDRAWN
1
$103,750
18
$136,998
109
$136,944
7
$113,271
4
$86,265
5
$67,300
FILES CLOSED FOR INCOMPLETENESS
0
$0
8
$114,108
13
$131,868
1
$27,160
1
$112,990
1
$21,730
Aggregated Statistics For Year 2004 (Based on 4 partial tracts)
A) FHA, FSA/RHS & VA Home Purchase Loans
B) Conventional Home Purchase Loans
C) Refinancings
D) Home Improvement Loans
F) Non-occupant Loans on < 5 Family Dwellings (A B C & D)
G) Loans On Manufactured Home Dwelling (A B C & D)
Number
Average Value
Number
Average Value
Number
Average Value
Number
Average Value
Number
Average Value
Number
Average Value
LOANS ORIGINATED
21
$120,164
107
$117,475
171
$119,227
15
$24,595
19
$86,177
17
$74,552
APPLICATIONS APPROVED, NOT ACCEPTED
1
$41,830
14
$87,809
37
$123,092
4
$24,242
1
$26,070
8
$70,898
APPLICATIONS DENIED
5
$120,950
23
$86,979
123
$114,568
16
$34,046
4
$82,465
19
$64,515
APPLICATIONS WITHDRAWN
2
$137,975
11
$103,572
72
$111,747
6
$37,268
1
$104,440
6
$95,377
FILES CLOSED FOR INCOMPLETENESS
2
$87,725
5
$68,222
7
$136,763
0
$0
0
$0
0
$0
Aggregated Statistics For Year 2003 (Based on 4 partial tracts)
A) FHA, FSA/RHS & VA Home Purchase Loans
B) Conventional Home Purchase Loans
C) Refinancings
D) Home Improvement Loans
F) Non-occupant Loans on < 5 Family Dwellings (A B C & D)
Detailed PMIC statistics for the following Tracts:0701.02
, 0704.00
2002 - 2018 National Fire Incident Reporting System (NFIRS) incidents
Based on the data from the years 2002 - 2018 the average number of fires per year is 18. The highest number of reported fires - 26 took place in 2012, and the least - 8 in 2010. The data has an increasing trend.
When looking into fire subcategories, the most reports belonged to: Outside Fires (41.9%), and Structure Fires (37.2%).
Fire incident types reported to NFIRS in Zip Code 37143
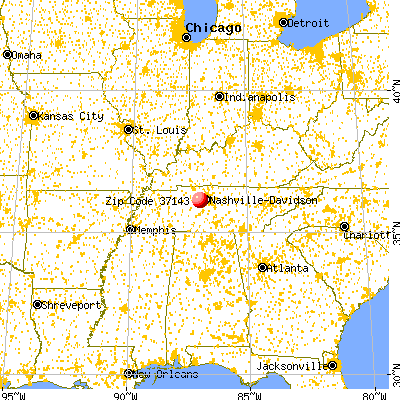


 Nearest zip codes: 37082, 37221, 37209, 37218, 37015, 37205.


 Based on the data from the years 2002 - 2018 the average number of fires per year is 18. The highest number of reported fires - 26 took place in 2012, and the least - 8 in 2010. The data has an increasing trend.
 When looking into fire subcategories, the most reports belonged to: Outside Fires (41.9%), and Structure Fires (37.2%).