Estimated zip code population in 2022: 3,712 Zip code population in 2010: 4,622 Zip code population in 2000: 5,126
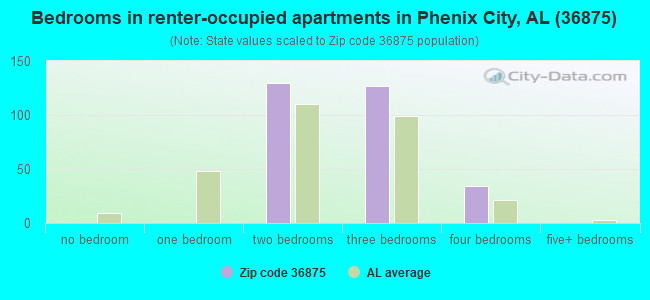
Houses and condos: 1,695 Renter-occupied apartments: 289
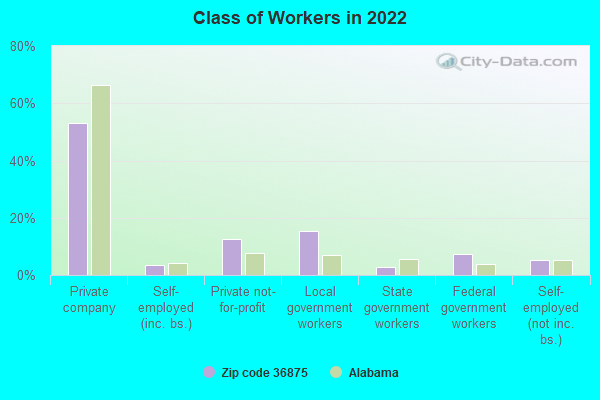
% of renters here:
19%
State:
30%
March 2022 cost of living index in zip code 36875: 81.9 (low, U.S. average is 100)
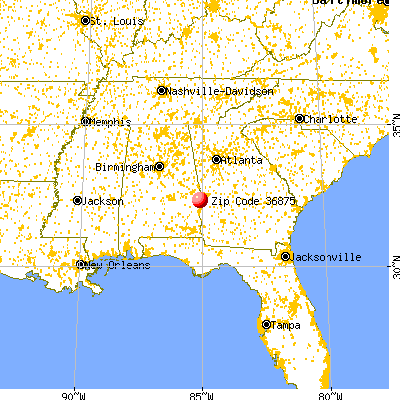
Land area: 140.2 sq. mi. Water area: 0.6 sq. mi.
Population density: 26 people per square mile
(very low).
OSM Map
General Map
Google Map
MSN Map
OSM Map
General Map
Google Map
MSN Map
OSM Map
General Map
Google Map
MSN Map
OSM Map
General Map
Google Map
MSN Map
Please wait while loading the map...
Real estate property taxes paid for housing units in 2022:
This zip code:
0.2% ($475)
Alabama:
0.4% ($718)
Median real estate property taxes paid for housing units with mortgages in 2022: $585 (0.2%) Median real estate property taxes paid for housing units with no mortgage in 2022: $348 (0.2%)
Business Search- 14 Million verified businesses
Males: 1,811
(48.8%)
Females: 1,901
(51.2%)
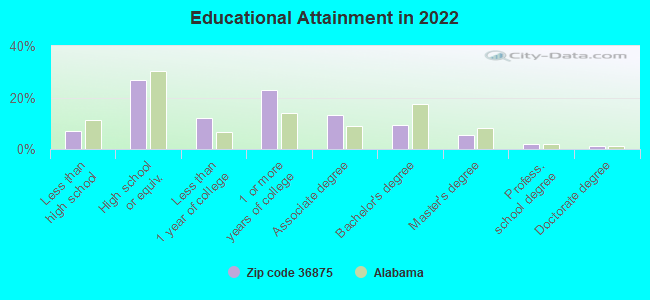
For population 25 years and over in 36875:
High school or higher: 92.1%
Bachelor's degree or higher: 17.9%
Graduate or professional degree: 8.6%
Unemployed: 3.3%
Mean travel time to work (commute): 29.5 minutes
For population 15 years and over in 36875:
Never married: 25.8%
Now married: 54.7%
Separated: 0.6%
Widowed: 8.3%
Divorced: 10.6%
Zip code 36875 compared to state average:
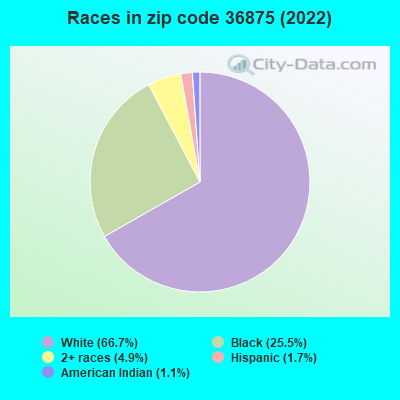
Hispanic race population percentage below state average.
Median age significantly above state average.
Foreign-born population percentage below state average.
Renting percentage below state average.
Length of stay since moving in significantly above state average.
Percentage of population with a bachelor's degree or higher below state average.
Averages for the 2020 tax year for zip code 36875, filed in 2021:
Average Adjusted Gross Income (AGI) in 2020: $50,807 (Individual Income Tax Returns)
Here:
$50,807
State:
$63,984
Salary/wage: $43,538 (reported on 81.1% of returns)
Here:
$43,538
State:
$52,834
(% of AGI for various income ranges: 1227.6% for AGIs below $25k, 3758.4% for AGIs $25k-50k, 6348.6% for AGIs $50k-75k, 9454.5% for AGIs $75k-100k, 17703.0% for AGIs $100k-200k)
Taxable interest for individuals: $1,017 (reported on 17.9% of returns)
This zip code:
$1,017
Alabama:
$1,615
(% of AGI for various income ranges: 5.3% for AGIs below $25k, 10.4% for AGIs $25k-50k, 17.6% for AGIs $50k-75k, 51.8% for AGIs $75k-100k, 82.0% for AGIs $100k-200k)
Ordinary dividends: $3,200 (reported on 10.7% of returns)
Here:
$3,200
State:
$7,660
(% of AGI for various income ranges: 13.5% for AGIs below $25k, 18.0% for AGIs $25k-50k, 43.8% for AGIs $50k-75k, 50.0% for AGIs $75k-100k, 370.0% for AGIs $100k-200k)
Net capital gain/loss in AGI: +$7,527 (reported on 7.7% of returns)
Here:
+$7,527
State:
+$23,528
(% of AGI for various income ranges: 6.9% for AGIs below $25k, 7.8% for AGIs $25k-50k, 65.7% for AGIs $50k-75k, 918.0% for AGIs $100k-200k)
Profit/loss from business: +$4,528 (reported on 19.9% of returns)
Here:
+$4,528
State:
+$9,534
(% of AGI for various income ranges: 144.0% for AGIs below $25k, 46.4% for AGIs $25k-50k, 29.5% for AGIs $50k-75k, 11.8% for AGIs $75k-100k, 690.0% for AGIs $100k-200k)
Taxable individual retirement arrangement distribution: $15,620 (reported on 5.1% of returns)
36875:
$15,620
Alabama:
$19,004
(% of AGI for various income ranges: 79.1% for AGIs below $25k, 235.7% for AGIs $50k-75k, 632.0% for AGIs $100k-200k)
Total itemized deductions: $25,133 (reported on 4.6% of returns)
Here:
$25,133
State:
$37,338
(% of AGI for various income ranges: 86.0% for AGIs below $25k, 347.6% for AGIs $50k-75k, 1059.0% for AGIs $100k-200k)
Charity contributions: $11,238 (reported on 4.1% of returns)
Here:
$11,238
State:
$18,005
(% of AGI for various income ranges: 167.1% for AGIs $50k-75k, 548.0% for AGIs $100k-200k)
Taxes paid: $4,911 (reported on 4.6% of returns)
36875:
$4,911
State:
$6,484
(% of AGI for various income ranges: 12.7% for AGIs below $25k, 65.2% for AGIs $50k-75k, 235.0% for AGIs $100k-200k)
Earned income credit: $2,365 (reported on 25.0% of returns)
Here:
$2,365
State:
$2,628
(% of AGI for various income ranges: 136.0% for AGIs below $25k, 91.3% for AGIs $25k-50k)
Percentage of individuals using paid preparers for their 2020 taxes: 93.4%
Here:
93%
State:
93%
(% for various income ranges: 93.2% for AGIs below $25k, 93.0% for AGIs $25k-50k, 93.1% for AGIs $50k-75k, 93.8% for AGIs $75k-100k, 94.4% for AGIs $100k-200k, 100.0% for AGIs over 200k)
Averages for the 2012 tax year for zip code 36875, filed in 2013:
Average Adjusted Gross Income (AGI) in 2012: $38,068 (Individual Income Tax Returns)
Here:
$38,068
State:
$52,001
Salary/wage: $35,401 (reported on 88.3% of returns)
Here:
$35,401
State:
$43,822
(% of AGI for various income ranges: 85.0% for AGIs below $25k, 92.4% for AGIs $25k-50k, 82.1% for AGIs $50k-75k, 80.8% for AGIs $75k-100k, 72.2% for AGIs $100k-200k, 45.4% for AGIs over 200k)
Taxable interest for individuals: $1,842 (reported on 12.8% of returns)
This zip code:
$1,842
Alabama:
$1,592
(% of AGI for various income ranges: 0.4% for AGIs below $25k, 0.3% for AGIs $25k-50k, 0.1% for AGIs $50k-75k, 0.2% for AGIs $75k-100k, 3.3% for AGIs $100k-200k)
Ordinary dividends: $1,809 (reported on 8.6% of returns)
Here:
$1,809
State:
$5,697
(% of AGI for various income ranges: 0.2% for AGIs below $25k, 0.2% for AGIs $25k-50k, 0.4% for AGIs $50k-75k, 0.4% for AGIs $75k-100k, 1.5% for AGIs $100k-200k)
Net capital gain/loss in AGI: +$9,800 (reported on 4.7% of returns)
Here:
+$9,800
State:
+$13,286
(% of AGI for various income ranges: 9.8% for AGIs $100k-200k)
Profit/loss from business: +$2,524 (reported on 12.8% of returns)
Here:
+$2,524
State:
+$9,151
(% of AGI for various income ranges: 3.2% for AGIs below $25k, 0.8% for AGIs $50k-75k, 2.0% for AGIs $100k-200k)
Taxable individual retirement arrangement distribution: $11,650 (reported on 3.9% of returns)
36875:
$11,650
Alabama:
$14,992
(% of AGI for various income ranges: 1.0% for AGIs below $25k, 0.6% for AGIs $25k-50k, 1.7% for AGIs $50k-75k, 4.4% for AGIs $75k-100k)
Total itemized deductions: $17,974 (33% of AGI, reported on 37.4% of returns)
Here:
$17,974
State:
$21,388
Here:
33.5% of AGI
State:
20.1% of AGI
(% of AGI for various income ranges: 6.2% for AGIs below $25k, 27.7% for AGIs $25k-50k, 14.2% for AGIs $50k-75k, 12.8% for AGIs $75k-100k, 21.6% for AGIs $100k-200k)
Charity contributions: $4,830 (reported on 15.6% of returns)
Here:
$4,830
State:
$5,925
(% of AGI for various income ranges: 0.8% for AGIs below $25k, 1.0% for AGIs $25k-50k, 2.5% for AGIs $50k-75k, 2.6% for AGIs $75k-100k, 6.2% for AGIs $100k-200k)
Taxes paid: $3,878 (reported on 17.9% of returns)
36875:
$3,878
State:
$5,272
(% of AGI for various income ranges: 0.8% for AGIs below $25k, 0.7% for AGIs $25k-50k, 2.5% for AGIs $50k-75k, 3.0% for AGIs $75k-100k, 5.6% for AGIs $100k-200k)
Earned income credit: $2,538 (reported on 23.3% of returns)
Here:
$2,538
State:
$2,646
(% of AGI for various income ranges: 8.3% for AGIs below $25k, 0.9% for AGIs $25k-50k)
Percentage of individuals using paid preparers for their 2012 taxes: 75.1%
Here:
75%
State:
60%
(% for various income ranges: 68.0% for AGIs below $25k, 81.6% for AGIs $25k-50k, 69.2% for AGIs $50k-75k, 78.6% for AGIs $75k-100k, 77.8% for AGIs $100k-200k, 150.0% for AGIs over 200k)
Averages for the 2004 tax year for zip code 36875, filed in 2005:
Average Adjusted Gross Income (AGI) in 2004: $32,784 (Individual Income Tax Returns)
Here:
$32,784
State:
$42,302
Salary/wage: $30,969 (reported on 86.5% of returns)
Here:
$30,969
State:
$36,626
(% of AGI for various income ranges: 115.8% for AGIs below $10k, 85.3% for AGIs $10k-25k, 84.1% for AGIs $25k-50k, 86.8% for AGIs $50k-75k, 87.8% for AGIs $75k-100k, 56.2% for AGIs over 100k)
Taxable interest for individuals: $1,019 (reported on 22.6% of returns)
This zip code:
$1,019
Alabama:
$1,827
(% of AGI for various income ranges: 1.7% for AGIs below $10k, 0.5% for AGIs $10k-25k, 0.9% for AGIs $25k-50k, 0.3% for AGIs $50k-75k, 0.4% for AGIs $75k-100k, 1.2% for AGIs over 100k)
Taxable dividends: $1,046 (reported on 13.6% of returns)
Here:
$1,046
State:
$4,206
(% of AGI for various income ranges: 2.0% for AGIs below $10k, 0.2% for AGIs $10k-25k, 0.4% for AGIs $25k-50k, 0.3% for AGIs $50k-75k, 0.2% for AGIs $75k-100k, 0.7% for AGIs over 100k)
Net capital gain/loss: +$4,293 (reported on 8.7% of returns)
Here:
+$4,293
State:
+$13,031
(% of AGI for various income ranges: -1.0% for AGIs below $10k, 0.1% for AGIs $10k-25k, 1.0% for AGIs $25k-50k, 0.1% for AGIs $50k-75k, 1.6% for AGIs $75k-100k, 4.0% for AGIs over 100k)
Profit/loss from business: +$2,036 (reported on 14.7% of returns)
Here:
+$2,036
State:
+$8,302
(% of AGI for various income ranges: 0.4% for AGIs below $10k, 1.4% for AGIs $10k-25k, 0.5% for AGIs $25k-50k, -0.2% for AGIs $50k-75k, 3.5% for AGIs over 100k)
IRA payment deduction: $2,538 (reported on 0.7% of returns)
36875:
$2,538
Alabama:
$3,006
Total itemized deductions: $15,162 (25% of AGI, reported on 24.6% of returns)
Here:
$15,162
State:
$17,623
Here:
25.4% of AGI
State:
20.8% of AGI
(% of AGI for various income ranges: 8.3% for AGIs below $10k, 8.4% for AGIs $10k-25k, 10.1% for AGIs $25k-50k, 13.4% for AGIs $50k-75k, 14.9% for AGIs $75k-100k, 11.4% for AGIs over 100k)
Charity contributions deductions: $3,395 (6% of AGI, reported on 21.9% of returns)
Here:
$3,395
State:
$4,768
Here:
5.5% of AGI
State:
5.4% of AGI
(% of AGI for various income ranges: 0.8% for AGIs below $10k, 1.6% for AGIs $10k-25k, 2.0% for AGIs $25k-50k, 2.4% for AGIs $50k-75k, 2.8% for AGIs $75k-100k, 3.1% for AGIs over 100k)
Total tax: $4,134 (reported on 65.4% of returns)
36875:
$4,134
State:
$6,905
(% of AGI for various income ranges: 3.5% for AGIs below $10k, 2.8% for AGIs $10k-25k, 5.6% for AGIs $25k-50k, 8.0% for AGIs $50k-75k, 9.8% for AGIs $75k-100k, 18.5% for AGIs over 100k)
Earned income credit: $1,949 (reported on 30.7% of returns)
Here:
$1,949
State:
$2,048
Percentage of individuals using paid preparers for their 2004 taxes: 71.7%
Here:
72%
State:
65%
(% for various income ranges: 65.2% for AGIs below $10k, 73.6% for AGIs $10k-25k, 73.3% for AGIs $25k-50k, 73.9% for AGIs $50k-75k, 65.6% for AGIs $75k-100k, 82.3% for AGIs over 100k)
Household received Food Stamps/SNAP in the past 12 months: 164 Household did not receive Food Stamps/SNAP in the past 12 months: 1,326
Women who had a birth in the past 12 months: 25 (7 now married, 15 unmarried) Women who did not have a birth in the past 12 months: 708 (243 now married, 465 unmarried)
Housing units in zip code 36875 with a mortgage: 596 (128 second mortgage, 28 home equity loan, 30 both second mortgage and home equity loan) Houses without a mortgage: 28
Median monthly owner costs for units with a mortgage: $1,318 Median monthly owner costs for units without a mortgage: $402
Residents with income below the poverty level in 2022:
This zip code:
10.7%
Whole state:
16.2%
Residents with income below 50% of the poverty level in 2022:
This zip code:
9.9%
Whole state:
8.6%
Median number of rooms in houses and condos:
Here:
6.7
State:
6.5
Median number of rooms in apartments:
Here:
7.6
State:
4.7
Notable locations in this zip code not listed on our city pages
Notable locations in zip code 36875: Uchee Creek Volunteer Fire Department (A), Seale Volunteer Fire Department (B). Display/hide their locations on the map
Churches in zip code 36875 include: Mount Olive Church (A), Providence Baptist Church (B), Ross Chapel (C), Saint Peters Church (D), Uchee Chapel (E), Avalon Church (F), Colbert Church (G), Macedonia Church (H), Ministries of Faith Church (I). Display/hide their locations on the map
Cemeteries: Porter Cemetery (1), Phillips-Barnett Cemetery (2), Key Cemetery (3), Bass Cemetery (4), Williams Cemetery (5), Boykin Cemetery (6), Jowers Cemetery (7). Display/hide their locations on the map
Reservoirs: Wheeless Pond (A), Smiths Pond (B), Parrs Pond (C), Parkmans Pond (D), Gullatts Lake (E), Monte Pond (F), Mullin Lake (G), Skinners Lake (H). Display/hide their locations on the map
Streams, rivers, and creeks: Snake Creek (A), Island Creek (B), Little Uchee Creek (C), Padgett Branch (D), Porter Branch (E), Sevenmile Creek (F), Maringo Creek (G), Lewis Branch (H), Horselot Branch (I). Display/hide their locations on the map
Size of family households: 439 2-persons, 241 3-persons, 180 4-persons, 88 5-persons
Size of nonfamily households: 515 1-person, 4 2-persons, 33 4-persons
449 married couples with children.
130 single-parent households (69 men, 61 women).
97.7% of residents of 36875 zip code speak English at home.
1.4% of residents speak Spanish at home (27% very well, 18% well, 55% not well).
0.5% of residents speak other Indo-European language at home (18% very well, 82% well).
0.1% of residents speak Asian or Pacific Island language at home (67% very well, 33% well).
0.1% of residents speak other language at home (100% very well).
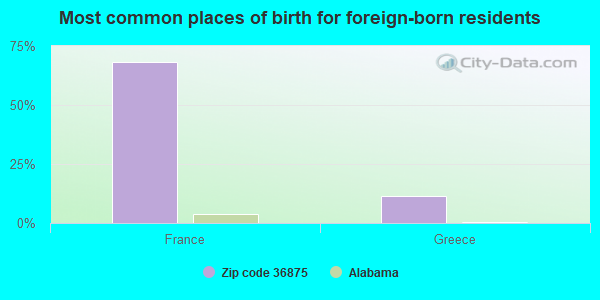
Foreign born population: 72 (2.0%) (88.1% of them are naturalized citizens)
This zip code:
2.0%
Whole state:
3.8%
68%France
12%Greece
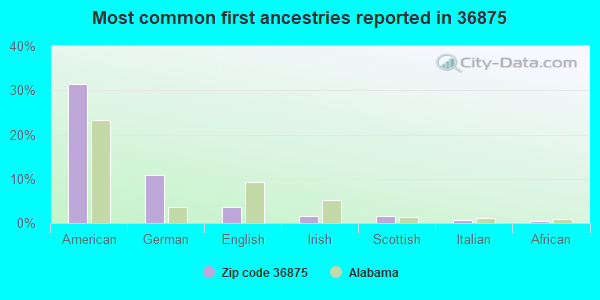
31%American
11%German
4%English
2%Irish
2%Scottish
1%Italian
0%African
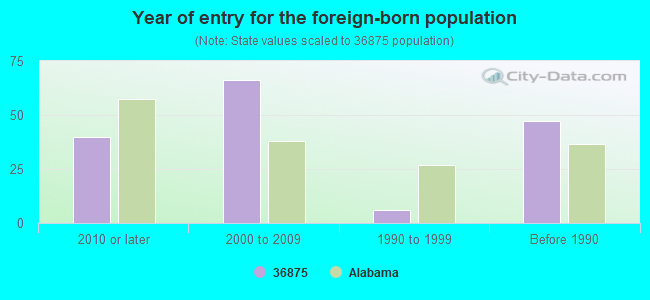
Year of entry for the foreign-born population
402010 or later
662000 to 2009
61990 to 1999
47Before 1990
Major facilities with environmental interests located in this zip code:
ALTERNATIVE LEARNING CENTER (91 POORHOUSE RD in SEALE, AL)
(National Center for Education Statistics) - STATE ID-0005 Organizations: RUSSELL COUNTY (SCHOOL DISTRICT)
OLIVER ELEMENTARY SCHOOL (77 LONGVIEW STREET in SEALE, AL)
(National Center for Education Statistics) - STATE ID-0050 Organizations: RUSSELL COUNTY (SCHOOL DISTRICT)
RUSSELL AREA VOCATIONAL SCHOOL (4699 US HIGHWAY 431 S in SEALE, AL)
(National Center for Education Statistics) - STATE ID-6000 Organizations: RUSSELL COUNTY (SCHOOL DISTRICT)
RUSSELL COUNTY HIGH SCHOOL (4699 HIGHWAY 431 S in SEALE, AL)
(National Center for Education Statistics) - STATE ID-0065
RUSSELL COUNTY MIDDLE SCHOOL (4716 US HWY 431 S in SEALE, AL)
(National Center for Education Statistics) - STATE ID-0075
MOUNT OLIVE ELEMENTARY SCHOOL (454 STATE HIGHWAY 165 in SEALE, AL)
(National Center for Education Statistics) - STATE ID-0040 Organizations: RUSSELL COUNTY (SCHOOL DISTRICT)
MULTI-HANDICAPPED CENTER (91 POORHOUSE RD in SEALE, AL)
(National Center for Education Statistics) - STATE ID-0045 Organizations: RUSSELL COUNTY (SCHOOL DISTRICT)
OLIVER ELEMENTARY SCH LAGOON (RUSSELL COUNTY BD OF EDUCATION in SEALE, AL)
National Pollutant Discharge Elimination System NON-MAJOR (Tracking pollutant discharge elimination systems) - permit Business SIC classification: ELEMENTARY AND SECONDARY SCHOOLS Alternative names: RUSSELL CO BOE JR HIGH SCHOOL, RUSSELL COUNTY JR HIGH SCHOOL
RUSSELL CO HIGH SCHOOL LAGOON (RUSSELL COUNTY BD OF EDUCATION in SEALE, AL)
National Pollutant Discharge Elimination System NON-MAJOR (Tracking pollutant discharge elimination systems) - permit Business SIC classification: ELEMENTARY AND SECONDARY SCHOOLS Alternative names: RUSSELL COUNTY BOARD OF ED, RUSSELL CNTY BOE HIGH SCHOOL
APAC SE SEALE PLANT (APAC SOUTHEAST INC in SEALE, AL)
National Pollutant Discharge Elimination System NON-MAJOR (Tracking pollutant discharge elimination systems) - permit Business SIC classification: ASPHALT PAVING MIXTURES AND BLOCKS Alternative names: APAC SE INC SEALE PLANT
ROAD INTERSECTION (169 SOUTH (.25 MILES FROM 431) in SEALE, AL)
(Resource Conservation and Recovery Act (tracking hazardous waste)) Organizations: NO ONE (CONTACT/OWNER)
RUSSELL COUNTY MIDDLE SCHOOL (RUSSELL COUNTY BOARD OF ED in SEALE, AL)
National Pollutant Discharge Elimination System NON-MAJOR (Tracking pollutant discharge elimination systems) - permit Business SIC classification: ELEMENTARY AND SECONDARY SCHOOLS Organizations: RUSSELL COUNTY BOARD OF ED (CONTACT/OWNER)
Alternative names: RUSSELL CO BOE MIDDLE SCHOOL, RUSSELL COUNTY BOARD OF ED
ALDOT DIVISION 4 DISTRICT 6 (56 SILVER RUN DRIVE in SEALE, AL)
Conditionally Exempt Small Quantity Generators, less than 100 kg/month of hazardous waste (Resource Conservation and Recovery Act (tracking hazardous waste))
Housing units lacking complete plumbing facilities: 1.1% Housing units lacking complete kitchen facilities: 3.2%
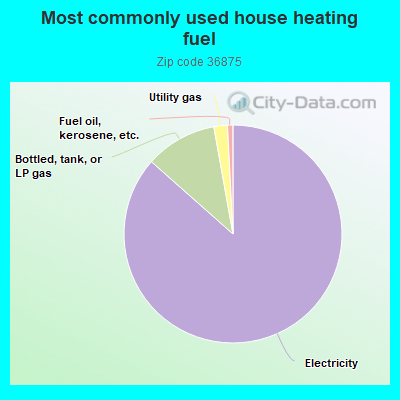
86.2%Electricity
10.6%Bottled, tank, or LP gas
2.0%Utility gas
0.8%Fuel oil, kerosene, etc.
Population in 1990: 1,949. Population change in the 1990s: +3,177 (+163.0%).
Place of birth for U.S.-born residents:
This state: 1,207
Northeast: 70
Midwest: 119
South: 2,040
West: 187
69% of the 36875 zip code residents lived in the same house 5 years ago. Out of people who lived in different houses, 51% lived in this county. Out of people who lived in different counties, 50% lived in Alabama.
97% of the 36875 zip code residents lived in the same house 1 year ago. Out of people who lived in different houses, 61% moved from this county. Out of people who lived in different houses, 33% moved from different county within same state. Out of people who lived in different houses, 12% moved from different state.
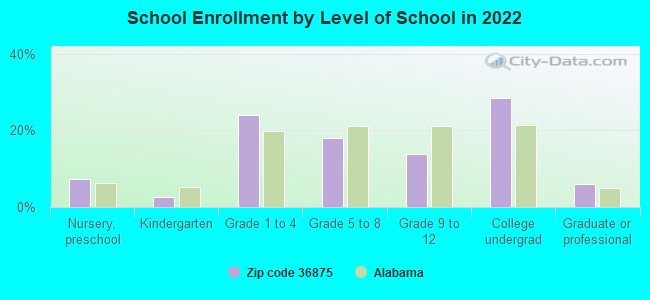
Private vs. public school enrollment:
Students in private schools in grades 1 to 8 (elementary and middle school):
Here:
0.0%
Alabama:
14.7%
Students in private schools in grades 9 to 12 (high school):
Here:
0.0%
Alabama:
16.3%
Students in private undergraduate colleges: 18
Here:
7.0%
Alabama:
14.6%
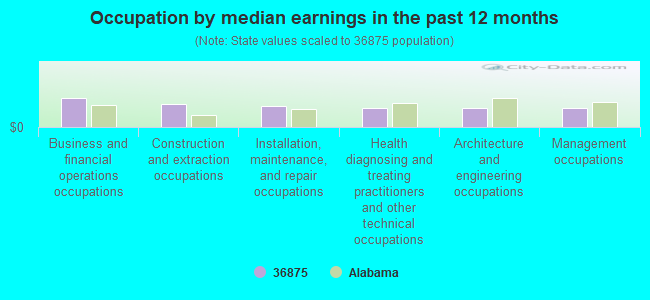
Occupation by median earnings in the past 12 months ($)
76,796Business and financial operations occupations
60,734Construction and extraction occupations
55,215Installation, maintenance, and repair occupations
50,728Health diagnosing and treating practitioners and other technical occupations
49,164Architecture and engineering occupations
49,162Management occupations
Companies with federal contracts located in this zip code:
J&J TECHNOLOGY SERVICE (61 RIDGE ROAD in SEALE, AL; small business) : $42,759 in 3 contractsin 2002
$23,938 with Army for Other Quality Control, Testing and Inspection Services -- Alarm, Signal, and Security Detection Systems. Taking place in GA. Signed on 2002-04-23. Completion date: 2002-05-17.
$10,300 with Army for Maintenance, Repair or Alteration of Real Property -- Family Housing Facilities. Taking place in GA. Signed on 2002-03-01. Completion date: 2002-03-15.
$8,521 with Army for Other Quality Control, Testing and Inspection Services -- Alarm, Signal, and Security Detection Systems. Taking place in GA. Signed on 2002-06-21. Completion date: 2002-05-17.
SHARON FREEMAN (#30 ISLAND CREEK DRIVE in SEALE, AL; small business)
$6,976 with U.S. Army Corps of Engineers - civil program financing only for Recreation Site Maintenance Services (non-construction). Taking place in GA. Signed on 2001-02-21. Completion date: 2001-09-29.
Top industries in this zip code by the number of employees in 2005:
Construction: Land Subdivision (10-19 employees: 1 establishment)
Construction: Masonry Contractors (5-9: 1)
Construction: Highway, Street, and Bridge Construction (5-9: 1)
Construction: New Housing Operative Builders (5-9: 1)
Construction: Plumbing, Heating, and Air-Conditioning Contractors (1-4: 3)
Fatal accident statistics in 2014:
Fatal accident count: 2
Vehicles involved in fatal accidents: 3
Fatal accidents caused by drunken drivers: 0
Fatalities: 2
Persons involved in fatal accidents: 4
Pedestrians involved in fatal accidents: 0
Fatal accident statistics in 2013:
Fatal accident count: 3
Vehicles involved in fatal accidents: 4
Fatal accidents caused by drunken drivers: 0
Fatalities: 5
Persons involved in fatal accidents: 10
Pedestrians involved in fatal accidents: 0
Home Mortgage Disclosure Act Aggregated Statistics For Year 2009 (Based on 3 partial tracts)
A) FHA, FSA/RHS & VA Home Purchase Loans
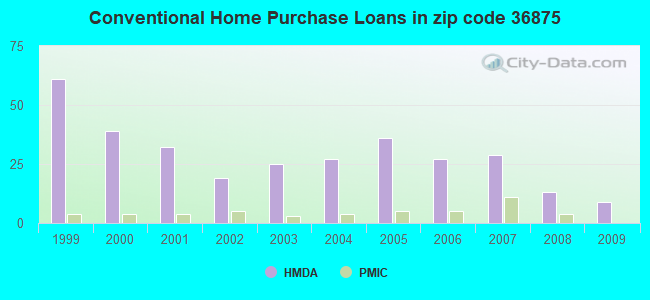
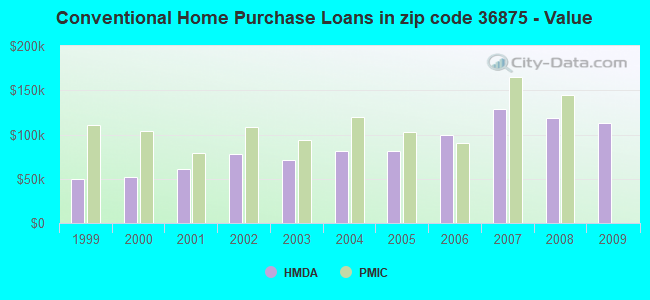
B) Conventional Home Purchase Loans
C) Refinancings
D) Home Improvement Loans
F) Non-occupant Loans on < 5 Family Dwellings (A B C & D)
G) Loans On Manufactured Home Dwelling (A B C & D)
Number
Average Value
Number
Average Value
Number
Average Value
Number
Average Value
Number
Average Value
Number
Average Value
LOANS ORIGINATED
56
$185,376
9
$112,481
60
$152,888
7
$22,836
4
$108,252
10
$59,225
APPLICATIONS APPROVED, NOT ACCEPTED
1
$280,880
1
$68,700
5
$156,450
1
$19,170
0
$0
1
$71,130
APPLICATIONS DENIED
6
$149,350
5
$78,950
35
$133,057
9
$37,172
2
$85,060
8
$68,251
APPLICATIONS WITHDRAWN
5
$135,542
0
$0
19
$165,859
1
$28,810
0
$0
1
$22,870
FILES CLOSED FOR INCOMPLETENESS
0
$0
0
$0
4
$157,000
0
$0
0
$0
0
$0
Aggregated Statistics For Year 2008 (Based on 3 partial tracts)
A) FHA, FSA/RHS & VA Home Purchase Loans
B) Conventional Home Purchase Loans
C) Refinancings
D) Home Improvement Loans
F) Non-occupant Loans on < 5 Family Dwellings (A B C & D)
G) Loans On Manufactured Home Dwelling (A B C & D)
Number
Average Value
Number
Average Value
Number
Average Value
Number
Average Value
Number
Average Value
Number
Average Value
LOANS ORIGINATED
62
$178,336
13
$118,195
40
$155,480
10
$31,723
9
$170,284
14
$83,790
APPLICATIONS APPROVED, NOT ACCEPTED
5
$131,484
3
$81,690
11
$124,147
3
$9,147
1
$37,820
5
$61,956
APPLICATIONS DENIED
5
$113,670
6
$80,697
44
$129,920
20
$49,230
4
$66,295
13
$70,097
APPLICATIONS WITHDRAWN
3
$164,603
2
$173,345
18
$153,615
1
$60,490
1
$132,710
2
$95,825
FILES CLOSED FOR INCOMPLETENESS
0
$0
0
$0
5
$212,208
1
$35,130
0
$0
0
$0
Aggregated Statistics For Year 2007 (Based on 3 partial tracts)
A) FHA, FSA/RHS & VA Home Purchase Loans
B) Conventional Home Purchase Loans
C) Refinancings
D) Home Improvement Loans
F) Non-occupant Loans on < 5 Family Dwellings (A B C & D)
G) Loans On Manufactured Home Dwelling (A B C & D)
Number
Average Value
Number
Average Value
Number
Average Value
Number
Average Value
Number
Average Value
Number
Average Value
LOANS ORIGINATED
38
$166,433
29
$128,681
40
$131,137
13
$33,476
6
$110,868
13
$69,052
APPLICATIONS APPROVED, NOT ACCEPTED
1
$157,610
4
$94,445
8
$125,385
2
$37,560
0
$0
4
$61,475
APPLICATIONS DENIED
3
$156,533
12
$101,201
48
$114,122
20
$41,782
4
$104,248
16
$67,149
APPLICATIONS WITHDRAWN
2
$119,555
6
$103,613
16
$144,458
5
$62,070
1
$29,760
3
$33,867
FILES CLOSED FOR INCOMPLETENESS
1
$69,700
2
$141,675
4
$160,365
0
$0
0
$0
0
$0
Aggregated Statistics For Year 2006 (Based on 3 partial tracts)
A) FHA, FSA/RHS & VA Home Purchase Loans
B) Conventional Home Purchase Loans
C) Refinancings
D) Home Improvement Loans
F) Non-occupant Loans on < 5 Family Dwellings (A B C & D)
G) Loans On Manufactured Home Dwelling (A B C & D)
Number
Average Value
Number
Average Value
Number
Average Value
Number
Average Value
Number
Average Value
Number
Average Value
LOANS ORIGINATED
27
$127,497
27
$99,195
53
$118,598
20
$29,477
8
$89,170
19
$72,143
APPLICATIONS APPROVED, NOT ACCEPTED
1
$146,730
7
$93,041
14
$84,374
3
$52,350
1
$211,240
5
$53,050
APPLICATIONS DENIED
4
$87,135
18
$81,836
50
$110,234
22
$39,057
5
$87,818
23
$61,261
APPLICATIONS WITHDRAWN
3
$143,877
4
$142,805
23
$108,280
2
$49,905
1
$28,480
3
$78,457
FILES CLOSED FOR INCOMPLETENESS
0
$0
1
$71,400
6
$101,053
1
$36,220
0
$0
0
$0
Aggregated Statistics For Year 2005 (Based on 3 partial tracts)
A) FHA, FSA/RHS & VA Home Purchase Loans
B) Conventional Home Purchase Loans
C) Refinancings
D) Home Improvement Loans
F) Non-occupant Loans on < 5 Family Dwellings (A B C & D)
G) Loans On Manufactured Home Dwelling (A B C & D)
Number
Average Value
Number
Average Value
Number
Average Value
Number
Average Value
Number
Average Value
Number
Average Value
LOANS ORIGINATED
28
$126,417
36
$81,382
54
$106,677
14
$25,556
8
$57,185
20
$64,950
APPLICATIONS APPROVED, NOT ACCEPTED
2
$113,545
5
$62,718
18
$109,008
2
$24,165
1
$46,750
6
$60,695
APPLICATIONS DENIED
4
$96,102
19
$74,410
62
$101,115
20
$28,686
8
$54,839
24
$50,180
APPLICATIONS WITHDRAWN
3
$97,953
6
$81,228
32
$112,104
5
$50,576
1
$108,740
5
$64,154
FILES CLOSED FOR INCOMPLETENESS
0
$0
1
$132,390
5
$109,138
1
$47,890
1
$77,930
0
$0
Aggregated Statistics For Year 2004 (Based on 3 partial tracts)
A) FHA, FSA/RHS & VA Home Purchase Loans
B) Conventional Home Purchase Loans
C) Refinancings
D) Home Improvement Loans
F) Non-occupant Loans on < 5 Family Dwellings (A B C & D)
G) Loans On Manufactured Home Dwelling (A B C & D)
Number
Average Value
Number
Average Value
Number
Average Value
Number
Average Value
Number
Average Value
Number
Average Value
LOANS ORIGINATED
17
$111,201
27
$80,959
50
$100,867
15
$28,672
13
$54,760
22
$51,067
APPLICATIONS APPROVED, NOT ACCEPTED
0
$0
9
$70,579
24
$82,525
1
$25,960
0
$0
6
$46,485
APPLICATIONS DENIED
2
$89,930
14
$58,916
57
$88,129
13
$29,728
3
$69,260
19
$52,236
APPLICATIONS WITHDRAWN
3
$101,093
4
$90,650
20
$103,808
5
$61,664
1
$47,500
3
$65,447
FILES CLOSED FOR INCOMPLETENESS
1
$79,880
1
$61,110
12
$120,543
1
$13,720
0
$0
0
$0
Aggregated Statistics For Year 2003 (Based on 3 partial tracts)
A) FHA, FSA/RHS & VA Home Purchase Loans
B) Conventional Home Purchase Loans
C) Refinancings
D) Home Improvement Loans
F) Non-occupant Loans on < 5 Family Dwellings (A B C & D)
Number
Average Value
Number
Average Value
Number
Average Value
Number
Average Value
Number
Average Value
LOANS ORIGINATED
13
$104,614
25
$71,570
83
$100,148
13
$17,812
8
$54,208
APPLICATIONS APPROVED, NOT ACCEPTED
0
$0
7
$68,686
18
$88,936
1
$13,370
1
$63,630
APPLICATIONS DENIED
3
$87,697
17
$49,409
55
$85,125
8
$24,358
2
$32,540
APPLICATIONS WITHDRAWN
1
$122,700
2
$140,575
19
$90,444
1
$33,720
0
$0
FILES CLOSED FOR INCOMPLETENESS
0
$0
1
$78,440
4
$112,830
0
$0
0
$0
Aggregated Statistics For Year 2002 (Based on 3 partial tracts)
A) FHA, FSA/RHS & VA Home Purchase Loans
B) Conventional Home Purchase Loans
C) Refinancings
D) Home Improvement Loans
F) Non-occupant Loans on < 5 Family Dwellings (A B C & D)
Number
Average Value
Number
Average Value
Number
Average Value
Number
Average Value
Number
Average Value
LOANS ORIGINATED
15
$107,740
19
$78,391
60
$108,199
7
$25,384
3
$243,970
APPLICATIONS APPROVED, NOT ACCEPTED
1
$84,930
11
$48,856
15
$83,062
1
$63,910
1
$40,570
APPLICATIONS DENIED
1
$108,160
23
$48,047
46
$72,098
10
$19,690
2
$48,880
APPLICATIONS WITHDRAWN
1
$121,150
2
$77,205
18
$86,590
1
$7,170
0
$0
FILES CLOSED FOR INCOMPLETENESS
0
$0
1
$85,590
6
$93,207
0
$0
0
$0
Aggregated Statistics For Year 2001 (Based on 3 partial tracts)
A) FHA, FSA/RHS & VA Home Purchase Loans
B) Conventional Home Purchase Loans
C) Refinancings
D) Home Improvement Loans
F) Non-occupant Loans on < 5 Family Dwellings (A B C & D)
Number
Average Value
Number
Average Value
Number
Average Value
Number
Average Value
Number
Average Value
LOANS ORIGINATED
10
$103,143
32
$61,387
48
$84,641
14
$15,071
5
$50,736
APPLICATIONS APPROVED, NOT ACCEPTED
0
$0
11
$53,290
10
$85,774
1
$20,220
0
$0
APPLICATIONS DENIED
0
$0
46
$44,330
47
$70,896
14
$15,201
4
$34,058
APPLICATIONS WITHDRAWN
1
$69,680
3
$49,740
14
$73,317
2
$18,745
1
$67,530
FILES CLOSED FOR INCOMPLETENESS
0
$0
0
$0
2
$147,345
0
$0
0
$0
Aggregated Statistics For Year 2000 (Based on 3 partial tracts)
A) FHA, FSA/RHS & VA Home Purchase Loans
B) Conventional Home Purchase Loans
C) Refinancings
D) Home Improvement Loans
F) Non-occupant Loans on < 5 Family Dwellings (A B C & D)
Number
Average Value
Number
Average Value
Number
Average Value
Number
Average Value
Number
Average Value
LOANS ORIGINATED
6
$78,777
39
$52,328
35
$66,413
13
$12,082
5
$84,612
APPLICATIONS APPROVED, NOT ACCEPTED
2
$67,865
16
$43,253
8
$61,474
2
$32,335
1
$30,170
APPLICATIONS DENIED
2
$38,960
56
$47,916
28
$60,565
5
$11,648
4
$52,318
APPLICATIONS WITHDRAWN
1
$24,020
7
$59,693
9
$64,234
1
$12,830
1
$36,520
FILES CLOSED FOR INCOMPLETENESS
0
$0
0
$0
5
$53,604
0
$0
0
$0
Aggregated Statistics For Year 1999 (Based on 3 partial tracts)
A) FHA, FSA/RHS & VA Home Purchase Loans
B) Conventional Home Purchase Loans
C) Refinancings
D) Home Improvement Loans
F) Non-occupant Loans on < 5 Family Dwellings (A B C & D)
2003 - 2018 National Fire Incident Reporting System (NFIRS) incidents
Based on the data from the years 2003 - 2018 the average number of fire incidents per year is 14. The highest number of reported fires - 25 took place in 2008, and the least - 3 in 2003. The data has a growing trend.
When looking into fire subcategories, the most incidents belonged to: Outside Fires (51.1%), and Structure Fires (41.4%).
Fire incident types reported to NFIRS in Zip Code 36875


 Nearest zip codes: 36869, 36870, 36871, 36858, 36856, 36859.


 Based on the data from the years 2003 - 2018 the average number of fire incidents per year is 14. The highest number of reported fires - 25 took place in 2008, and the least - 3 in 2003. The data has a growing trend.
 When looking into fire subcategories, the most incidents belonged to: Outside Fires (51.1%), and Structure Fires (41.4%).