Averages for the 2020 tax year for zip code 36043, filed in 2021:
Average Adjusted Gross Income (AGI) in 2020: $57,214 (Individual Income Tax Returns)
Here:
$57,214
State:
$63,984
Salary/wage: $49,907 (reported on 80.4% of returns)
Here:
$49,907
State:
$52,834
(% of AGI for various income ranges: 1370.8% for AGIs below $25k, 3945.8% for AGIs $25k-50k, 7345.3% for AGIs $50k-75k, 8605.5% for AGIs $75k-100k, 16236.7% for AGIs $100k-200k)
Taxable interest for individuals: $957 (reported on 30.4% of returns)
This zip code:
$957
Alabama:
$1,615
(% of AGI for various income ranges: 17.2% for AGIs below $25k, 12.5% for AGIs $25k-50k, 42.0% for AGIs $50k-75k, 48.2% for AGIs $75k-100k, 106.7% for AGIs $100k-200k)
Ordinary dividends: $6,755 (reported on 13.1% of returns)
Here:
$6,755
State:
$7,660
(% of AGI for various income ranges: 21.3% for AGIs below $25k, 13.3% for AGIs $25k-50k, 76.0% for AGIs $50k-75k, 68.2% for AGIs $75k-100k, 315.0% for AGIs $100k-200k)
Net capital gain/loss in AGI: +$9,815 (reported on 11.9% of returns)
Here:
+$9,815
State:
+$23,528
(% of AGI for various income ranges: 17.9% for AGIs below $25k, 38.3% for AGIs $25k-50k, 85.3% for AGIs $50k-75k, 184.5% for AGIs $75k-100k, 453.3% for AGIs $100k-200k)
Profit/loss from business: +$5,725 (reported on 19.0% of returns)
Here:
+$5,725
State:
+$9,534
(% of AGI for various income ranges: 55.6% for AGIs below $25k, 137.3% for AGIs $50k-75k, 178.2% for AGIs $75k-100k, 1024.2% for AGIs $100k-200k)
Taxable individual retirement arrangement distribution: $12,985 (reported on 7.7% of returns)
36043:
$12,985
Alabama:
$19,004
(% of AGI for various income ranges: 62.6% for AGIs below $25k, 85.6% for AGIs $25k-50k, 318.7% for AGIs $50k-75k, 548.3% for AGIs $100k-200k)
Total itemized deductions: $30,180 (reported on 6.0% of returns)
Here:
$30,180
State:
$37,338
(% of AGI for various income ranges: 252.8% for AGIs $25k-50k, 494.5% for AGIs $75k-100k, 1303.3% for AGIs $100k-200k)
Charity contributions: $12,278 (reported on 5.4% of returns)
Here:
$12,278
State:
$18,005
(% of AGI for various income ranges: 43.9% for AGIs $25k-50k, 130.0% for AGIs $50k-75k, 626.7% for AGIs $100k-200k)
Taxes paid: $4,950 (reported on 6.0% of returns)
36043:
$4,950
State:
$6,484
(% of AGI for various income ranges: 31.1% for AGIs $25k-50k, 78.2% for AGIs $75k-100k, 247.5% for AGIs $100k-200k)
Earned income credit: $2,465 (reported on 20.2% of returns)
Here:
$2,465
State:
$2,628
(% of AGI for various income ranges: 143.3% for AGIs below $25k, 77.5% for AGIs $25k-50k)
Percentage of individuals using paid preparers for their 2020 taxes: 89.9%
Here:
90%
State:
93%
(% for various income ranges: 88.9% for AGIs below $25k, 88.0% for AGIs $25k-50k, 91.3% for AGIs $50k-75k, 87.5% for AGIs $75k-100k, 95.2% for AGIs $100k-200k, 100.0% for AGIs over 200k)
Averages for the 2012 tax year for zip code 36043, filed in 2013:
Average Adjusted Gross Income (AGI) in 2012: $48,057 (Individual Income Tax Returns)
Here:
$48,057
State:
$52,001
Salary/wage: $41,612 (reported on 83.6% of returns)
Here:
$41,612
State:
$43,822
(% of AGI for various income ranges: 82.3% for AGIs below $25k, 81.5% for AGIs $25k-50k, 73.8% for AGIs $50k-75k, 75.0% for AGIs $75k-100k, 69.9% for AGIs $100k-200k, 49.6% for AGIs over 200k)
Taxable interest for individuals: $953 (reported on 27.5% of returns)
This zip code:
$953
Alabama:
$1,592
(% of AGI for various income ranges: 0.7% for AGIs below $25k, 0.7% for AGIs $25k-50k, 0.5% for AGIs $50k-75k, 0.1% for AGIs $75k-100k, 0.5% for AGIs $100k-200k, 0.8% for AGIs over 200k)
Ordinary dividends: $7,357 (reported on 13.5% of returns)
Here:
$7,357
State:
$5,697
(% of AGI for various income ranges: 0.6% for AGIs below $25k, 0.7% for AGIs $25k-50k, 1.0% for AGIs $50k-75k, 0.9% for AGIs $75k-100k, 6.6% for AGIs $100k-200k)
Net capital gain/loss in AGI: +$5,744 (reported on 9.4% of returns)
Here:
+$5,744
State:
+$13,286
(% of AGI for various income ranges: 0.6% for AGIs below $25k, 1.8% for AGIs $100k-200k, 5.1% for AGIs over 200k)
Profit/loss from business: +$4,585 (reported on 15.8% of returns)
Here:
+$4,585
State:
+$9,151
(% of AGI for various income ranges: 4.3% for AGIs below $25k, 1.6% for AGIs $25k-50k, 1.5% for AGIs $50k-75k, 1.3% for AGIs $75k-100k, 1.0% for AGIs $100k-200k)
Taxable individual retirement arrangement distribution: $10,933 (reported on 7.0% of returns)
36043:
$10,933
Alabama:
$14,992
(% of AGI for various income ranges: 1.6% for AGIs below $25k, 3.0% for AGIs $25k-50k, 2.9% for AGIs $75k-100k, 1.5% for AGIs $100k-200k)
Total itemized deductions: $18,720 (22% of AGI, reported on 29.8% of returns)
Here:
$18,720
State:
$21,388
Here:
22.4% of AGI
State:
20.1% of AGI
(% of AGI for various income ranges: 9.6% for AGIs below $25k, 10.3% for AGIs $25k-50k, 15.0% for AGIs $50k-75k, 11.2% for AGIs $75k-100k, 13.3% for AGIs $100k-200k, 8.9% for AGIs over 200k)
Charity contributions: $5,191 (reported on 25.1% of returns)
Here:
$5,191
State:
$5,925
(% of AGI for various income ranges: 1.5% for AGIs below $25k, 1.7% for AGIs $25k-50k, 4.0% for AGIs $50k-75k, 2.6% for AGIs $75k-100k, 3.4% for AGIs $100k-200k, 2.6% for AGIs over 200k)
Taxes paid: $4,028 (reported on 29.2% of returns)
36043:
$4,028
State:
$5,272
(% of AGI for various income ranges: 0.9% for AGIs below $25k, 1.4% for AGIs $25k-50k, 2.8% for AGIs $50k-75k, 2.2% for AGIs $75k-100k, 3.2% for AGIs $100k-200k, 3.9% for AGIs over 200k)
Earned income credit: $2,679 (reported on 24.6% of returns)
Here:
$2,679
State:
$2,646
(% of AGI for various income ranges: 9.9% for AGIs below $25k, 1.2% for AGIs $25k-50k)
Percentage of individuals using paid preparers for their 2012 taxes: 57.9%
Here:
58%
State:
60%
(% for various income ranges: 57.1% for AGIs below $25k, 55.3% for AGIs $25k-50k, 57.1% for AGIs $50k-75k, 60.0% for AGIs $75k-100k, 60.0% for AGIs $100k-200k, 100.0% for AGIs over 200k)
Averages for the 2004 tax year for zip code 36043, filed in 2005:
Average Adjusted Gross Income (AGI) in 2004: $40,858 (Individual Income Tax Returns)
Here:
$40,858
State:
$42,302
Salary/wage: $35,471 (reported on 84.6% of returns)
Here:
$35,471
State:
$36,626
(% of AGI for various income ranges: 121.5% for AGIs below $10k, 85.5% for AGIs $10k-25k, 84.5% for AGIs $25k-50k, 77.8% for AGIs $50k-75k, 80.0% for AGIs $75k-100k, 51.8% for AGIs over 100k)
Taxable interest for individuals: $1,876 (reported on 31.7% of returns)
This zip code:
$1,876
Alabama:
$1,827
(% of AGI for various income ranges: 6.2% for AGIs below $10k, 0.9% for AGIs $10k-25k, 1.2% for AGIs $25k-50k, 1.7% for AGIs $50k-75k, 0.6% for AGIs $75k-100k, 2.0% for AGIs over 100k)
Taxable dividends: $3,773 (reported on 16.3% of returns)
Here:
$3,773
State:
$4,206
(% of AGI for various income ranges: 3.5% for AGIs below $10k, 0.6% for AGIs $10k-25k, 0.9% for AGIs $25k-50k, 1.2% for AGIs $50k-75k, 0.5% for AGIs $75k-100k, 2.9% for AGIs over 100k)
Net capital gain/loss: +$7,106 (reported on 12.5% of returns)
Here:
+$7,106
State:
+$13,031
(% of AGI for various income ranges: -1.4% for AGIs below $10k, 0.2% for AGIs $10k-25k, 0.3% for AGIs $25k-50k, 0.4% for AGIs $50k-75k, -0.1% for AGIs $75k-100k, 6.9% for AGIs over 100k)
Profit/loss from business: +$4,253 (reported on 18.5% of returns)
Here:
+$4,253
State:
+$8,302
(% of AGI for various income ranges: 7.8% for AGIs below $10k, 4.0% for AGIs $10k-25k, 0.9% for AGIs $25k-50k, 2.9% for AGIs $50k-75k, 2.2% for AGIs $75k-100k, 0.7% for AGIs over 100k)
IRA payment deduction: $3,278 (reported on 2.1% of returns)
36043:
$3,278
Alabama:
$3,006
Total itemized deductions: $16,649 (21% of AGI, reported on 28.0% of returns)
Here:
$16,649
State:
$17,623
Here:
20.9% of AGI
State:
20.8% of AGI
(% of AGI for various income ranges: 9.8% for AGIs below $10k, 6.8% for AGIs $10k-25k, 11.2% for AGIs $25k-50k, 14.7% for AGIs $50k-75k, 14.3% for AGIs $75k-100k, 10.1% for AGIs over 100k)
Charity contributions deductions: $4,207 (5% of AGI, reported on 25.4% of returns)
Here:
$4,207
State:
$4,768
Here:
5.0% of AGI
State:
5.4% of AGI
(% of AGI for various income ranges: 1.4% for AGIs $10k-25k, 2.4% for AGIs $25k-50k, 3.2% for AGIs $50k-75k, 4.0% for AGIs $75k-100k, 2.4% for AGIs over 100k)
Total tax: $6,301 (reported on 68.9% of returns)
36043:
$6,301
State:
$6,905
(% of AGI for various income ranges: 4.7% for AGIs below $10k, 3.3% for AGIs $10k-25k, 5.8% for AGIs $25k-50k, 8.7% for AGIs $50k-75k, 10.6% for AGIs $75k-100k, 18.9% for AGIs over 100k)
Earned income credit: $2,186 (reported on 27.3% of returns)
Here:
$2,186
State:
$2,048
Percentage of individuals using paid preparers for their 2004 taxes: 63.3%
Here:
63%
State:
65%
(% for various income ranges: 59.2% for AGIs below $10k, 65.1% for AGIs $10k-25k, 67.0% for AGIs $25k-50k, 60.2% for AGIs $50k-75k, 58.5% for AGIs $75k-100k, 62.7% for AGIs over 100k)
Likely homosexual households (counted as self-reported same-sex unmarried-partner households)
Lesbian couples: 0.3% of all households
Gay men: 1.1% of all households
Household received Food Stamps/SNAP in the past 12 months: 109 Household did not receive Food Stamps/SNAP in the past 12 months: 1,258
Women who had a birth in the past 12 months: 56 (64 now married, 0 unmarried) Women who did not have a birth in the past 12 months: 806 (371 now married, 434 unmarried)
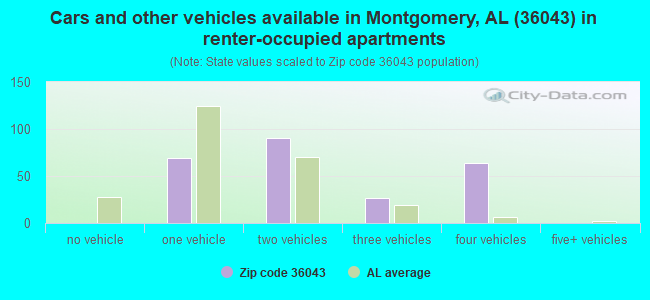
Housing units in zip code 36043 with a mortgage: 421 (31 second mortgage, 33 both second mortgage and home equity loan) Houses without a mortgage: 10
Median monthly owner costs for units with a mortgage: $1,464 Median monthly owner costs for units without a mortgage: $373
Residents with income below the poverty level in 2022:
This zip code:
8.1%
Whole state:
16.2%
Residents with income below 50% of the poverty level in 2022:
This zip code:
4.3%
Whole state:
8.6%
Median number of rooms in houses and condos:
Here:
6.9
State:
6.5
Median number of rooms in apartments:
Here:
6.4
State:
4.7
Notable locations in this zip code not listed on our city pages
Notable locations in zip code 36043: Hope Hull Recreation Center (A), Burkville Volunteer Fire Department (B), Pintlala Volunteer Fire Department Station 1 (C), Pintlala Volunteer Fire Department Station 2 (D). Display/hide their locations on the map
Churches in zip code 36043 include: New Pleasant Valley African Methodist Episcopal Zion Church (A), Mount Sinai Church (B), Pleasant Valley Church (C), Tabernacle Church (D), Beulah Church (E), Hope Hull Church (F), Bezziel Springs Church (G), Christ Church (H), Friendship Church (I). Display/hide their locations on the map
Cemeteries: Davis Cemetery (1), Powell Cemetery (2), Mosleys Cemetery (3), Ganey Cemetery (4), Murrell Cemetery (5), Ball Cemetery (6), Relf Cemetery (7). Display/hide their locations on the map
Reservoirs: Wynn and Harrell Pond (A), Silvests Pond (B), Rogers Pond (C), Lake Linda (D), Harrell Lake (E), Judges Pond (F), Huffmans Pond (G), Guys Pond (H). Display/hide their locations on the map
Tourist attraction (not listed on the city page) : Montgomery City County Publicrary (Cultural Attractions- Events- & Facilities; 255 Federal Road) (1). Display/hide its approximate location on the map
Size of family households: 488 2-persons, 275 3-persons, 178 4-persons, 52 5-persons, 50 7-or-more-persons
Size of nonfamily households: 312 1-person, 18 2-persons
480 married couples with children.
112 single-parent households (39 men, 73 women).
93.7% of residents of 36043 zip code speak English at home.
5.9% of residents speak Spanish at home (30% very well, 28% well, 41% not well).
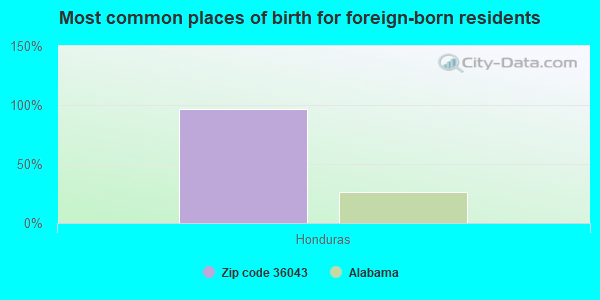
Foreign born population: 132 (3.5%) (0.0% of them are naturalized citizens)
:
3.5%
Whole state:
3.8%
97%Honduras
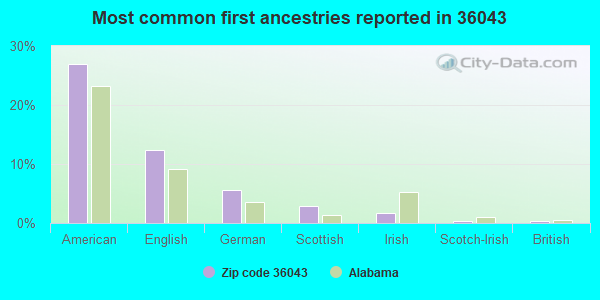
27%American
12%English
6%German
3%Scottish
2%Irish
0%Scotch-Irish
0%British
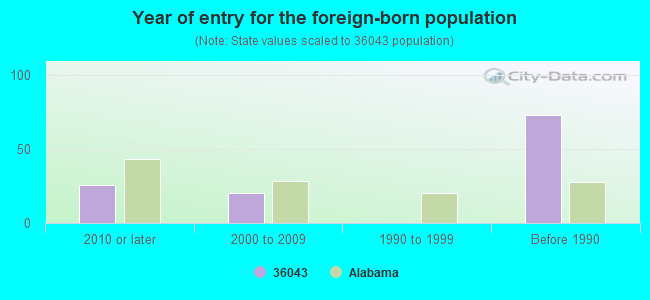
Year of entry for the foreign-born population
262010 or later
202000 to 2009
01990 to 1999
73Before 1990
Facilities with environmental interests located in this zip code:
PINTLALA ELEMENTARY SCHOOL (215 FEDERAL RD in HOPE HULL, AL)
(Geographic Names Information System) (National Center for Education Statistics) - STATE ID-0520 Organizations: MONTGOMERY COUNTY (SCHOOL DISTRICT)
ADOT ACSTPAA 5110 104 (ALABAMA DEPARTMENT OF TRANSPOR in HOPEHULL, AL)
National Pollutant Discharge Elimination System NON-MAJOR (Tracking pollutant discharge elimination systems) - permit Business SIC classification: HIGHWAY AND STREET CONSTRUCTION, EXCEPT ELEVATED HIGHWAYS Organizations: ADIT ACSTOAA 5110 104 (CONTACT/OPERATOR)
CASEY FARMS (DON CASEY in HOPE HULL, AL)
National Pollutant Discharge Elimination System NON-MAJOR (Tracking pollutant discharge elimination systems) - permit Business SIC classification: POULTRY AND EGGS Alternative names: DON CASEY
MONTGOMERY KOA CAMPGROUND (250 FISCHER ROAD in HOPE HULL, AL)
National Pollutant Discharge Elimination System NON-MAJOR (Tracking pollutant discharge elimination systems) - permit Business SIC classification: RECREATIONAL VEHICLE PARKS AND CAMPSITES
ARMORY COMMISSION OF ALABAMA (AASF NO 1) (4640 BOBBY HOGAN DR in HOPE HULL, AL)
STATE MASTER (PERMIT TRACKING) Conditionally Exempt Small Quantity Generators, less than 100 kg/month of hazardous waste (Resource Conservation and Recovery Act (tracking hazardous waste)) Business NAICS classification: COMMUNICATION EQUIPMENT REPAIR AND MAINTENANCE. Alternative names: ARMORY COMM ALA ARMY AVIATION, ARMY AVIATION SUPPORT FACILITY, ARMY AVIATION SUPPORT FACILITY #1 (ARMORY COMMISSION OF ALABAMA)
CHARLES G LAWSON TRUCKING CO (7815 MOBILE HWY in HOPE HULL, AL)
National Pollutant Discharge Elimination System NON-MAJOR (Tracking pollutant discharge elimination systems) - permit Business SIC classification: TRUCKING, EXCEPT LOCAL Alternative names: CHARLES LAWSON TRUCKING
CIRCLE J INERT LANDFILL (HIGHWAY 143 HOPE HULL in HOPE HULL, AL)
National Pollutant Discharge Elimination System NON-MAJOR (Tracking pollutant discharge elimination systems) - permit Business SIC classification: REFUSE SYSTEMS
MOTEL 6 (HOPE HOSPITALITY INCORPORATION in HOPE HULL, AL)
National Pollutant Discharge Elimination System NON-MAJOR (Tracking pollutant discharge elimination systems) - permit Business SIC classification: GENERAL CONTRACTORS-RESIDENTIAL BUILDINGS, OTHER THAN SINGLE-FAMILY Alternative names: HOPE HOSPITALITY INC
CHARLES GREEN TRACK REPAIR (105 ROLLING ACRES ROAD in HOPE HULL, AL)
Conditionally Exempt Small Quantity Generators, less than 100 kg/month of hazardous waste (Resource Conservation and Recovery Act (tracking hazardous waste))
Housing units lacking complete plumbing facilities: 4.4% Housing units lacking complete kitchen facilities: 1.8%
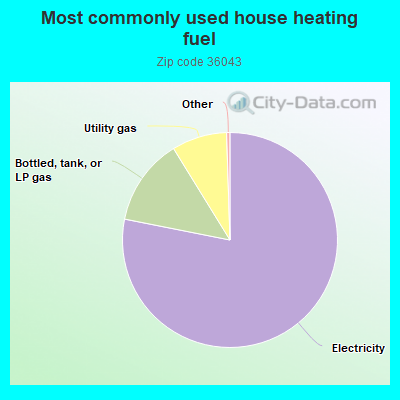
78.2%Electricity
13.1%Bottled, tank, or LP gas
8.3%Utility gas
Population in 1990: 2,961. Population change in the 1990s: +1,160 (+39.2%).
Place of birth for U.S.-born residents:
This state: 3,339
Northeast: 27
Midwest: 53
South: 214
West: 38
60% of the 36043 zip code residents lived in the same house 5 years ago. Out of people who lived in different houses, 58% lived in this county. Out of people who lived in different counties, 50% lived in Alabama.
88% of the 36043 zip code residents lived in the same house 1 year ago. Out of people who lived in different houses, 27% moved from this county. Out of people who lived in different houses, 46% moved from different county within same state. Out of people who lived in different houses, 30% moved from different state.
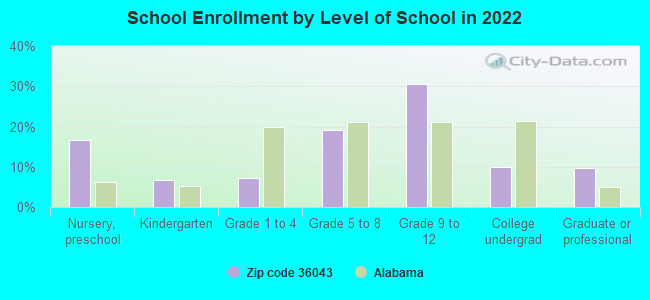
Private vs. public school enrollment:
Students in private schools in grades 1 to 8 (elementary and middle school): 70
Here:
35.0%
Alabama:
14.7%
Students in private schools in grades 9 to 12 (high school): 91
Here:
39.4%
Alabama:
16.3%
Students in private undergraduate colleges: 37
Here:
52.6%
Alabama:
14.6%
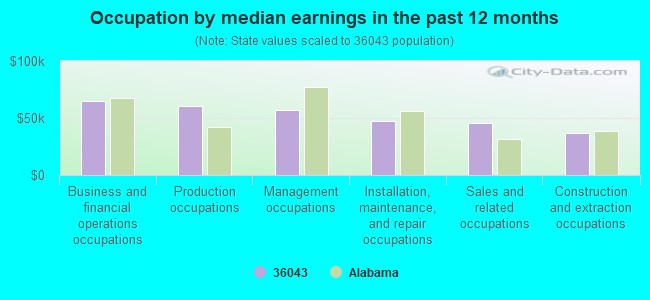
Occupation by median earnings in the past 12 months ($)
65,020Business and financial operations occupations
60,895Production occupations
56,981Management occupations
46,930Installation, maintenance, and repair occupations
45,611Sales and related occupations
37,232Construction and extraction occupations
Companies with federal contracts located in this zip code:
MILTOPE CORPORATION (3800 RICHARDSON RD in HOPE HULL, AL; small business) : $196,015,120 in 394 contractsfrom 1999 to 2006
Contracts for Electrical and Electronic Properties Measuring and Testing Instruments, Guns, through 30 mm, Fire Control Systems, Complete, ADP Input/Output and Storage Devices, and moreby Army, Navy, Department of Defense, U.S. Special Operations Command, and others Signed by year:2000: $32,156,148; 2001: $27,925,188; 2002: $45,449,712; 2003: $34,791,078; 2004: $30,285,231; 2005: $20,196,683; 2006: $4,325,397.
Biggest contracts:
$26,817,586 with Army for Electrical and Electronic Properties Measuring and Testing Instruments. Signed on 2002-03-15. Completion date: 2006-05-31.
$15,973,089, same as above.Signed on 2001-03-01. Completion date: 2003-06-30.
$14,988,953, same as above.Signed on 2003-03-19. Completion date: 2006-05-31.
$13,599,547, same as above.Signed on 2000-01-19. Completion date: 2000-06-20.
Top industries in this zip code by the number of employees in 2005:
Construction: Highway, Street, and Bridge Construction (100-249 employees: 1 establishment)
Educational Services: Elementary and Secondary Schools (50-99: 1)
Accommodation and Food Services: Limited-Service Restaurants (20-49: 1, 5-9: 1)
Construction: Structural Steel and Precast Concrete Contractors (20-49: 1)
Administrative and Support and Waste Management and Remediation Services: Solid Waste Collection (20-49: 1)
People in group quarters in 2000:
29 people in other noninstitutional group quarters
13 people in nursing homes
Fatal accident statistics in 2014:
Fatal accident count: 1
Vehicles involved in fatal accidents: 2
Fatal accidents caused by drunken drivers: 0
Fatalities: 1
Persons involved in fatal accidents: 4
Pedestrians involved in fatal accidents: 0
Fatal accident statistics in 2013:
Fatal accident count: 2
Vehicles involved in fatal accidents: 2
Fatal accidents caused by drunken drivers: 2
Fatalities: 2
Persons involved in fatal accidents: 2
Pedestrians involved in fatal accidents: 0
Home Mortgage Disclosure Act Aggregated Statistics For Year 2009 (Based on 1 partial tract)
A) FHA, FSA/RHS & VA Home Purchase Loans
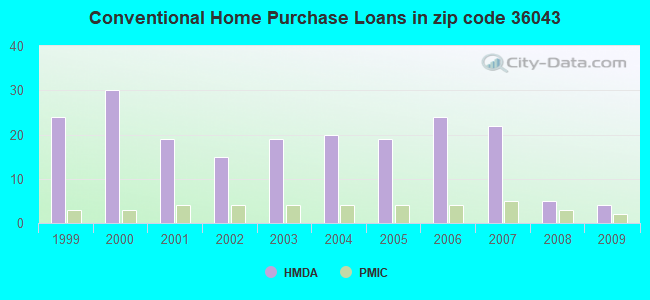
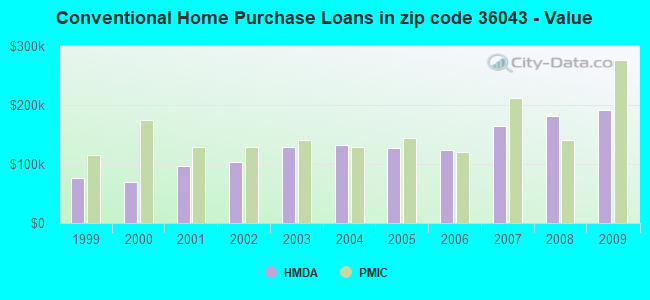
B) Conventional Home Purchase Loans
C) Refinancings
D) Home Improvement Loans
F) Non-occupant Loans on < 5 Family Dwellings (A B C & D)
G) Loans On Manufactured Home Dwelling (A B C & D)
Number
Average Value
Number
Average Value
Number
Average Value
Number
Average Value
Number
Average Value
Number
Average Value
LOANS ORIGINATED
3
$245,183
4
$191,642
32
$187,455
1
$6,030
1
$240,440
2
$59,250
APPLICATIONS APPROVED, NOT ACCEPTED
0
$0
0
$0
4
$176,452
0
$0
0
$0
1
$43,950
APPLICATIONS DENIED
3
$121,943
2
$57,525
17
$166,353
1
$101,690
0
$0
2
$111,820
APPLICATIONS WITHDRAWN
1
$183,560
1
$137,030
12
$217,892
0
$0
0
$0
1
$128,410
FILES CLOSED FOR INCOMPLETENESS
0
$0
1
$170,210
4
$201,445
0
$0
1
$127,980
0
$0
Aggregated Statistics For Year 2008 (Based on 1 partial tract)
A) FHA, FSA/RHS & VA Home Purchase Loans
B) Conventional Home Purchase Loans
C) Refinancings
D) Home Improvement Loans
F) Non-occupant Loans on < 5 Family Dwellings (A B C & D)
G) Loans On Manufactured Home Dwelling (A B C & D)
Number
Average Value
Number
Average Value
Number
Average Value
Number
Average Value
Number
Average Value
Number
Average Value
LOANS ORIGINATED
3
$146,220
5
$181,668
26
$164,538
3
$21,690
1
$418,400
3
$71,530
APPLICATIONS APPROVED, NOT ACCEPTED
0
$0
3
$145,787
3
$201,087
0
$0
0
$0
3
$47,257
APPLICATIONS DENIED
0
$0
7
$89,196
29
$119,047
4
$23,268
2
$31,885
9
$61,858
APPLICATIONS WITHDRAWN
0
$0
1
$209,850
10
$172,662
1
$75,410
1
$86,610
1
$187,010
FILES CLOSED FOR INCOMPLETENESS
0
$0
0
$0
6
$149,378
0
$0
1
$29,730
0
$0
Aggregated Statistics For Year 2007 (Based on 1 partial tract)
A) FHA, FSA/RHS & VA Home Purchase Loans
B) Conventional Home Purchase Loans
C) Refinancings
D) Home Improvement Loans
F) Non-occupant Loans on < 5 Family Dwellings (A B C & D)
G) Loans On Manufactured Home Dwelling (A B C & D)
Number
Average Value
Number
Average Value
Number
Average Value
Number
Average Value
Number
Average Value
Number
Average Value
LOANS ORIGINATED
3
$156,130
22
$165,074
25
$140,249
3
$30,020
5
$91,264
5
$59,982
APPLICATIONS APPROVED, NOT ACCEPTED
0
$0
3
$132,287
6
$205,612
1
$86,610
0
$0
3
$81,153
APPLICATIONS DENIED
1
$105,570
11
$95,934
20
$316,453
9
$36,579
3
$1,307,207
9
$50,080
APPLICATIONS WITHDRAWN
2
$144,565
3
$228,520
12
$196,490
1
$28,440
1
$151,250
1
$70,240
FILES CLOSED FOR INCOMPLETENESS
0
$0
0
$0
3
$176,093
0
$0
0
$0
0
$0
Aggregated Statistics For Year 2006 (Based on 1 partial tract)
A) FHA, FSA/RHS & VA Home Purchase Loans
B) Conventional Home Purchase Loans
C) Refinancings
D) Home Improvement Loans
F) Non-occupant Loans on < 5 Family Dwellings (A B C & D)
G) Loans On Manufactured Home Dwelling (A B C & D)
Number
Average Value
Number
Average Value
Number
Average Value
Number
Average Value
Number
Average Value
Number
Average Value
LOANS ORIGINATED
3
$148,373
24
$124,368
34
$126,266
5
$39,470
6
$138,535
6
$48,548
APPLICATIONS APPROVED, NOT ACCEPTED
0
$0
4
$73,575
3
$122,807
2
$55,585
0
$0
2
$47,185
APPLICATIONS DENIED
1
$113,330
11
$112,856
28
$115,928
6
$68,513
3
$92,787
6
$58,818
APPLICATIONS WITHDRAWN
0
$0
4
$115,265
20
$126,771
1
$104,710
2
$70,450
1
$86,610
FILES CLOSED FOR INCOMPLETENESS
0
$0
0
$0
6
$219,687
0
$0
0
$0
0
$0
Aggregated Statistics For Year 2005 (Based on 1 partial tract)
A) FHA, FSA/RHS & VA Home Purchase Loans
B) Conventional Home Purchase Loans
C) Refinancings
D) Home Improvement Loans
F) Non-occupant Loans on < 5 Family Dwellings (A B C & D)
G) Loans On Manufactured Home Dwelling (A B C & D)
Number
Average Value
Number
Average Value
Number
Average Value
Number
Average Value
Number
Average Value
Number
Average Value
LOANS ORIGINATED
2
$174,945
19
$126,390
31
$146,937
5
$63,688
6
$99,897
6
$39,643
APPLICATIONS APPROVED, NOT ACCEPTED
0
$0
3
$114,043
6
$114,548
1
$45,240
0
$0
2
$54,725
APPLICATIONS DENIED
0
$0
13
$72,689
25
$165,776
6
$36,123
1
$174,510
7
$28,377
APPLICATIONS WITHDRAWN
0
$0
3
$143,347
10
$178,479
2
$495,965
0
$0
0
$0
FILES CLOSED FOR INCOMPLETENESS
0
$0
0
$0
5
$127,978
0
$0
0
$0
0
$0
Aggregated Statistics For Year 2004 (Based on 1 partial tract)
A) FHA, FSA/RHS & VA Home Purchase Loans
B) Conventional Home Purchase Loans
C) Refinancings
D) Home Improvement Loans
F) Non-occupant Loans on < 5 Family Dwellings (A B C & D)
G) Loans On Manufactured Home Dwelling (A B C & D)
Number
Average Value
Number
Average Value
Number
Average Value
Number
Average Value
Number
Average Value
Number
Average Value
LOANS ORIGINATED
1
$181,840
20
$132,437
33
$124,582
3
$41,080
3
$108,300
6
$29,803
APPLICATIONS APPROVED, NOT ACCEPTED
0
$0
5
$82,560
11
$83,281
0
$0
0
$0
3
$59,320
APPLICATIONS DENIED
0
$0
3
$78,137
27
$98,533
6
$29,013
0
$0
5
$53,432
APPLICATIONS WITHDRAWN
0
$0
2
$116,990
8
$118,712
0
$0
1
$86,180
0
$0
FILES CLOSED FOR INCOMPLETENESS
0
$0
1
$93,070
5
$152,970
1
$29,730
0
$0
0
$0
Aggregated Statistics For Year 2003 (Based on 1 partial tract)
A) FHA, FSA/RHS & VA Home Purchase Loans
B) Conventional Home Purchase Loans
C) Refinancings
D) Home Improvement Loans
F) Non-occupant Loans on < 5 Family Dwellings (A B C & D)
Number
Average Value
Number
Average Value
Number
Average Value
Number
Average Value
Number
Average Value
LOANS ORIGINATED
0
$0
19
$129,542
62
$127,234
1
$66,790
2
$92,430
APPLICATIONS APPROVED, NOT ACCEPTED
1
$133,150
4
$147,368
10
$118,368
1
$38,780
0
$0
APPLICATIONS DENIED
1
$81,870
5
$43,952
31
$115,968
2
$109,450
0
$0
APPLICATIONS WITHDRAWN
1
$133,580
1
$149,090
13
$130,629
0
$0
0
$0
FILES CLOSED FOR INCOMPLETENESS
0
$0
0
$0
2
$86,395
0
$0
0
$0
Aggregated Statistics For Year 2002 (Based on 1 partial tract)
A) FHA, FSA/RHS & VA Home Purchase Loans
B) Conventional Home Purchase Loans
C) Refinancings
D) Home Improvement Loans
F) Non-occupant Loans on < 5 Family Dwellings (A B C & D)
Number
Average Value
Number
Average Value
Number
Average Value
Number
Average Value
Number
Average Value
LOANS ORIGINATED
1
$86,180
15
$102,554
32
$125,567
2
$49,770
4
$144,782
APPLICATIONS APPROVED, NOT ACCEPTED
0
$0
5
$46,538
6
$97,670
0
$0
0
$0
APPLICATIONS DENIED
0
$0
9
$58,171
23
$94,592
3
$22,263
1
$50,850
APPLICATIONS WITHDRAWN
0
$0
1
$120,650
9
$108,730
0
$0
0
$0
FILES CLOSED FOR INCOMPLETENESS
1
$43,520
0
$0
5
$169,172
0
$0
0
$0
Aggregated Statistics For Year 2001 (Based on 1 partial tract)
A) FHA, FSA/RHS & VA Home Purchase Loans
B) Conventional Home Purchase Loans
C) Refinancings
D) Home Improvement Loans
F) Non-occupant Loans on < 5 Family Dwellings (A B C & D)
Number
Average Value
Number
Average Value
Number
Average Value
Number
Average Value
Number
Average Value
LOANS ORIGINATED
1
$123,240
19
$97,429
29
$126,997
2
$8,620
4
$28,762
APPLICATIONS APPROVED, NOT ACCEPTED
0
$0
2
$34,255
11
$95,503
1
$21,550
0
$0
APPLICATIONS DENIED
1
$147,800
14
$45,921
21
$76,864
3
$15,800
1
$13,790
APPLICATIONS WITHDRAWN
2
$81,440
0
$0
11
$114,619
0
$0
0
$0
FILES CLOSED FOR INCOMPLETENESS
0
$0
0
$0
2
$82,085
0
$0
0
$0
Aggregated Statistics For Year 2000 (Based on 1 partial tract)
A) FHA, FSA/RHS & VA Home Purchase Loans
B) Conventional Home Purchase Loans
C) Refinancings
D) Home Improvement Loans
F) Non-occupant Loans on < 5 Family Dwellings (A B C & D)
Number
Average Value
Number
Average Value
Number
Average Value
Number
Average Value
Number
Average Value
LOANS ORIGINATED
3
$95,087
30
$68,973
22
$88,374
7
$34,533
3
$50,417
APPLICATIONS APPROVED, NOT ACCEPTED
0
$0
7
$55,833
3
$80,723
1
$12,930
0
$0
APPLICATIONS DENIED
2
$82,085
59
$36,612
15
$65,899
4
$25,530
3
$19,967
APPLICATIONS WITHDRAWN
2
$99,755
6
$411,222
6
$94,583
1
$12,070
1
$521,390
FILES CLOSED FOR INCOMPLETENESS
0
$0
1
$144,780
3
$83,450
0
$0
0
$0
Aggregated Statistics For Year 1999 (Based on 1 partial tract)
A) FHA, FSA/RHS & VA Home Purchase Loans
B) Conventional Home Purchase Loans
C) Refinancings
D) Home Improvement Loans
F) Non-occupant Loans on < 5 Family Dwellings (A B C & D)

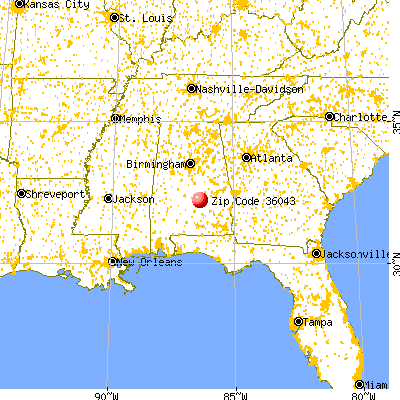


 Nearest zip codes: 36105, 36108, 36047, 36113, 36112, 36046.