Estimated zip code population in 2022: 55,166
Zip code population in 2010: 35,022
Zip code population in 2000: 18,017
Houses and condos: 25,222
Renter-occupied apartments: 4,711
% of renters here:
27%State:
33%
March 2022 cost of living index in zip code 34746: 93.1
(less than average, U.S. average is 100)
Land area: 42.8
sq. mi.
Water area: 12.5
sq. mi.
Population density: 1,289 people per square mile (low).
OSM Map
General Map
Google Map
MSN Map
OSM Map
General Map
Google Map
MSN Map
OSM Map
General Map
Google Map
MSN Map
OSM Map
General Map
Google Map
MSN Map
Please wait while loading the map...
Real estate property taxes paid for housing units in 2022:
This zip code:
0.8% ($2,800)Florida:
0.7% ($2,529)
Median real estate property taxes paid for housing units with mortgages in 2022: $2,811 (0.7%)
Median real estate property taxes paid for housing units with no mortgage in 2022: $2,753 (1.0%)
Profiles of local businesses
Business Search - 14 Million verified businesses
Males: 26,629 Females: 28,536
For population 25 years and over in 34746:
High school or higher: 87.0%Bachelor's degree or higher: 31.0%Graduate or professional degree: 10.8%Unemployed: 3.9%Mean travel time to work (commute): 33.4 minutes
For population 15 years and over in 34746:
Never married: 34.7%Now married: 47.8%Separated: 2.4%Widowed: 5.1%Divorced: 10.0%
Zip code 34746 compared to state average:
Hispanic race population percentage above state average. Median age below state average. Length of stay since moving in above state average. House age significantly below state average. 27,563 50.0% Hispanic or Latino 16,678 30.2% White 7,377 13.4% Black 1,697 3.1% Asian 1,476 2.7% Two or more races 261 0.5% Some other race 112 0.2% American Indian
Data:
Median household income ($)
Median household income (% change since 2000)
Household income diversity
Ratio of average income to average house value (%)
Ratio of average income to average rent
Median household income ($) - White
Median household income ($) - Black or African American
Median household income ($) - Asian
Median household income ($) - Hispanic or Latino
Median household income ($) - American Indian and Alaska Native
Median household income ($) - Multirace
Median household income ($) - Other Race
Median household income for houses/condos with a mortgage ($)
Median household income for apartments without a mortgage ($)
Races - White alone (%)
Races - White alone (% change since 2000)
Races - Black alone (%)
Races - Black alone (% change since 2000)
Races - American Indian alone (%)
Races - American Indian alone (% change since 2000)
Races - Asian alone (%)
Races - Asian alone (% change since 2000)
Races - Hispanic (%)
Races - Hispanic (% change since 2000)
Races - Native Hawaiian and Other Pacific Islander alone (%)
Races - Native Hawaiian and Other Pacific Islander alone (% change since 2000)
Races - Two or more races (%)
Races - Two or more races (% change since 2000)
Races - Other race alone (%)
Races - Other race alone (% change since 2000)
Racial diversity
Unemployment (%)
Unemployment (% change since 2000)
Unemployment (%) - White
Unemployment (%) - Black or African American
Unemployment (%) - Asian
Unemployment (%) - Hispanic or Latino
Unemployment (%) - American Indian and Alaska Native
Unemployment (%) - Multirace
Unemployment (%) - Other Race
Population density (people per square mile)
Population - Males (%)
Population - Females (%)
Population - Males (%) - White
Population - Males (%) - Black or African American
Population - Males (%) - Asian
Population - Males (%) - Hispanic or Latino
Population - Males (%) - American Indian and Alaska Native
Population - Males (%) - Multirace
Population - Males (%) - Other Race
Population - Females (%) - White
Population - Females (%) - Black or African American
Population - Females (%) - Asian
Population - Females (%) - Hispanic or Latino
Population - Females (%) - American Indian and Alaska Native
Population - Females (%) - Multirace
Population - Females (%) - Other Race
Coronavirus confirmed cases (Jun 12, 2024)
Deaths caused by coronavirus (Jun 12, 2024)
Coronavirus confirmed cases (per 100k population) (Jun 12, 2024)
Deaths caused by coronavirus (per 100k population) (Jun 12, 2024)
Daily increase in number of cases (Jun 12, 2024)
Weekly increase in number of cases (Jun 12, 2024)
Cases doubled (in days) (Jun 12, 2024)
Hospitalized patients (Apr 18, 2022)
Negative test results (Apr 18, 2022)
Total test results (Apr 18, 2022)
COVID Vaccine doses distributed (per 100k population) (Sep 19, 2023)
COVID Vaccine doses administered (per 100k population) (Sep 19, 2023)
COVID Vaccine doses distributed (Sep 19, 2023)
COVID Vaccine doses administered (Sep 19, 2023)
Likely homosexual households (%)
Likely homosexual households (% change since 2000)
Likely homosexual households - Lesbian couples (%)
Likely homosexual households - Lesbian couples (% change since 2000)
Likely homosexual households - Gay men (%)
Likely homosexual households - Gay men (% change since 2000)
Cost of living index
Median gross rent ($)
Median contract rent ($)
Median monthly housing costs ($)
Median house or condo value ($)
Median house or condo value ($ change since 2000)
Mean house or condo value by units in structure - 1, detached ($)
Mean house or condo value by units in structure - 1, attached ($)
Mean house or condo value by units in structure - 2 ($)
Mean house or condo value by units in structure by units in structure - 3 or 4 ($)
Mean house or condo value by units in structure - 5 or more ($)
Mean house or condo value by units in structure - Boat, RV, van, etc. ($)
Mean house or condo value by units in structure - Mobile home ($)
Median house or condo value ($) - White
Median house or condo value ($) - Black or African American
Median house or condo value ($) - Asian
Median house or condo value ($) - Hispanic or Latino
Median house or condo value ($) - American Indian and Alaska Native
Median house or condo value ($) - Multirace
Median house or condo value ($) - Other Race
Median resident age
Resident age diversity
Median resident age - Males
Median resident age - Females
Median resident age - White
Median resident age - Black or African American
Median resident age - Asian
Median resident age - Hispanic or Latino
Median resident age - American Indian and Alaska Native
Median resident age - Multirace
Median resident age - Other Race
Median resident age - Males - White
Median resident age - Males - Black or African American
Median resident age - Males - Asian
Median resident age - Males - Hispanic or Latino
Median resident age - Males - American Indian and Alaska Native
Median resident age - Males - Multirace
Median resident age - Males - Other Race
Median resident age - Females - White
Median resident age - Females - Black or African American
Median resident age - Females - Asian
Median resident age - Females - Hispanic or Latino
Median resident age - Females - American Indian and Alaska Native
Median resident age - Females - Multirace
Median resident age - Females - Other Race
Commute - mean travel time to work (minutes)
Travel time to work - Less than 5 minutes (%)
Travel time to work - Less than 5 minutes (% change since 2000)
Travel time to work - 5 to 9 minutes (%)
Travel time to work - 5 to 9 minutes (% change since 2000)
Travel time to work - 10 to 19 minutes (%)
Travel time to work - 10 to 19 minutes (% change since 2000)
Travel time to work - 20 to 29 minutes (%)
Travel time to work - 20 to 29 minutes (% change since 2000)
Travel time to work - 30 to 39 minutes (%)
Travel time to work - 30 to 39 minutes (% change since 2000)
Travel time to work - 40 to 59 minutes (%)
Travel time to work - 40 to 59 minutes (% change since 2000)
Travel time to work - 60 to 89 minutes (%)
Travel time to work - 60 to 89 minutes (% change since 2000)
Travel time to work - 90 or more minutes (%)
Travel time to work - 90 or more minutes (% change since 2000)
Marital status - Never married (%)
Marital status - Now married (%)
Marital status - Separated (%)
Marital status - Widowed (%)
Marital status - Divorced (%)
Median family income ($)
Median family income (% change since 2000)
Median non-family income ($)
Median non-family income (% change since 2000)
Median per capita income ($)
Median per capita income (% change since 2000)
Median family income ($) - White
Median family income ($) - Black or African American
Median family income ($) - Asian
Median family income ($) - Hispanic or Latino
Median family income ($) - American Indian and Alaska Native
Median family income ($) - Multirace
Median family income ($) - Other Race
Median year house/condo built
Median year apartment built
Year house built - Built 2005 or later (%)
Year house built - Built 2000 to 2004 (%)
Year house built - Built 1990 to 1999 (%)
Year house built - Built 1980 to 1989 (%)
Year house built - Built 1970 to 1979 (%)
Year house built - Built 1960 to 1969 (%)
Year house built - Built 1950 to 1959 (%)
Year house built - Built 1940 to 1949 (%)
Year house built - Built 1939 or earlier (%)
Average household size
Household density (households per square mile)
Average household size - White
Average household size - Black or African American
Average household size - Asian
Average household size - Hispanic or Latino
Average household size - American Indian and Alaska Native
Average household size - Multirace
Average household size - Other Race
Occupied housing units (%)
Vacant housing units (%)
Owner occupied housing units (%)
Renter occupied housing units (%)
Vacancy status - For rent (%)
Vacancy status - For sale only (%)
Vacancy status - Rented or sold, not occupied (%)
Vacancy status - For seasonal, recreational, or occasional use (%)
Vacancy status - For migrant workers (%)
Vacancy status - Other vacant (%)
Residents with income below the poverty level (%)
Residents with income below 50% of the poverty level (%)
Children below poverty level (%)
Poor families by family type - Married-couple family (%)
Poor families by family type - Male, no wife present (%)
Poor families by family type - Female, no husband present (%)
Poverty status for native-born residents (%)
Poverty status for foreign-born residents (%)
Poverty among high school graduates not in families (%)
Poverty among people who did not graduate high school not in families (%)
Residents with income below the poverty level (%) - White
Residents with income below the poverty level (%) - Black or African American
Residents with income below the poverty level (%) - Asian
Residents with income below the poverty level (%) - Hispanic or Latino
Residents with income below the poverty level (%) - American Indian and Alaska Native
Residents with income below the poverty level (%) - Multirace
Residents with income below the poverty level (%) - Other Race
Air pollution - Air Quality Index (AQI)
Air pollution - CO
Air pollution - NO2
Air pollution - SO2
Air pollution - Ozone
Air pollution - PM10
Air pollution - PM25
Air pollution - Pb
Crime - Murders per 100,000 population
Crime - Rapes per 100,000 population
Crime - Robberies per 100,000 population
Crime - Assaults per 100,000 population
Crime - Burglaries per 100,000 population
Crime - Thefts per 100,000 population
Crime - Auto thefts per 100,000 population
Crime - Arson per 100,000 population
Crime - City-data.com crime index
Crime - Violent crime index
Crime - Property crime index
Crime - Murders per 100,000 population (5 year average)
Crime - Rapes per 100,000 population (5 year average)
Crime - Robberies per 100,000 population (5 year average)
Crime - Assaults per 100,000 population (5 year average)
Crime - Burglaries per 100,000 population (5 year average)
Crime - Thefts per 100,000 population (5 year average)
Crime - Auto thefts per 100,000 population (5 year average)
Crime - Arson per 100,000 population (5 year average)
Crime - City-data.com crime index (5 year average)
Crime - Violent crime index (5 year average)
Crime - Property crime index (5 year average)
1996 Presidential Elections Results (%) - Democratic Party (Clinton)
1996 Presidential Elections Results (%) - Republican Party (Dole)
1996 Presidential Elections Results (%) - Other
2000 Presidential Elections Results (%) - Democratic Party (Gore)
2000 Presidential Elections Results (%) - Republican Party (Bush)
2000 Presidential Elections Results (%) - Other
2004 Presidential Elections Results (%) - Democratic Party (Kerry)
2004 Presidential Elections Results (%) - Republican Party (Bush)
2004 Presidential Elections Results (%) - Other
2008 Presidential Elections Results (%) - Democratic Party (Obama)
2008 Presidential Elections Results (%) - Republican Party (McCain)
2008 Presidential Elections Results (%) - Other
2012 Presidential Elections Results (%) - Democratic Party (Obama)
2012 Presidential Elections Results (%) - Republican Party (Romney)
2012 Presidential Elections Results (%) - Other
2016 Presidential Elections Results (%) - Democratic Party (Clinton)
2016 Presidential Elections Results (%) - Republican Party (Trump)
2016 Presidential Elections Results (%) - Other
2020 Presidential Elections Results (%) - Democratic Party (Biden)
2020 Presidential Elections Results (%) - Republican Party (Trump)
2020 Presidential Elections Results (%) - Other
Ancestries Reported - Arab (%)
Ancestries Reported - Czech (%)
Ancestries Reported - Danish (%)
Ancestries Reported - Dutch (%)
Ancestries Reported - English (%)
Ancestries Reported - French (%)
Ancestries Reported - French Canadian (%)
Ancestries Reported - German (%)
Ancestries Reported - Greek (%)
Ancestries Reported - Hungarian (%)
Ancestries Reported - Irish (%)
Ancestries Reported - Italian (%)
Ancestries Reported - Lithuanian (%)
Ancestries Reported - Norwegian (%)
Ancestries Reported - Polish (%)
Ancestries Reported - Portuguese (%)
Ancestries Reported - Russian (%)
Ancestries Reported - Scotch-Irish (%)
Ancestries Reported - Scottish (%)
Ancestries Reported - Slovak (%)
Ancestries Reported - Subsaharan African (%)
Ancestries Reported - Swedish (%)
Ancestries Reported - Swiss (%)
Ancestries Reported - Ukrainian (%)
Ancestries Reported - United States (%)
Ancestries Reported - Welsh (%)
Ancestries Reported - West Indian (%)
Ancestries Reported - Other (%)
Educational Attainment - No schooling completed (%)
Educational Attainment - Less than high school (%)
Educational Attainment - High school or equivalent (%)
Educational Attainment - Less than 1 year of college (%)
Educational Attainment - 1 or more years of college (%)
Educational Attainment - Associate degree (%)
Educational Attainment - Bachelor's degree (%)
Educational Attainment - Master's degree (%)
Educational Attainment - Professional school degree (%)
Educational Attainment - Doctorate degree (%)
School Enrollment - Nursery, preschool (%)
School Enrollment - Kindergarten (%)
School Enrollment - Grade 1 to 4 (%)
School Enrollment - Grade 5 to 8 (%)
School Enrollment - Grade 9 to 12 (%)
School Enrollment - College undergrad (%)
School Enrollment - Graduate or professional (%)
School Enrollment - Not enrolled in school (%)
School enrollment - Public schools (%)
School enrollment - Private schools (%)
School enrollment - Not enrolled (%)
Median number of rooms in houses and condos
Median number of rooms in apartments
Housing units lacking complete plumbing facilities (%)
Housing units lacking complete kitchen facilities (%)
Density of houses
Urban houses (%)
Rural houses (%)
Households with people 60 years and over (%)
Households with people 65 years and over (%)
Households with people 75 years and over (%)
Households with one or more nonrelatives (%)
Households with no nonrelatives (%)
Population in households (%)
Family households (%)
Nonfamily households (%)
Population in families (%)
Family households with own children (%)
Median number of bedrooms in owner occupied houses
Mean number of bedrooms in owner occupied houses
Median number of bedrooms in renter occupied houses
Mean number of bedrooms in renter occupied houses
Median number of vehichles in owner occupied houses
Mean number of vehichles in owner occupied houses
Median number of vehichles in renter occupied houses
Mean number of vehichles in renter occupied houses
Mortgage status - with mortgage (%)
Mortgage status - with second mortgage (%)
Mortgage status - with home equity loan (%)
Mortgage status - with both second mortgage and home equity loan (%)
Mortgage status - without a mortgage (%)
Average family size
Average family size - White
Average family size - Black or African American
Average family size - Asian
Average family size - Hispanic or Latino
Average family size - American Indian and Alaska Native
Average family size - Multirace
Average family size - Other Race
Geographical mobility - Same house 1 year ago (%)
Geographical mobility - Moved within same county (%)
Geographical mobility - Moved from different county within same state (%)
Geographical mobility - Moved from different state (%)
Geographical mobility - Moved from abroad (%)
Place of birth - Born in state of residence (%)
Place of birth - Born in other state (%)
Place of birth - Native, outside of US (%)
Place of birth - Foreign born (%)
Housing units in structures - 1, detached (%)
Housing units in structures - 1, attached (%)
Housing units in structures - 2 (%)
Housing units in structures - 3 or 4 (%)
Housing units in structures - 5 to 9 (%)
Housing units in structures - 10 to 19 (%)
Housing units in structures - 20 to 49 (%)
Housing units in structures - 50 or more (%)
Housing units in structures - Mobile home (%)
Housing units in structures - Boat, RV, van, etc. (%)
House/condo owner moved in on average (years ago)
Renter moved in on average (years ago)
Year householder moved into unit - Moved in 1999 to March 2000 (%)
Year householder moved into unit - Moved in 1995 to 1998 (%)
Year householder moved into unit - Moved in 1990 to 1994 (%)
Year householder moved into unit - Moved in 1980 to 1989 (%)
Year householder moved into unit - Moved in 1970 to 1979 (%)
Year householder moved into unit - Moved in 1969 or earlier (%)
Means of transportation to work - Drove car alone (%)
Means of transportation to work - Carpooled (%)
Means of transportation to work - Public transportation (%)
Means of transportation to work - Bus or trolley bus (%)
Means of transportation to work - Streetcar or trolley car (%)
Means of transportation to work - Subway or elevated (%)
Means of transportation to work - Railroad (%)
Means of transportation to work - Ferryboat (%)
Means of transportation to work - Taxicab (%)
Means of transportation to work - Motorcycle (%)
Means of transportation to work - Bicycle (%)
Means of transportation to work - Walked (%)
Means of transportation to work - Other means (%)
Working at home (%)
Industry diversity
Most Common Industries - Agriculture, forestry, fishing and hunting, and mining (%)
Most Common Industries - Agriculture, forestry, fishing and hunting (%)
Most Common Industries - Mining, quarrying, and oil and gas extraction (%)
Most Common Industries - Construction (%)
Most Common Industries - Manufacturing (%)
Most Common Industries - Wholesale trade (%)
Most Common Industries - Retail trade (%)
Most Common Industries - Transportation and warehousing, and utilities (%)
Most Common Industries - Transportation and warehousing (%)
Most Common Industries - Utilities (%)
Most Common Industries - Information (%)
Most Common Industries - Finance and insurance, and real estate and rental and leasing (%)
Most Common Industries - Finance and insurance (%)
Most Common Industries - Real estate and rental and leasing (%)
Most Common Industries - Professional, scientific, and management, and administrative and waste management services (%)
Most Common Industries - Professional, scientific, and technical services (%)
Most Common Industries - Management of companies and enterprises (%)
Most Common Industries - Administrative and support and waste management services (%)
Most Common Industries - Educational services, and health care and social assistance (%)
Most Common Industries - Educational services (%)
Most Common Industries - Health care and social assistance (%)
Most Common Industries - Arts, entertainment, and recreation, and accommodation and food services (%)
Most Common Industries - Arts, entertainment, and recreation (%)
Most Common Industries - Accommodation and food services (%)
Most Common Industries - Other services, except public administration (%)
Most Common Industries - Public administration (%)
Occupation diversity
Most Common Occupations - Management, business, science, and arts occupations (%)
Most Common Occupations - Management, business, and financial occupations (%)
Most Common Occupations - Management occupations (%)
Most Common Occupations - Business and financial operations occupations (%)
Most Common Occupations - Computer, engineering, and science occupations (%)
Most Common Occupations - Computer and mathematical occupations (%)
Most Common Occupations - Architecture and engineering occupations (%)
Most Common Occupations - Life, physical, and social science occupations (%)
Most Common Occupations - Education, legal, community service, arts, and media occupations (%)
Most Common Occupations - Community and social service occupations (%)
Most Common Occupations - Legal occupations (%)
Most Common Occupations - Education, training, and library occupations (%)
Most Common Occupations - Arts, design, entertainment, sports, and media occupations (%)
Most Common Occupations - Healthcare practitioners and technical occupations (%)
Most Common Occupations - Health diagnosing and treating practitioners and other technical occupations (%)
Most Common Occupations - Health technologists and technicians (%)
Most Common Occupations - Service occupations (%)
Most Common Occupations - Healthcare support occupations (%)
Most Common Occupations - Protective service occupations (%)
Most Common Occupations - Fire fighting and prevention, and other protective service workers including supervisors (%)
Most Common Occupations - Law enforcement workers including supervisors (%)
Most Common Occupations - Food preparation and serving related occupations (%)
Most Common Occupations - Building and grounds cleaning and maintenance occupations (%)
Most Common Occupations - Personal care and service occupations (%)
Most Common Occupations - Sales and office occupations (%)
Most Common Occupations - Sales and related occupations (%)
Most Common Occupations - Office and administrative support occupations (%)
Most Common Occupations - Natural resources, construction, and maintenance occupations (%)
Most Common Occupations - Farming, fishing, and forestry occupations (%)
Most Common Occupations - Construction and extraction occupations (%)
Most Common Occupations - Installation, maintenance, and repair occupations (%)
Most Common Occupations - Production, transportation, and material moving occupations (%)
Most Common Occupations - Production occupations (%)
Most Common Occupations - Transportation occupations (%)
Most Common Occupations - Material moving occupations (%)
People in Group quarters - Institutionalized population (%)
People in Group quarters - Correctional institutions (%)
People in Group quarters - Federal prisons and detention centers (%)
People in Group quarters - Halfway houses (%)
People in Group quarters - Local jails and other confinement facilities (including police lockups) (%)
People in Group quarters - Military disciplinary barracks (%)
People in Group quarters - State prisons (%)
People in Group quarters - Other types of correctional institutions (%)
People in Group quarters - Nursing homes (%)
People in Group quarters - Hospitals/wards, hospices, and schools for the handicapped (%)
People in Group quarters - Hospitals/wards and hospices for chronically ill (%)
People in Group quarters - Hospices or homes for chronically ill (%)
People in Group quarters - Military hospitals or wards for chronically ill (%)
People in Group quarters - Other hospitals or wards for chronically ill (%)
People in Group quarters - Hospitals or wards for drug/alcohol abuse (%)
People in Group quarters - Mental (Psychiatric) hospitals or wards (%)
People in Group quarters - Schools, hospitals, or wards for the mentally retarded (%)
People in Group quarters - Schools, hospitals, or wards for the physically handicapped (%)
People in Group quarters - Institutions for the deaf (%)
People in Group quarters - Institutions for the blind (%)
People in Group quarters - Orthopedic wards and institutions for the physically handicapped (%)
People in Group quarters - Wards in general hospitals for patients who have no usual home elsewhere (%)
People in Group quarters - Wards in military hospitals for patients who have no usual home elsewhere (%)
People in Group quarters - Juvenile institutions (%)
People in Group quarters - Long-term care (%)
People in Group quarters - Homes for abused, dependent, and neglected children (%)
People in Group quarters - Residential treatment centers for emotionally disturbed children (%)
People in Group quarters - Training schools for juvenile delinquents (%)
People in Group quarters - Short-term care, detention or diagnostic centers for delinquent children (%)
People in Group quarters - Type of juvenile institution unknown (%)
People in Group quarters - Noninstitutionalized population (%)
People in Group quarters - College dormitories (includes college quarters off campus) (%)
People in Group quarters - Military quarters (%)
People in Group quarters - On base (%)
People in Group quarters - Barracks, unaccompanied personnel housing (UPH), (Enlisted/Officer), ;and similar group living quarters for military personnel (%)
People in Group quarters - Transient quarters for temporary residents (%)
People in Group quarters - Military ships (%)
People in Group quarters - Group homes (%)
People in Group quarters - Homes or halfway houses for drug/alcohol abuse (%)
People in Group quarters - Homes for the mentally ill (%)
People in Group quarters - Homes for the mentally retarded (%)
People in Group quarters - Homes for the physically handicapped (%)
People in Group quarters - Other group homes (%)
People in Group quarters - Religious group quarters (%)
People in Group quarters - Dormitories (%)
People in Group quarters - Agriculture workers' dormitories on farms (%)
People in Group quarters - Job Corps and vocational training facilities (%)
People in Group quarters - Other workers' dormitories (%)
People in Group quarters - Crews of maritime vessels (%)
People in Group quarters - Other nonhousehold living situations (%)
People in Group quarters - Other noninstitutional group quarters (%)
Residents speaking English at home (%)
Residents speaking English at home - Born in the United States (%)
Residents speaking English at home - Native, born elsewhere (%)
Residents speaking English at home - Foreign born (%)
Residents speaking Spanish at home (%)
Residents speaking Spanish at home - Born in the United States (%)
Residents speaking Spanish at home - Native, born elsewhere (%)
Residents speaking Spanish at home - Foreign born (%)
Residents speaking other language at home (%)
Residents speaking other language at home - Born in the United States (%)
Residents speaking other language at home - Native, born elsewhere (%)
Residents speaking other language at home - Foreign born (%)
Class of Workers - Employee of private company (%)
Class of Workers - Self-employed in own incorporated business (%)
Class of Workers - Private not-for-profit wage and salary workers (%)
Class of Workers - Local government workers (%)
Class of Workers - State government workers (%)
Class of Workers - Federal government workers (%)
Class of Workers - Self-employed workers in own not incorporated business and Unpaid family workers (%)
House heating fuel used in houses and condos - Utility gas (%)
House heating fuel used in houses and condos - Bottled, tank, or LP gas (%)
House heating fuel used in houses and condos - Electricity (%)
House heating fuel used in houses and condos - Fuel oil, kerosene, etc. (%)
House heating fuel used in houses and condos - Coal or coke (%)
House heating fuel used in houses and condos - Wood (%)
House heating fuel used in houses and condos - Solar energy (%)
House heating fuel used in houses and condos - Other fuel (%)
House heating fuel used in houses and condos - No fuel used (%)
House heating fuel used in apartments - Utility gas (%)
House heating fuel used in apartments - Bottled, tank, or LP gas (%)
House heating fuel used in apartments - Electricity (%)
House heating fuel used in apartments - Fuel oil, kerosene, etc. (%)
House heating fuel used in apartments - Coal or coke (%)
House heating fuel used in apartments - Wood (%)
House heating fuel used in apartments - Solar energy (%)
House heating fuel used in apartments - Other fuel (%)
House heating fuel used in apartments - No fuel used (%)
Armed forces status - In Armed Forces (%)
Armed forces status - Civilian (%)
Armed forces status - Civilian - Veteran (%)
Armed forces status - Civilian - Nonveteran (%)
Fatal accidents locations in years 2005-2021
Fatal accidents locations in 2005
Fatal accidents locations in 2006
Fatal accidents locations in 2007
Fatal accidents locations in 2008
Fatal accidents locations in 2009
Fatal accidents locations in 2010
Fatal accidents locations in 2011
Fatal accidents locations in 2012
Fatal accidents locations in 2013
Fatal accidents locations in 2014
Fatal accidents locations in 2015
Fatal accidents locations in 2016
Fatal accidents locations in 2017
Fatal accidents locations in 2018
Fatal accidents locations in 2019
Fatal accidents locations in 2020
Fatal accidents locations in 2021
Alcohol use - People drinking some alcohol every month (%)
Alcohol use - People not drinking at all (%)
Alcohol use - Average days/month drinking alcohol
Alcohol use - Average drinks/week
Alcohol use - Average days/year people drink much
Audiometry - Average condition of hearing (%)
Audiometry - People that can hear a whisper from across a quiet room (%)
Audiometry - People that can hear normal voice from across a quiet room (%)
Audiometry - Ears ringing, roaring, buzzing (%)
Audiometry - Had a job exposure to loud noise (%)
Audiometry - Had off-work exposure to loud noise (%)
Blood Pressure & Cholesterol - Has high blood pressure (%)
Blood Pressure & Cholesterol - Checking blood pressure at home (%)
Blood Pressure & Cholesterol - Frequently checking blood cholesterol (%)
Blood Pressure & Cholesterol - Has high cholesterol level (%)
Consumer Behavior - Money monthly spent on food at supermarket/grocery store
Consumer Behavior - Money monthly spent on food at other stores
Consumer Behavior - Money monthly spent on eating out
Consumer Behavior - Money monthly spent on carryout/delivered foods
Consumer Behavior - Income spent on food at supermarket/grocery store (%)
Consumer Behavior - Income spent on food at other stores (%)
Consumer Behavior - Income spent on eating out (%)
Consumer Behavior - Income spent on carryout/delivered foods (%)
Current Health Status - General health condition (%)
Current Health Status - Blood donors (%)
Current Health Status - Has blood ever tested for HIV virus (%)
Current Health Status - Left-handed people (%)
Dermatology - People using sunscreen (%)
Diabetes - Diabetics (%)
Diabetes - Had a blood test for high blood sugar (%)
Diabetes - People taking insulin (%)
Diet Behavior & Nutrition - Diet health (%)
Diet Behavior & Nutrition - Milk product consumption (# of products/month)
Diet Behavior & Nutrition - Meals not home prepared (#/week)
Diet Behavior & Nutrition - Meals from fast food or pizza place (#/week)
Diet Behavior & Nutrition - Ready-to-eat foods (#/month)
Diet Behavior & Nutrition - Frozen meals/pizza (#/month)
Drug Use - People that ever used marijuana or hashish (%)
Drug Use - Ever used hard drugs (%)
Drug Use - Ever used any form of cocaine (%)
Drug Use - Ever used heroin (%)
Drug Use - Ever used methamphetamine (%)
Health Insurance - People covered by health insurance (%)
Kidney Conditions-Urology - Avg. # of times urinating at night
Medical Conditions - People with asthma (%)
Medical Conditions - People with anemia (%)
Medical Conditions - People with psoriasis (%)
Medical Conditions - People with overweight (%)
Medical Conditions - Elderly people having difficulties in thinking or remembering (%)
Medical Conditions - People who ever received blood transfusion (%)
Medical Conditions - People having trouble seeing even with glass/contacts (%)
Medical Conditions - People with arthritis (%)
Medical Conditions - People with gout (%)
Medical Conditions - People with congestive heart failure (%)
Medical Conditions - People with coronary heart disease (%)
Medical Conditions - People with angina pectoris (%)
Medical Conditions - People who ever had heart attack (%)
Medical Conditions - People who ever had stroke (%)
Medical Conditions - People with emphysema (%)
Medical Conditions - People with thyroid problem (%)
Medical Conditions - People with chronic bronchitis (%)
Medical Conditions - People with any liver condition (%)
Medical Conditions - People who ever had cancer or malignancy (%)
Mental Health - People who have little interest in doing things (%)
Mental Health - People feeling down, depressed, or hopeless (%)
Mental Health - People who have trouble sleeping or sleeping too much (%)
Mental Health - People feeling tired or having little energy (%)
Mental Health - People with poor appetite or overeating (%)
Mental Health - People feeling bad about themself (%)
Mental Health - People who have trouble concentrating on things (%)
Mental Health - People moving or speaking slowly or too fast (%)
Mental Health - People having thoughts they would be better off dead (%)
Oral Health - Average years since last visit a dentist
Oral Health - People embarrassed because of mouth (%)
Oral Health - People with gum disease (%)
Oral Health - General health of teeth and gums (%)
Oral Health - Average days a week using dental floss/device
Oral Health - Average days a week using mouthwash for dental problem
Oral Health - Average number of teeth
Pesticide Use - Households using pesticides to control insects (%)
Pesticide Use - Households using pesticides to kill weeds (%)
Physical Activity - People doing vigorous-intensity work activities (%)
Physical Activity - People doing moderate-intensity work activities (%)
Physical Activity - People walking or bicycling (%)
Physical Activity - People doing vigorous-intensity recreational activities (%)
Physical Activity - People doing moderate-intensity recreational activities (%)
Physical Activity - Average hours a day doing sedentary activities
Physical Activity - Average hours a day watching TV or videos
Physical Activity - Average hours a day using computer
Physical Functioning - People having limitations keeping them from working (%)
Physical Functioning - People limited in amount of work they can do (%)
Physical Functioning - People that need special equipment to walk (%)
Physical Functioning - People experiencing confusion/memory problems (%)
Physical Functioning - People requiring special healthcare equipment (%)
Prescription Medications - Average number of prescription medicines taking
Preventive Aspirin Use - Adults 40+ taking low-dose aspirin (%)
Reproductive Health - Vaginal deliveries (%)
Reproductive Health - Cesarean deliveries (%)
Reproductive Health - Deliveries resulted in a live birth (%)
Reproductive Health - Pregnancies resulted in a delivery (%)
Reproductive Health - Women breastfeeding newborns (%)
Reproductive Health - Women that had a hysterectomy (%)
Reproductive Health - Women that had both ovaries removed (%)
Reproductive Health - Women that have ever taken birth control pills (%)
Reproductive Health - Women taking birth control pills (%)
Reproductive Health - Women that have ever used Depo-Provera or injectables (%)
Reproductive Health - Women that have ever used female hormones (%)
Sexual Behavior - People 18+ that ever had sex (vaginal, anal, or oral) (%)
Sexual Behavior - Males 18+ that ever had vaginal sex with a woman (%)
Sexual Behavior - Males 18+ that ever performed oral sex on a woman (%)
Sexual Behavior - Males 18+ that ever had anal sex with a woman (%)
Sexual Behavior - Males 18+ that ever had any sex with a man (%)
Sexual Behavior - Females 18+ that ever had vaginal sex with a man (%)
Sexual Behavior - Females 18+ that ever performed oral sex on a man (%)
Sexual Behavior - Females 18+ that ever had anal sex with a man (%)
Sexual Behavior - Females 18+ that ever had any kind of sex with a woman (%)
Sexual Behavior - Average age people first had sex
Sexual Behavior - Average number of female sex partners in lifetime (males 18+)
Sexual Behavior - Average number of female vaginal sex partners in lifetime (males 18+)
Sexual Behavior - Average age people first performed oral sex on a woman (18+)
Sexual Behavior - Average number of woman performed oral sex on in lifetime (18+)
Sexual Behavior - Average number of male sex partners in lifetime (males 18+)
Sexual Behavior - Average number of male anal sex partners in lifetime (males 18+)
Sexual Behavior - Average age people first performed oral sex on a man (18+)
Sexual Behavior - Average number of male oral sex partners in lifetime (18+)
Sexual Behavior - People using protection when performing oral sex (%)
Sexual Behavior - Average number of times people have vaginal or anal sex a year
Sexual Behavior - People having sex without condom (%)
Sexual Behavior - Average number of male sex partners in lifetime (females 18+)
Sexual Behavior - Average number of male vaginal sex partners in lifetime (females 18+)
Sexual Behavior - Average number of female sex partners in lifetime (females 18+)
Sexual Behavior - Circumcised males 18+ (%)
Sleep Disorders - Average hours sleeping at night
Sleep Disorders - People that has trouble sleeping (%)
Smoking-Cigarette Use - People smoking cigarettes (%)
Taste & Smell - People 40+ having problems with smell (%)
Taste & Smell - People 40+ having problems with taste (%)
Taste & Smell - People 40+ that ever had wisdom teeth removed (%)
Taste & Smell - People 40+ that ever had tonsils teeth removed (%)
Taste & Smell - People 40+ that ever had a loss of consciousness because of a head injury (%)
Taste & Smell - People 40+ that ever had a broken nose or other serious injury to face or skull (%)
Taste & Smell - People 40+ that ever had two or more sinus infections (%)
Weight - Average height (inches)
Weight - Average weight (pounds)
Weight - Average BMI
Weight - People that are obese (%)
Weight - People that ever were obese (%)
Weight - People trying to lose weight (%)
Urban population: 31,102
Rural population: 24,063
Estimated median house/condo value in 2022: $359,432
34746:
$359,432Florida:
$354,100
Median resident age: This zip code:
38.4 yearsFlorida median age:
42.7 years
Average household size: This zip code:
3.2 peopleFlorida:
2.5 people
Averages for the 2020 tax year for zip code 34746, filed in 2021:
Average Adjusted Gross Income (AGI) in 2020: $41,830 (Individual Income Tax Returns) Here:
$41,830State:
$82,200
Salary/wage: $36,685 (reported on 81.3% of returns )Here:
$36,685State:
$58,347
(% of AGI for various income ranges: 1122.0% for AGIs below $25k , 3294.4% for AGIs $25k-50k , 6224.9% for AGIs $50k-75k , 9245.4% for AGIs $75k-100k , 16143.8% for AGIs $100k-200k , 59694.2% for AGIs over 200k ) Taxable interest for individuals: $1,243 (reported on 13.2% of returns )This zip code:
$1,243Florida:
$4,272
(% of AGI for various income ranges: 7.1% for AGIs below $25k , 8.6% for AGIs $25k-50k , 21.2% for AGIs $50k-75k , 40.2% for AGIs $75k-100k , 129.0% for AGIs $100k-200k , 899.2% for AGIs over 200k ) Ordinary dividends: $4,145 (reported on 7.9% of returns )(% of AGI for various income ranges: 6.9% for AGIs below $25k , 11.4% for AGIs $25k-50k , 32.6% for AGIs $50k-75k , 84.7% for AGIs $75k-100k , 296.7% for AGIs $100k-200k , 2640.8% for AGIs over 200k ) Net capital gain/loss in AGI: +$11,990 (reported on 8.1% of returns )Here:
+$11,990State:
+$62,983
(% of AGI for various income ranges: 3.3% for AGIs below $25k , 12.9% for AGIs $25k-50k , 69.2% for AGIs $50k-75k , 154.2% for AGIs $75k-100k , 698.2% for AGIs $100k-200k , 13790.8% for AGIs over 200k ) Profit/loss from business: +$6,167 (reported on 25.5% of returns )Here:
+$6,167State:
+$9,719
(% of AGI for various income ranges: 193.5% for AGIs below $25k , 144.1% for AGIs $25k-50k , 171.5% for AGIs $50k-75k , 258.1% for AGIs $75k-100k , 439.7% for AGIs $100k-200k , 2867.5% for AGIs over 200k ) Taxable individual retirement arrangement distribution: $17,715 (reported on 3.9% of returns )34746:
$17,715Florida:
$24,823
(% of AGI for various income ranges: 17.8% for AGIs below $25k , 37.5% for AGIs $25k-50k , 97.8% for AGIs $50k-75k , 221.7% for AGIs $75k-100k , 572.2% for AGIs $100k-200k , 3735.0% for AGIs over 200k ) Self-employed (Keogh) retirement plans: $21,050 (reported on 0.1% of returns )34746:
$21,050Florida:
$29,694
(% of AGI for various income ranges: 33.7% for AGIs $75k-100k ) Total itemized deductions: $30,686 (reported on 5.3% of returns )Here:
$30,686State:
$45,393
(% of AGI for various income ranges: 22.5% for AGIs below $25k , 134.6% for AGIs $25k-50k , 381.6% for AGIs $50k-75k , 555.1% for AGIs $75k-100k , 1039.6% for AGIs $100k-200k , 6380.8% for AGIs over 200k ) Charity contributions: $8,238 (reported on 4.0% of returns )(% of AGI for various income ranges: 1.5% for AGIs below $25k , 15.7% for AGIs $25k-50k , 58.4% for AGIs $50k-75k , 115.3% for AGIs $75k-100k , 251.5% for AGIs $100k-200k , 2268.3% for AGIs over 200k ) Taxes paid: $6,708 (reported on 5.1% of returns )(% of AGI for various income ranges: 5.6% for AGIs below $25k , 31.2% for AGIs $25k-50k , 86.7% for AGIs $50k-75k , 131.8% for AGIs $75k-100k , 226.6% for AGIs $100k-200k , 767.5% for AGIs over 200k ) Earned income credit: $2,500 (reported on 28.7% of returns )(% of AGI for various income ranges: 136.7% for AGIs below $25k , 94.0% for AGIs $25k-50k , 1.6% for AGIs $50k-75k ) Percentage of individuals using paid preparers for their 2020 taxes: 92.9%(% for various income ranges: 92.1% for AGIs below $25k , 94.1% for AGIs $25k-50k , 93.1% for AGIs $50k-75k , 92.9% for AGIs $75k-100k , 92.8% for AGIs $100k-200k , 92.1% for AGIs over 200k )
Averages for the 2012 tax year for zip code 34746, filed in 2013:
Average Adjusted Gross Income (AGI) in 2012: $35,512 (Individual Income Tax Returns) Here:
$35,512State:
$60,316
Salary/wage: $31,942 (reported on 83.6% of returns )Here:
$31,942State:
$45,277
(% of AGI for various income ranges: 78.6% for AGIs below $25k , 82.0% for AGIs $25k-50k , 79.3% for AGIs $50k-75k , 74.6% for AGIs $75k-100k , 71.7% for AGIs $100k-200k , 45.9% for AGIs over 200k ) Taxable interest for individuals: $1,244 (reported on 17.8% of returns )This zip code:
$1,244Florida:
$3,587
(% of AGI for various income ranges: 0.7% for AGIs below $25k , 0.5% for AGIs $25k-50k , 0.6% for AGIs $50k-75k , 0.8% for AGIs $75k-100k , 0.6% for AGIs $100k-200k , 0.7% for AGIs over 200k ) Ordinary dividends: $5,231 (reported on 10.5% of returns )(% of AGI for various income ranges: 1.1% for AGIs below $25k , 2.3% for AGIs $25k-50k , 0.7% for AGIs $50k-75k , 1.1% for AGIs $75k-100k , 1.4% for AGIs $100k-200k , 2.8% for AGIs over 200k ) Net capital gain/loss in AGI: +$5,887 (reported on 6.6% of returns )Here:
+$5,887State:
+$33,493
(% of AGI for various income ranges: 0.2% for AGIs $25k-50k , 0.3% for AGIs $50k-75k , 0.6% for AGIs $75k-100k , 1.6% for AGIs $100k-200k , 7.8% for AGIs over 200k ) Profit/loss from business: +$6,616 (reported on 19.0% of returns )Here:
+$6,616State:
+$10,012
(% of AGI for various income ranges: 10.8% for AGIs below $25k , 1.8% for AGIs $25k-50k , 1.1% for AGIs $50k-75k , 1.3% for AGIs $75k-100k , 1.8% for AGIs $100k-200k , 3.1% for AGIs over 200k ) Taxable individual retirement arrangement distribution: $16,576 (reported on 5.2% of returns )34746:
$16,576Florida:
$21,544
(% of AGI for various income ranges: 1.3% for AGIs below $25k , 1.3% for AGIs $25k-50k , 2.1% for AGIs $50k-75k , 3.4% for AGIs $75k-100k , 4.0% for AGIs $100k-200k , 4.8% for AGIs over 200k ) Total itemized deductions: $19,534 (27% of AGI, reported on 18.6% of returns )Here:
$19,534State:
$25,533
Here:
27.5% of AGIState:
18.0% of AGI
(% of AGI for various income ranges: 6.5% for AGIs below $25k , 10.1% for AGIs $25k-50k , 11.6% for AGIs $50k-75k , 12.1% for AGIs $75k-100k , 12.2% for AGIs $100k-200k , 10.6% for AGIs over 200k ) Charity contributions: $3,241 (reported on 13.7% of returns )(% of AGI for various income ranges: 0.4% for AGIs below $25k , 1.0% for AGIs $25k-50k , 1.5% for AGIs $50k-75k , 1.7% for AGIs $75k-100k , 1.9% for AGIs $100k-200k , 1.3% for AGIs over 200k ) Taxes paid: $3,879 (reported on 17.8% of returns )(% of AGI for various income ranges: 0.9% for AGIs below $25k , 1.5% for AGIs $25k-50k , 2.3% for AGIs $50k-75k , 2.4% for AGIs $75k-100k , 2.7% for AGIs $100k-200k , 2.9% for AGIs over 200k ) Earned income credit: $2,680 (reported on 32.1% of returns )(% of AGI for various income ranges: 10.1% for AGIs below $25k , 1.6% for AGIs $25k-50k ) Percentage of individuals using paid preparers for their 2012 taxes: 53.4%(% for various income ranges: 53.8% for AGIs below $25k , 50.5% for AGIs $25k-50k , 53.6% for AGIs $50k-75k , 55.8% for AGIs $75k-100k , 56.8% for AGIs $100k-200k , 75.0% for AGIs over 200k )
Averages for the 2004 tax year for zip code 34746, filed in 2005:
Average Adjusted Gross Income (AGI) in 2004: $35,670 (Individual Income Tax Returns) Here:
$35,670State:
$50,523
Salary/wage: $32,412 (reported on 85.4% of returns )Here:
$32,412State:
$39,563
(% of AGI for various income ranges: 123.3% for AGIs below $10k , 80.8% for AGIs $10k-25k , 83.7% for AGIs $25k-50k , 81.2% for AGIs $50k-75k , 79.5% for AGIs $75k-100k , 61.3% for AGIs over 100k ) Taxable interest for individuals: $1,328 (reported on 34.1% of returns )This zip code:
$1,328Florida:
$3,211
(% of AGI for various income ranges: 4.8% for AGIs below $10k , 1.5% for AGIs $10k-25k , 1.1% for AGIs $25k-50k , 1.0% for AGIs $50k-75k , 0.9% for AGIs $75k-100k , 1.5% for AGIs over 100k ) Taxable dividends: $1,939 (reported on 15.5% of returns )(% of AGI for various income ranges: 5.1% for AGIs below $10k , 0.9% for AGIs $10k-25k , 0.7% for AGIs $25k-50k , 0.7% for AGIs $50k-75k , 0.6% for AGIs $75k-100k , 0.9% for AGIs over 100k ) Net capital gain/loss: +$12,824 (reported on 12.7% of returns )Here:
+$12,824State:
+$27,205
(% of AGI for various income ranges: -0.3% for AGIs below $10k , 0.3% for AGIs $10k-25k , 0.8% for AGIs $25k-50k , 1.6% for AGIs $50k-75k , 3.5% for AGIs $75k-100k , 14.6% for AGIs over 100k ) Profit/loss from business: +$7,213 (reported on 15.3% of returns )Here:
+$7,213State:
+$10,634
(% of AGI for various income ranges: 10.7% for AGIs below $10k , 6.6% for AGIs $10k-25k , 2.4% for AGIs $25k-50k , 1.9% for AGIs $50k-75k , 2.4% for AGIs $75k-100k , 2.4% for AGIs over 100k ) IRA payment deduction: $2,784 (reported on 2.1% of returns )34746:
$2,784Florida:
$3,082
(% of AGI for various income ranges: 0.2% for AGIs $10k-25k , 0.2% for AGIs $25k-50k , 0.2% for AGIs $50k-75k , 0.1% for AGIs $75k-100k , 0.1% for AGIs over 100k ) Total itemized deductions: $18,317 (30% of AGI, reported on 31.2% of returns )Here:
$18,317State:
$20,370
Here:
29.6% of AGIState:
20.7% of AGI
(% of AGI for various income ranges: 15.8% for AGIs below $10k , 12.0% for AGIs $10k-25k , 18.9% for AGIs $25k-50k , 18.1% for AGIs $50k-75k , 16.7% for AGIs $75k-100k , 13.3% for AGIs over 100k ) Charity contributions deductions: $3,055 (5% of AGI, reported on 25.3% of returns )Here:
4.7% of AGIState:
3.8% of AGI
(% of AGI for various income ranges: 0.7% for AGIs below $10k , 1.0% for AGIs $10k-25k , 1.8% for AGIs $25k-50k , 2.0% for AGIs $50k-75k , 2.4% for AGIs $75k-100k , 3.4% for AGIs over 100k ) Total tax: $4,588 (reported on 69.6% of returns )(% of AGI for various income ranges: 4.1% for AGIs below $10k , 3.8% for AGIs $10k-25k , 5.7% for AGIs $25k-50k , 7.8% for AGIs $50k-75k , 9.9% for AGIs $75k-100k , 16.5% for AGIs over 100k ) Earned income credit: $1,906 (reported on 21.8% of returns )Percentage of individuals using paid preparers for their 2004 taxes: 59.0%(% for various income ranges: 55.6% for AGIs below $10k , 61.0% for AGIs $10k-25k , 58.5% for AGIs $25k-50k , 57.9% for AGIs $50k-75k , 57.9% for AGIs $75k-100k , 67.4% for AGIs over 100k )
Estimated median household income in 2022: This zip code:
$66,497Florida:
$69,303
Nearest zip codes: 34758 ,
34741 ,
33848 ,
34743 ,
34744 ,
34759 .
Kissimmee Zip Code Map
Percentage of family households: This zip code:
49.6%Florida:
41.2%
Percentage of households with unmarried partners: This zip code:
5.5%Florida:
46.7%
Likely homosexual households (counted as self-reported same-sex unmarried-partner households)
Lesbian couples: 0.0% of all households Gay men: 0.2% of all households
Household received Food Stamps/SNAP in the past 12 months: 2,804Household did not receive Food Stamps/SNAP in the past 12 months: 14,412
Women who had a birth in the past 12 months: 433 (296 now married , 138 unmarried) Women who did not have a birth in the past 12 months: 12,584 (5,130 now married , 7,454 unmarried)
Housing units in zip code 34746 with a mortgage: 7,641 (611
second mortgage , 7
home equity loan , 442
both second mortgage and home equity loan )
Houses without a mortgage: 116
Median monthly owner costs for units with a mortgage: $1,810
Median monthly owner costs for units without a mortgage: $613
Residents with income below the poverty level in 2022:
This zip code:
12.6%Whole state:
12.7%
Residents with income below 50% of the poverty level in 2022:
This zip code:
5.3%Whole state:
6.6%
Median number of rooms in houses and condos: Median number of rooms in apartments:
Year house built (houses)
423 2020 or later6,137 2010 to 20199,000 2000 to 20094,736 1990 to 19993,789 1980 to 19891,072 1970 to 1979242 1960 to 196986 1950 to 195956 1940 to 194985 1939 or earlier
Zip code 34746 household income distribution in 2022 1,052 Less than $10,000665 $10,000 to $14,999489 $15,000 to $19,999606 $20,000 to $24,999685 $25,000 to $29,999701 $30,000 to $34,9991,069 $35,000 to $39,999478 $40,000 to $44,999818 $45,000 to $49,9991,238 $50,000 to $59,9992,199 $60,000 to $74,9992,474 $75,000 to $99,9991,240 $100,000 to $124,9991,080 $125,000 to $149,9991,046 $150,000 to $199,9991,358 $200,000 or moreEstimate of home value of owner-occupied houses/condos in 2022 in zip code 34746 181 Less than $10,00073 $10,000 to $14,99913 $15,000 to $19,99937 $20,000 to $24,99944 $25,000 to $29,999257 $30,000 to $34,99943 $35,000 to $39,999259 $40,000 to $49,999164 $50,000 to $59,999200 $60,000 to $69,999190 $70,000 to $79,999152 $80,000 to $89,99913 $90,000 to $99,99995 $100,000 to $124,99968 $125,000 to $149,999184 $150,000 to $174,999143 $175,000 to $199,9991,306 $200,000 to $249,9991,685 $250,000 to $299,9994,348 $300,000 to $399,9991,763 $400,000 to $499,999789 $500,000 to $749,999116 $750,000 to $999,99975 $1,000,000 to $1,499,99926 $1,500,000 to $1,999,999195 $2,000,000 or moreRent paid by renters in 2022 in zip code 34746 129 $500 to $54911 $550 to $59934 $600 to $649175 $650 to $69929 $700 to $74967 $750 to $79988 $800 to $899151 $900 to $999934 $1,000 to $1,249578 $1,250 to $1,4991,685 $1,500 to $1,999605 $2,000 to $2,49914 $2,500 to $2,999311 No cash rent
Median gross rent in 2022: $1,735.
Median price asked for vacant for-sale houses and condos in 2022: $192,923.
Estimated median house (or condo) value in 2022 for: White Non-Hispanic householders: $500,046Black or African American householders: $429,363Asian householders: $407,556Some other race householders: $366,575Two or more races householders: $439,514Hispanic or Latino householders: $448,914Estimated median house or condo value in 2022: $359,432
34746:
$359,432Florida:
$354,100
Lower value quartile - upper value quartile: $264,637 - $446,059
Mean price in 2022: Detached houses: $257,248Here:
$257,248State:
$500,941
Townhouses or other attached units: $114,636Here:
$114,636State:
$370,869
In 3-to-4-unit structures: $294,312Here:
$294,312State:
$309,944
In 5-or-more-unit structures: $53,813Here:
$53,813State:
$447,145
Mobile homes: $130,994Here:
$130,994State:
$113,202
Housing units in structures:
One, detached: 15,031One, attached: 2,771Two: 753 or 4: 7315 to 9: 1,54010 to 19: 81920 to 49: 37250 or more: 448Mobile homes: 3,339Boats, RVs, vans, etc.: 37Unemployment : 3.9%
Means of transportation to work in zip code 34746 68.4% 17,615 Drove a car alone10.9% 2,816 Carpooled0.4% 113 Bus or trolley bus0.0% 7 Railroad0.5% 129 Taxi0.7% 172 Motorcycle1.1% 274 Walked1.4% 366 Other means16.7% 4,299 Worked at homeTravel time to work (commute) in zip code 34746 575 Less than 5 minutes1,147 5 to 9 minutes1,992 10 to 14 minutes1,773 15 to 19 minutes2,267 20 to 24 minutes1,500 25 to 29 minutes3,342 30 to 34 minutes752 35 to 39 minutes1,072 40 to 44 minutes3,801 45 to 59 minutes2,691 60 to 89 minutes549 90 or more minutes
Percentage of zip code residents living and working in this county: 59.3%
Household type by relationship:
Households: 55,166
Male householders: 8,927 (1,976 living alone ), Female householders: 8,327 (1,593 living alone )8,702 spouses (8,613 opposite-sex spouses ), 1,455 unmarried partners , (1,364 opposite-sex unmarried partners ), 19,012 children (17,919 natural , 195 adopted , 885 stepchildren ), 1,187 grandchildren , 1,328 brothers or sisters , 2,389 parents , 10 foster children , 1,469 other relatives , 1,620 non-relatives In group quarters: 201 (-1 institutionalized population )
Size of family households: 5,081 2-persons , 3,037 3-persons , 2,266 4-persons , 1,214 5-persons , 729 6-persons , 347 7-or-more-persons
Size of nonfamily households: 3,564 1-person , 819 2-persons , 61 3-persons , 118 4-persons , 51 5-persons
7,464 married couples with children. single-parent households (718 men , 3,414 women ).
42.0% of residents of 34746 zip code speak English at home. of residents speak Spanish at home (61% very well, 18% well, 15% not well, 5% not at all ).of residents speak other Indo-European language at home (53% very well, 31% well, 10% not well, 7% not at all ).of residents speak Asian or Pacific Island language at home (85% very well, 11% well, 5% not well ).of residents speak other language at home (78% very well, 15% well, 4% not well, 3% not at all ).
Foreign born population: 15,790 (28.6%)
(56.1%
of them are naturalized citizens )
This zip code:
28.6%Whole state:
21.7%
18% Uruguay 9% Chile 8% Bolivia 6% Dominica 5% Honduras 5% Grenada 4% Malaysia 4% American 4% Haitian 3% Jamaican 3% Iraqi 3% German 2% Irish 2% Moroccan
Year of entry for the foreign-born population
11,535 2010 or later 4,614 2000 to 2009 4,330 1990 to 1999 5,833 Before 1990
There are
54 Medical Specialists in Zip Code 34746 .
Major facilities with environmental interests located in this zip code:
HORIZON MIDDLE SCHOOL (2020 HAM BROWN ROAD in KISSIMMEE, FL)
(National Center for Education Statistics) - STATE ID-0341 Organizations: OSCEOLA COUNTY SCHOOL DISTRICT (SCHOOL DISTRICT)
PLEASANT HILL ELEMENTARY SCHOOL (1253 PLEASANT HILL ROAD in KISSIMMEE, FL)
(National Center for Education Statistics) - STATE ID-0811 Organizations: OSCEOLA COUNTY SCHOOL DISTRICT (SCHOOL DISTRICT)
7-11 #29728 (IW) (5085 WEST IRLO BRONSON HIGHWAY in KISSIMMEE, FL)
National Pollutant Discharge Elimination System NON-MAJOR (Tracking pollutant discharge elimination systems) - permit Organizations: WILLO SMITH (CONTACT/OWNER)
ALCO AUTO SALVAGE CORP (4412 ALLAN ST in KISSIMMEE, FL)
National Pollutant Discharge Elimination System NON-MAJOR (Tracking pollutant discharge elimination systems) - permit Conditionally Exempt Small Quantity Generators, less than 100 kg/month of hazardous waste (Resource Conservation and Recovery Act (tracking hazardous waste)) Organizations: GERTRUDIS DUARTE (CONTACT/OWNER)
SOUTHPORT ROAD LANDFILL FINAL (4400 HUNT ROAD in KISSIMMEE, FL)
National Pollutant Discharge Elimination System NON-MAJOR (Tracking pollutant discharge elimination systems) - permit Organizations: EARL HOLMES (CONTACT/OWNER)
OVEROAKS DEVELOPMENT LTD (THE OAKS BLVD in KISSIMMEE, FL)
National Pollutant Discharge Elimination System NON-MAJOR (Tracking pollutant discharge elimination systems) - permit Organizations: GARRICK DELONY (CONTACT/OWNER)
SOUTHPORT RD. CLASS I LANDFILL (4400 HUNT RD. in KISSIMMEE, FL)
National Pollutant Discharge Elimination System NON-MAJOR (Tracking pollutant discharge elimination systems) - permit Business SIC classification: REFUSE SYSTEMSOrganizations: DANIEL SHEAFFER (CONTACT/OWNER)
CUMBERLAND FARMS #1088 IW (4521 ORANGE BLOSSOM TRAIL in KISSIMMEE, FL)
National Pollutant Discharge Elimination System NON-MAJOR (Tracking pollutant discharge elimination systems) - permit Small Quantity Generators, between 100 kg and 1000 kg of hazardous waste/month (Resource Conservation and Recovery Act (tracking hazardous waste)) - notification Organizations: JOYCE SCHULTZ, DEALER (CONTACT/OWNER)
LITTLE CREEK (US 192 & HAM BROWN RD in KISSIMMEE, FL)
National Pollutant Discharge Elimination System NON-MAJOR (Tracking pollutant discharge elimination systems) - permit Organizations: MATT CALL (CONTACT/OWNER)
ARABIAN NIGHTS (6225 W IRLO BRONSON MEMORIAL H in KISSIMMEE, FL)
(Resource Conservation and Recovery Act (tracking hazardous waste)) Organizations: NON-NOTIFIER (CONTACT/OWNER)
CONCORDE ESTATES PHASE II (PLEASANT HILL RD in KISSIMMEE, FL)
National Pollutant Discharge Elimination System NON-MAJOR (Tracking pollutant discharge elimination systems) - permit Organizations: JEFFREY NEWTON (CONTACT/OWNER)
Alternative names: CARRIAGE HOMES
GOOD SAMARITAN VILLAGE LIVING (PLEASANT HILL ROAD AND U S HIG in KISSIMMEE, FL)
National Pollutant Discharge Elimination System NON-MAJOR (Tracking pollutant discharge elimination systems) - permit Organizations: KIM OTTEN (CONTACT/OWNER)
INDIAN POINTE COMMERCIAL ( in KISSIMMEE, FL)
National Pollutant Discharge Elimination System NON-MAJOR (Tracking pollutant discharge elimination systems) - permit Organizations: HOUSHANG SABETI (CONTACT/OWNER)
Housing units lacking complete plumbing facilities: 0.2%
Housing units lacking complete kitchen facilities: 0.4%
91.6% Electricity 3.7% Utility gas 2.2% No fuel used 1.6% Solar energy 0.6% Bottled, tank, or LP gas
Population in 1990: 12,922. Population change in the 1990s: +5,095 (+39.4%).
Place of birth for U.S.-born residents:
This state: 10,939Northeast: 10,159Midwest: 4,065South: 3,158West: 1,433
49% of the 34746 zip code residents lived in the same house 5 years ago.
Out of people who lived in different houses, 44% lived in this county.
Out of people who lived in different counties, 50% lived in Florida.
90% of the 34746 zip code residents lived in the same house 1 year ago.
Out of people who lived in different houses, 28% moved from this county.
Out of people who lived in different houses, 26% moved from different county within same state.
Out of people who lived in different houses, 29% moved from different state.
Out of people who lived in different houses, 27% moved from abroad.
Private vs. public school enrollment:
Students in private schools in grades 1 to 8 (elementary and middle school): 827
Students in private schools in grades 9 to 12 (high school): 171
Students in private undergraduate colleges: 412
Occupation by median earnings in the past 12 months ($)
84,247 Computer and mathematical occupations 83,467 Architecture and engineering occupations 69,999 Management occupations 66,634 Health diagnosing and treating practitioners and other technical occupations 50,801 Business and financial operations occupations 49,953 Production occupations
Top industries in this zip code by the number of employees in 2005:
Accommodation and Food Services: Full-Service Restaurants (100-249 employees: 5 establishments, 50-99 employees: 12 establishments, 20-49 employees: 8 establishments, 10-19 employees: 7 establishments, 5-9 employees: 6 establishments, 1-4 employees: 5 establishments)Accommodation and Food Services: Hotels (except Casino Hotels) and Motels (100-249: 2, 50-99: 6, 20-49: 12, 10-19: 3, 5-9: 9, 1-4: 23)Accommodation and Food Services: Limited-Service Restaurants (50-99: 2, 20-49: 15, 10-19: 6, 5-9: 2, 1-4: 7)Real Estate and Rental and Leasing: Offices of Real Estate Agents and Brokers (250-499: 1, 50-99: 2, 10-19: 2, 5-9: 1, 1-4: 30)Professional, Scientific, and Technical Services: Marketing Consulting Services (250-499: 1, 20-49: 1, 1-4: 5)Health Care and Social Assistance: Nursing Care Facilities (250-499: 1)Arts, Entertainment, and Recreation: Golf Courses and Country Clubs (100-249: 1, 20-49: 1, 1-4: 1)
People in group quarters in 2010:
156 people in nursing facilities/skilled-nursing facilities
6 people in group homes intended for adults
People in group quarters in 2000:
153 people in nursing homes
Fatal accident statistics in 2014:
Fatal accident count: 11Vehicles involved in fatal accidents: 17Fatal accidents caused by drunken drivers: 0Fatalities: 11Persons involved in fatal accidents: 25Pedestrians involved in fatal accidents: 6
Fatal accident statistics in 2013:
Fatal accident count: 5Vehicles involved in fatal accidents: 6Fatal accidents caused by drunken drivers: 1Fatalities: 5Persons involved in fatal accidents: 7Pedestrians involved in fatal accidents: 3
Home Mortgage Disclosure Act Aggregated Statistics For Year 2009(Based on 2 full and 6 partial tracts) A) FHA, FSA/RHS & VA B) Conventional C) Refinancings D) Home Improvement Loans F) Non-occupant Loans on G) Loans On Manufactured Number Average Value Number Average Value Number Average Value Number Average Value Number Average Value Number Average Value
LOANS ORIGINATED 402 $147,603 556 $141,390 310 $184,026 10 $91,321 459 $150,096 34 $57,439 APPLICATIONS APPROVED, NOT ACCEPTED 21 $142,647 46 $172,945 61 $175,403 3 $96,770 44 $166,782 6 $41,493 APPLICATIONS DENIED 149 $149,495 251 $136,967 424 $187,450 23 $94,645 276 $152,410 24 $89,351 APPLICATIONS WITHDRAWN 74 $142,876 96 $133,675 153 $186,528 6 $92,983 89 $151,849 5 $144,354 FILES CLOSED FOR INCOMPLETENESS 23 $163,646 33 $161,516 49 $190,560 1 $410,990 35 $180,678 1 $86,820
Aggregated Statistics For Year 2008(Based on 2 full and 6 partial tracts) A) FHA, FSA/RHS & VA B) Conventional C) Refinancings D) Home Improvement Loans E) Loans on Dwellings For 5+ Families F) Non-occupant Loans on G) Loans On Manufactured Number Average Value Number Average Value Number Average Value Number Average Value Number Average Value Number Average Value Number Average Value
LOANS ORIGINATED 226 $190,632 869 $219,376 402 $192,441 27 $97,586 2 $9,696,265 706 $223,400 57 $54,162 APPLICATIONS APPROVED, NOT ACCEPTED 11 $175,213 217 $230,121 138 $216,009 8 $82,780 0 $0 176 $234,783 18 $57,279 APPLICATIONS DENIED 94 $193,681 731 $258,341 772 $230,009 102 $91,721 0 $0 703 $247,833 72 $58,539 APPLICATIONS WITHDRAWN 49 $193,072 200 $237,320 236 $229,140 13 $125,388 0 $0 195 $228,650 6 $80,428 FILES CLOSED FOR INCOMPLETENESS 18 $198,312 119 $253,016 89 $246,678 4 $429,275 0 $0 104 $261,007 1 $43,850
Aggregated Statistics For Year 2007(Based on 2 full and 6 partial tracts) A) FHA, FSA/RHS & VA B) Conventional C) Refinancings D) Home Improvement Loans E) Loans on Dwellings For 5+ Families F) Non-occupant Loans on G) Loans On Manufactured Number Average Value Number Average Value Number Average Value Number Average Value Number Average Value Number Average Value Number Average Value
LOANS ORIGINATED 66 $218,682 2,802 $244,403 1,399 $227,877 125 $146,625 3 $12,671,747 2,109 $243,631 63 $79,070 APPLICATIONS APPROVED, NOT ACCEPTED 4 $202,808 537 $244,620 445 $238,657 36 $137,586 0 $0 404 $240,411 31 $77,437 APPLICATIONS DENIED 17 $242,361 1,586 $271,373 1,689 $259,623 173 $117,710 0 $0 1,217 $256,835 54 $74,634 APPLICATIONS WITHDRAWN 13 $185,191 568 $269,301 597 $255,549 37 $168,776 2 $113,170 422 $260,722 12 $99,697 FILES CLOSED FOR INCOMPLETENESS 4 $156,218 188 $276,884 208 $284,689 7 $143,629 0 $0 134 $274,227 3 $74,470
Aggregated Statistics For Year 2006(Based on 2 full and 6 partial tracts) A) FHA, FSA/RHS & VA B) Conventional C) Refinancings D) Home Improvement Loans E) Loans on Dwellings For 5+ Families F) Non-occupant Loans on G) Loans On Manufactured Number Average Value Number Average Value Number Average Value Number Average Value Number Average Value Number Average Value Number Average Value
LOANS ORIGINATED 43 $159,478 5,457 $220,885 2,013 $229,757 207 $167,243 1 $146,060 3,459 $227,585 84 $93,108 APPLICATIONS APPROVED, NOT ACCEPTED 1 $258,260 849 $226,832 450 $225,767 54 $101,652 0 $0 528 $219,260 27 $70,866 APPLICATIONS DENIED 7 $238,916 1,810 $226,253 1,370 $243,026 225 $99,626 1 $110,070 1,093 $233,860 90 $82,827 APPLICATIONS WITHDRAWN 9 $221,604 905 $244,165 888 $237,914 49 $167,967 0 $0 525 $239,107 7 $93,586 FILES CLOSED FOR INCOMPLETENESS 0 $0 213 $221,939 228 $225,174 15 $183,472 0 $0 153 $227,072 3 $79,220
Aggregated Statistics For Year 2005(Based on 2 full and 6 partial tracts) A) FHA, FSA/RHS & VA B) Conventional C) Refinancings D) Home Improvement Loans E) Loans on Dwellings For 5+ Families F) Non-occupant Loans on G) Loans On Manufactured Number Average Value Number Average Value Number Average Value Number Average Value Number Average Value Number Average Value Number Average Value
LOANS ORIGINATED 33 $163,532 6,041 $198,938 1,848 $195,686 158 $122,492 1 $316,820 3,703 $203,627 111 $66,235 APPLICATIONS APPROVED, NOT ACCEPTED 3 $105,017 603 $183,250 364 $187,756 57 $75,598 0 $0 353 $194,152 38 $60,931 APPLICATIONS DENIED 8 $69,759 1,590 $192,634 1,148 $196,137 198 $77,233 1 $68,800 840 $209,044 125 $65,346 APPLICATIONS WITHDRAWN 4 $267,378 1,052 $196,173 982 $194,747 91 $176,504 1 $433,410 517 $206,703 29 $80,797 FILES CLOSED FOR INCOMPLETENESS 0 $0 151 $206,437 205 $190,433 13 $121,795 0 $0 88 $195,422 5 $78,588
Aggregated Statistics For Year 2004(Based on 2 full and 6 partial tracts) A) FHA, FSA/RHS & VA B) Conventional C) Refinancings D) Home Improvement Loans E) Loans on Dwellings For 5+ Families F) Non-occupant Loans on G) Loans On Manufactured Number Average Value Number Average Value Number Average Value Number Average Value Number Average Value Number Average Value Number Average Value
LOANS ORIGINATED 62 $137,575 3,921 $169,471 1,134 $152,405 106 $79,299 1 $11,377,800 2,571 $170,073 94 $61,372 APPLICATIONS APPROVED, NOT ACCEPTED 5 $122,898 441 $165,435 297 $148,457 21 $63,451 0 $0 278 $165,293 30 $47,692 APPLICATIONS DENIED 9 $121,322 739 $147,762 829 $138,698 200 $56,529 0 $0 420 $139,931 100 $55,235 APPLICATIONS WITHDRAWN 15 $144,460 581 $170,931 733 $150,908 52 $65,141 0 $0 348 $156,111 27 $96,597 FILES CLOSED FOR INCOMPLETENESS 1 $43,850 186 $151,805 129 $178,983 10 $64,467 0 $0 96 $151,454 2 $186,015
Aggregated Statistics For Year 2003(Based on 2 full and 6 partial tracts) A) FHA, FSA/RHS & VA B) Conventional C) Refinancings D) Home Improvement Loans E) Loans on Dwellings For 5+ Families F) Non-occupant Loans on Number Average Value Number Average Value Number Average Value Number Average Value Number Average Value Number Average Value
LOANS ORIGINATED 113 $136,410 2,327 $149,256 1,756 $130,262 65 $36,343 2 $496,350 1,553 $140,747 APPLICATIONS APPROVED, NOT ACCEPTED 7 $181,804 274 $143,347 357 $122,200 26 $39,482 0 $0 187 $132,040 APPLICATIONS DENIED 27 $137,694 404 $138,267 918 $118,989 78 $34,856 0 $0 260 $138,651 APPLICATIONS WITHDRAWN 22 $138,745 393 $151,621 540 $128,097 8 $44,116 0 $0 183 $149,395 FILES CLOSED FOR INCOMPLETENESS 1 $104,360 104 $159,074 135 $140,115 4 $25,600 0 $0 71 $156,733
Aggregated Statistics For Year 1999(Based on 2 partial tracts) A) FHA, FSA/RHS & VA B) Conventional C) Refinancings D) Home Improvement Loans F) Non-occupant Loans on Number Average Value Number Average Value Number Average Value Number Average Value Number Average Value
LOANS ORIGINATED 69 $92,193 524 $109,921 210 $84,801 31 $32,177 238 $105,803 APPLICATIONS APPROVED, NOT ACCEPTED 3 $91,777 91 $91,186 68 $75,035 21 $22,691 40 $95,259 APPLICATIONS DENIED 12 $91,705 229 $74,189 193 $68,792 52 $26,988 54 $89,281 APPLICATIONS WITHDRAWN 4 $108,358 68 $112,646 104 $80,626 7 $55,851 24 $94,991 FILES CLOSED FOR INCOMPLETENESS 2 $79,725 28 $103,944 29 $83,906 1 $20,760 11 $81,583
Detailed HMDA statistics for the following Tracts:
0408.00
,
0409.00 ,
0410.00 ,
0415.00
Private Mortgage Insurance Companies Aggregated Statistics For Year 2009(Based on 2 full and 6 partial tracts) A) Conventional B) Refinancings C) Non-occupant Loans on Number Average Value Number Average Value Number Average Value
LOANS ORIGINATED 19 $192,289 6 $188,168 3 $191,140 APPLICATIONS APPROVED, NOT ACCEPTED 25 $292,869 9 $271,418 8 $268,799 APPLICATIONS DENIED 2 $216,890 7 $184,354 1 $134,180 APPLICATIONS WITHDRAWN 3 $273,910 1 $114,890 1 $52,390 FILES CLOSED FOR INCOMPLETENESS 8 $269,738 1 $141,200 1 $406,150
Aggregated Statistics For Year 2008(Based on 2 full and 6 partial tracts) A) Conventional B) Refinancings C) Non-occupant Loans on D) Loans On Manufactured Number Average Value Number Average Value Number Average Value Number Average Value
LOANS ORIGINATED 305 $248,828 45 $255,172 168 $259,432 0 $0 APPLICATIONS APPROVED, NOT ACCEPTED 234 $271,658 59 $253,572 102 $261,092 2 $84,380 APPLICATIONS DENIED 71 $255,430 6 $270,308 45 $247,543 0 $0 APPLICATIONS WITHDRAWN 32 $237,458 5 $224,206 21 $244,530 0 $0 FILES CLOSED FOR INCOMPLETENESS 28 $253,731 6 $300,533 26 $246,947 0 $0
Aggregated Statistics For Year 2007(Based on 2 full and 6 partial tracts) A) Conventional B) Refinancings C) Non-occupant Loans on D) Loans On Manufactured Number Average Value Number Average Value Number Average Value Number Average Value
LOANS ORIGINATED 689 $264,266 141 $276,036 379 $265,167 1 $218,420 APPLICATIONS APPROVED, NOT ACCEPTED 162 $275,713 69 $295,492 112 $279,172 0 $0 APPLICATIONS DENIED 78 $262,963 6 $353,298 55 $265,081 0 $0 APPLICATIONS WITHDRAWN 48 $267,351 18 $289,239 33 $277,392 0 $0 FILES CLOSED FOR INCOMPLETENESS 17 $259,137 2 $325,205 13 $259,713 0 $0
Aggregated Statistics For Year 2006(Based on 2 full and 6 partial tracts) A) Conventional B) Refinancings C) Non-occupant Loans on D) Loans On Manufactured Number Average Value Number Average Value Number Average Value Number Average Value
LOANS ORIGINATED 800 $250,663 72 $267,207 559 $246,177 4 $125,630 APPLICATIONS APPROVED, NOT ACCEPTED 166 $254,292 20 $273,690 116 $255,424 2 $86,825 APPLICATIONS DENIED 60 $250,083 6 $311,060 52 $254,827 1 $105,240 APPLICATIONS WITHDRAWN 40 $257,732 15 $255,717 32 $229,131 0 $0 FILES CLOSED FOR INCOMPLETENESS 15 $215,511 1 $96,470 15 $215,511 0 $0
Aggregated Statistics For Year 2005(Based on 2 full and 6 partial tracts) A) Conventional B) Refinancings C) Non-occupant Loans on D) Loans On Manufactured Number Average Value Number Average Value Number Average Value Number Average Value
LOANS ORIGINATED 967 $221,240 62 $215,680 571 $224,696 7 $68,399 APPLICATIONS APPROVED, NOT ACCEPTED 140 $216,687 18 $199,662 78 $215,268 0 $0 APPLICATIONS DENIED 25 $284,920 3 $231,013 21 $284,333 0 $0 APPLICATIONS WITHDRAWN 60 $240,065 8 $267,768 33 $234,938 0 $0 FILES CLOSED FOR INCOMPLETENESS 7 $162,283 2 $157,420 5 $118,226 0 $0
Aggregated Statistics For Year 2004(Based on 2 full and 6 partial tracts) A) Conventional B) Refinancings C) Non-occupant Loans on D) Loans On Manufactured Number Average Value Number Average Value Number Average Value Number Average Value
LOANS ORIGINATED 829 $174,168 67 $159,061 472 $171,523 3 $115,957 APPLICATIONS APPROVED, NOT ACCEPTED 163 $170,905 42 $140,214 94 $162,835 0 $0 APPLICATIONS DENIED 14 $186,213 3 $225,583 9 $177,766 0 $0 APPLICATIONS WITHDRAWN 61 $175,238 4 $162,800 38 $184,513 0 $0 FILES CLOSED FOR INCOMPLETENESS 6 $168,438 1 $136,530 4 $207,435 0 $0
Aggregated Statistics For Year 2003(Based on 2 full and 6 partial tracts) A) Conventional B) Refinancings C) Non-occupant Loans on Number Average Value Number Average Value Number Average Value
LOANS ORIGINATED 587 $155,477 195 $140,174 291 $152,341 APPLICATIONS APPROVED, NOT ACCEPTED 72 $171,610 54 $147,201 45 $159,139 APPLICATIONS DENIED 15 $163,677 5 $114,088 12 $140,987 APPLICATIONS WITHDRAWN 31 $167,403 12 $163,041 13 $177,908 FILES CLOSED FOR INCOMPLETENESS 1 $75,680 2 $146,760 0 $0
Aggregated Statistics For Year 1999(Based on 2 partial tracts) A) Conventional B) Refinancings C) Non-occupant Loans on Number Average Value Number Average Value Number Average Value
LOANS ORIGINATED 120 $115,359 26 $95,863 46 $106,854 APPLICATIONS APPROVED, NOT ACCEPTED 11 $127,735 2 $95,990 3 $157,033 APPLICATIONS DENIED 8 $121,274 1 $139,110 3 $90,453 APPLICATIONS WITHDRAWN 4 $122,445 2 $79,520 1 $72,010 FILES CLOSED FOR INCOMPLETENESS 3 $106,180 1 $62,130 0 $0
Detailed PMIC statistics for the following Tracts:
0408.00
,
0409.00 ,
0410.00 ,
0415.00
2004 - 2018 National Fire Incident Reporting System (NFIRS) incidents See full 2006 National Fire Incident Reporting System statistics for zip code 34746, Florida
Most common first names in zip code 34746 among deceased individuals Name Count Lived (average)
John 82 76.5 years William 58 78.0 years Mary 55 79.7 years Robert 52 76.1 years James 45 75.6 years Charles 43 75.6 years Helen 42 85.2 years Richard 36 71.9 years Joseph 36 79.9 years George 35 80.0 years
Most common last names in zip code 34746 among deceased individuals Last name Count Lived (average)
Smith 28 78.8 years Johnson 17 81.7 years Brown 14 80.5 years Jones 14 79.6 years Miller 12 75.4 years Williams 12 84.6 years Rodriguez 12 72.1 years Rivera 11 71.5 years Taylor 11 73.2 years Anderson 10 86.8 years
Businesses in zip code 34746
Name Count Name Count
7-Eleven 5 Motel 6 1 ALDI 1 Olive Garden 1 AT&T 1 Panda Express 1 Advance Auto Parts 1 Papa John's Pizza 1 Applebee's 1 Payless 1 Arby's 1 Pizza Hut 3 Baskin-Robbins 1 Publix Super Markets 4 Blockbuster 1 Quality 2 Budget Car Rental 1 RadioShack 1 Burger King 3 Red Lobster 1 CVS 3 Red Roof Inn 1 Comfort Suites 1 Rodeway Inn 1 Cracker Barrel 1 Ruby Tuesday 1 DHL 1 Sam's Club 1 Dennys 2 Starbucks 1 Domino's Pizza 2 Steak 'n Shake 1 Dunkin Donuts 4 Studio 6 1 Econo Lodge 2 Subway 5 FedEx 2 Super 8 1 GameStop 3 T-Mobile 2 Haagen-Dazs 1 T.G.I. Driday's 1 Hilton 1 Taco Bell 2 Holiday Inn 2 Target 1 Howard Johnson 3 Travelodge 2 IHOP 2 U-Haul 4 KFC 2 UPS 2 Knights Inn 1 Vans 1 Lane Bryant 1 Waffle House 2 Lowe's 1 Walgreens 4 Marshalls 1 Walmart 2 McDonald's 5
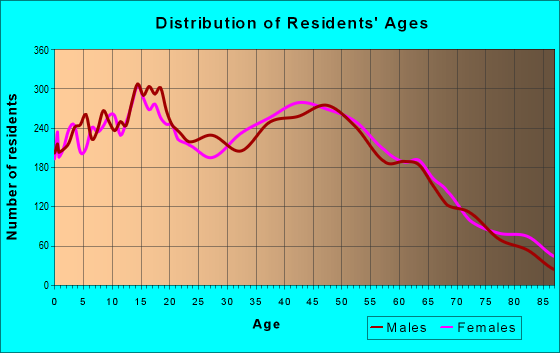
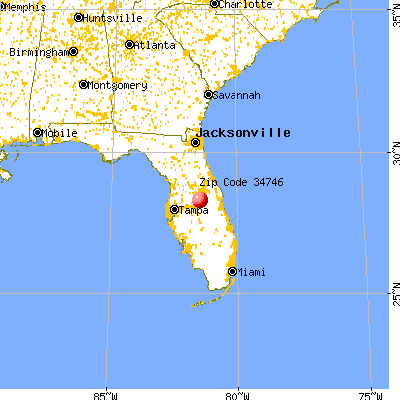


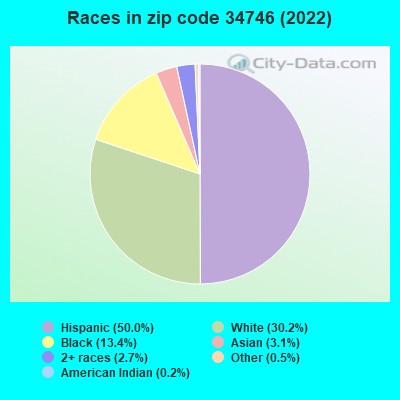


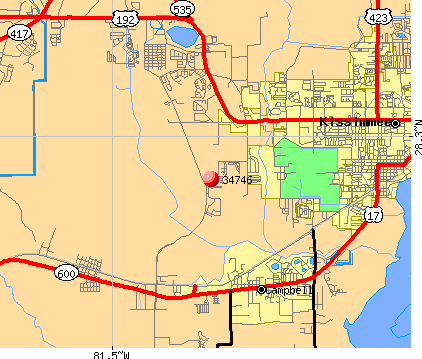 Nearest zip codes: 34758, 34741, 33848, 34743, 34744, 34759.
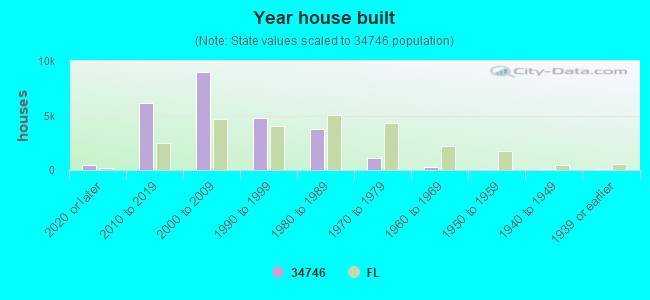
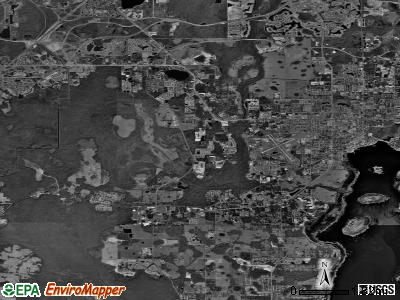
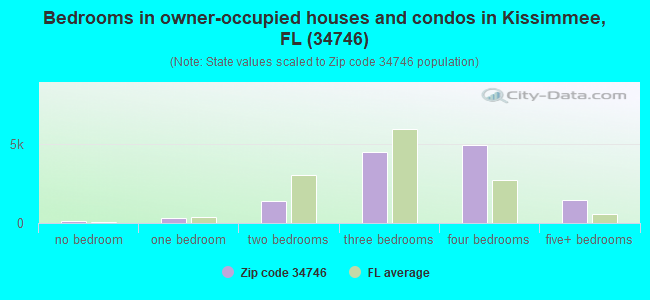
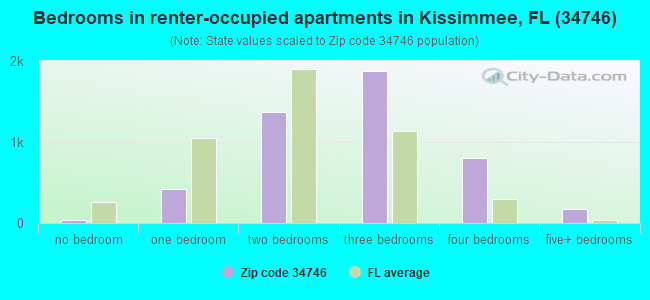
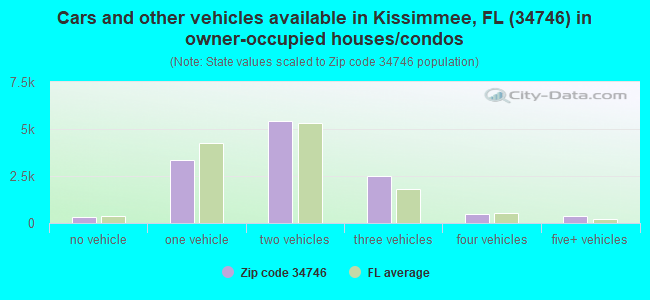
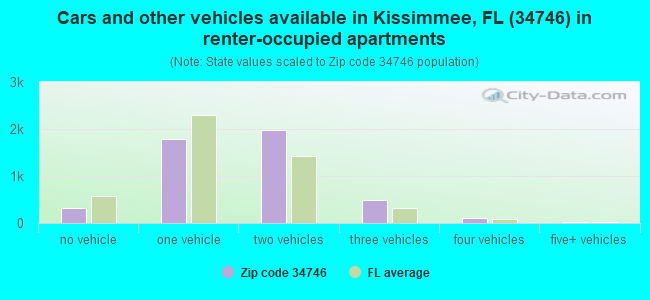


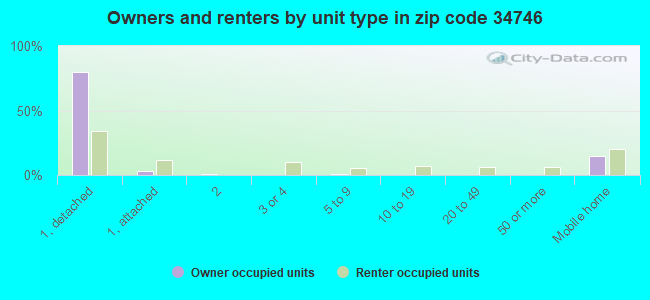
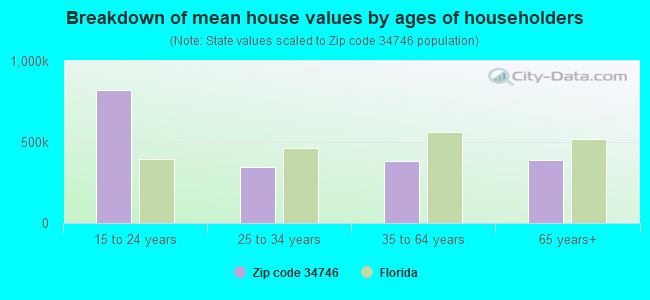


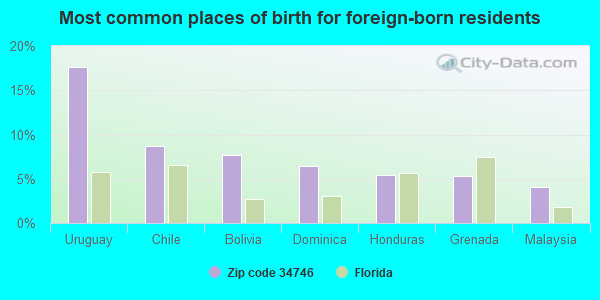
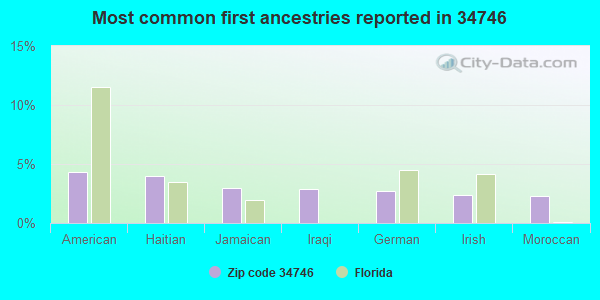
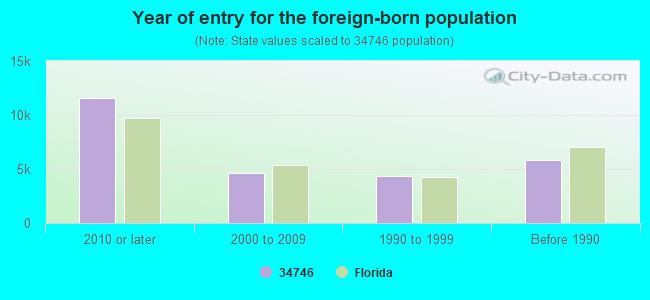
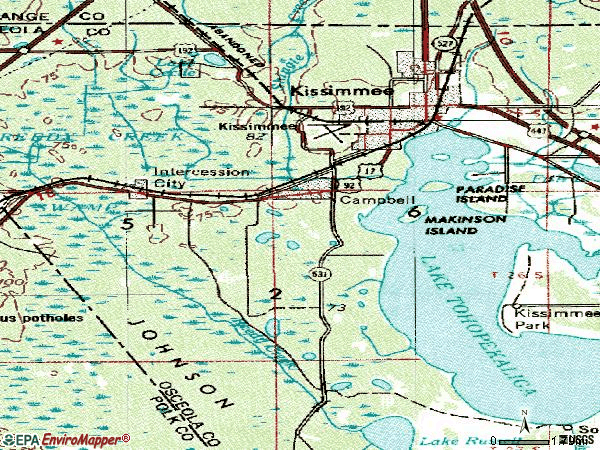


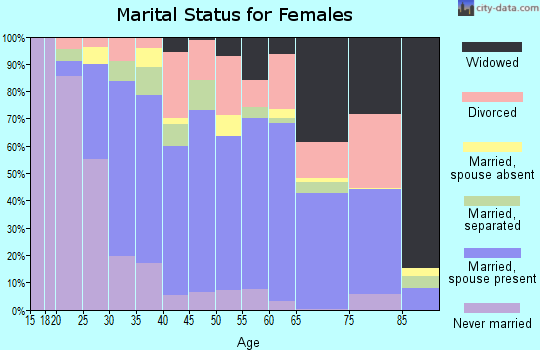
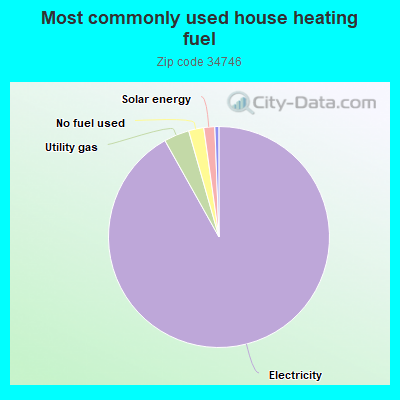
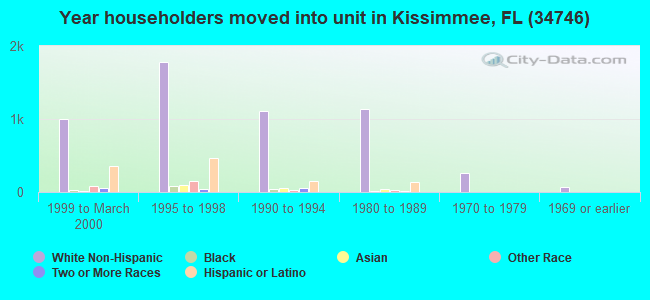
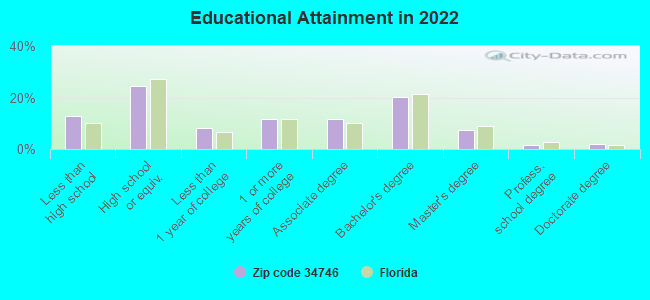
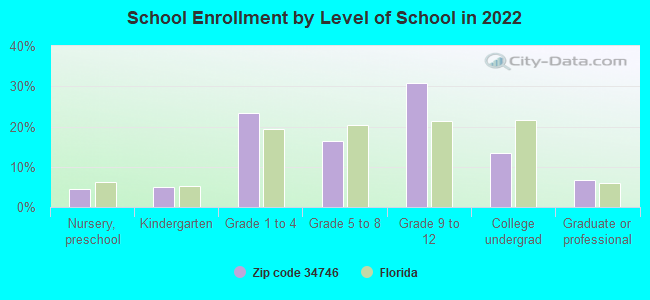
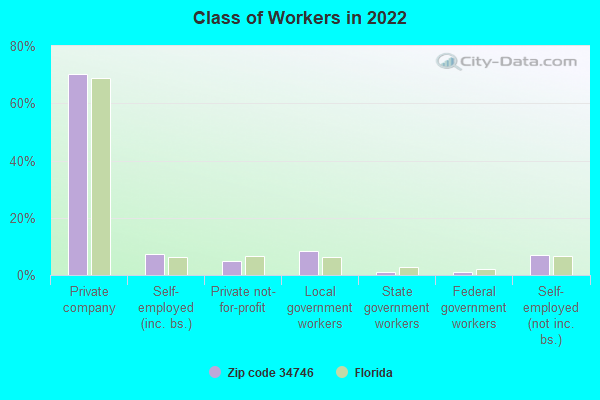
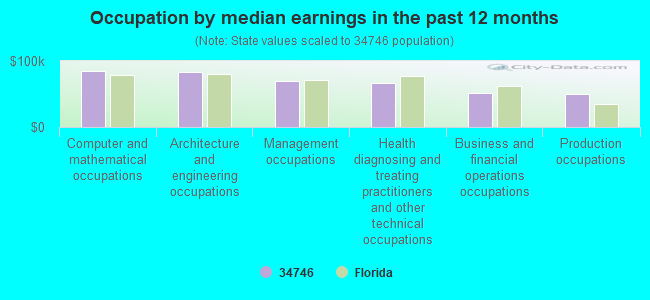
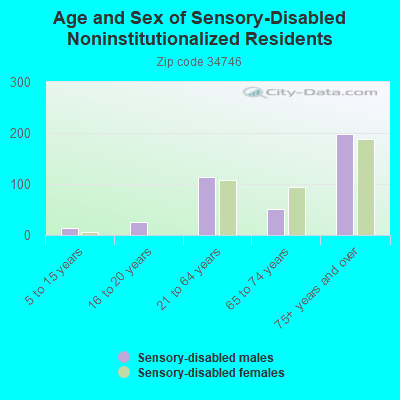
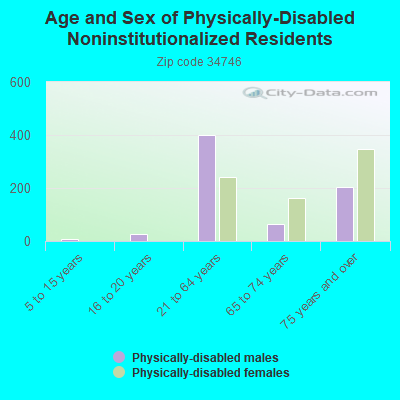
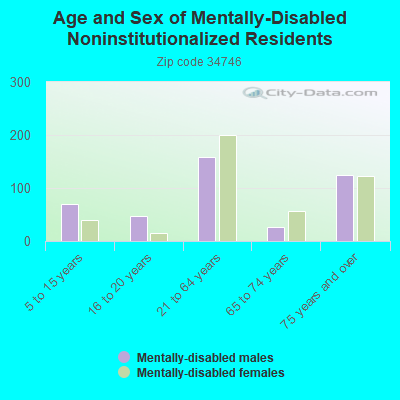
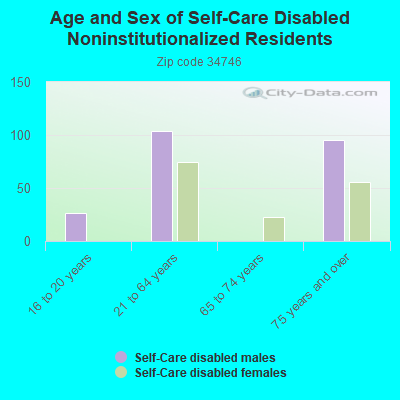
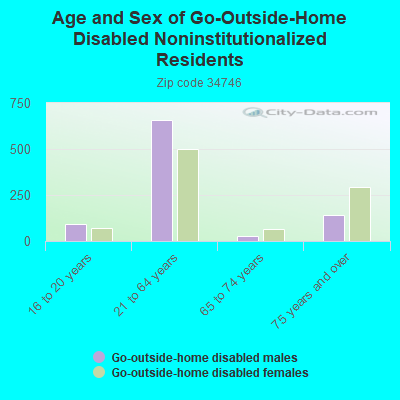
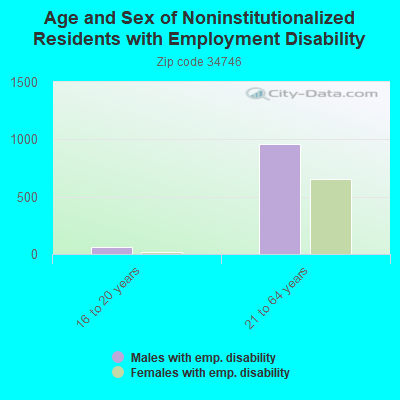
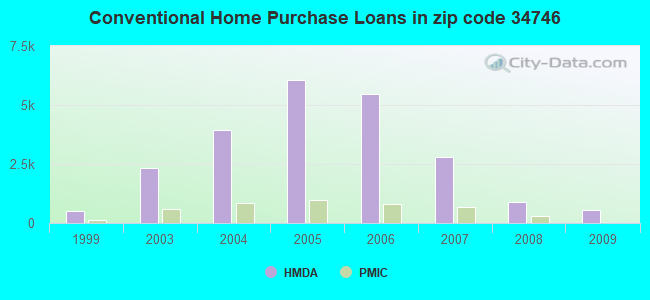
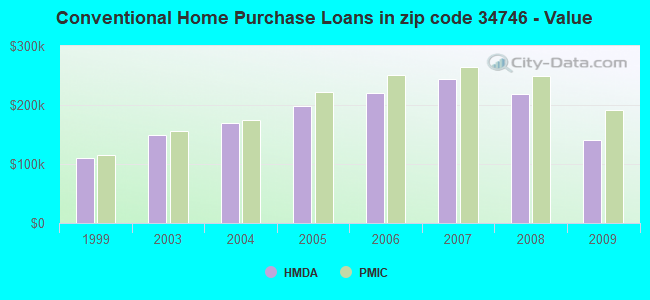
 According to the data from the years 2004 - 2018 the average number of fires per year is 113. The highest number of fires - 164 took place in 2009, and the least - 15 in 2004. The data has an increasing trend.
 When looking into fire subcategories, the most reports belonged to: Outside Fires (45.7%), and Structure Fires (33.6%).