Estimated zip code population in 2022: 7,394 Zip code population in 2010: 6,661 Zip code population in 2000: 5,358
Houses and condos: 2,856 Renter-occupied apartments: 481
% of renters here:
18%
State:
34%
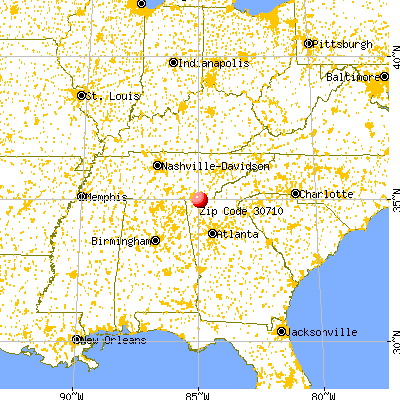
March 2022 cost of living index in zip code 30710: 81.1 (low, U.S. average is 100)
Land area: 47.5 sq. mi. Water area: 0.1 sq. mi.
Population density: 156 people per square mile
(very low).
OSM Map
General Map
Google Map
MSN Map
OSM Map
General Map
Google Map
MSN Map
OSM Map
General Map
Google Map
MSN Map
OSM Map
General Map
Google Map
MSN Map
Please wait while loading the map...
Real estate property taxes paid for housing units in 2022:
This zip code:
0.6% ($1,316)
Georgia:
0.7% ($2,160)
Median real estate property taxes paid for housing units with mortgages in 2022: $1,729 (0.8%) Median real estate property taxes paid for housing units with no mortgage in 2022: $822 (0.4%)
Business Search- 14 Million verified businesses
Males: 3,758
(50.8%)
Females: 3,635
(49.2%)
For population 25 years and over in 30710:
High school or higher: 82.5%
Bachelor's degree or higher: 22.8%
Graduate or professional degree: 10.4%
Unemployed: 3.5%
Mean travel time to work (commute): 26.3 minutes
For population 15 years and over in 30710:
Never married: 22.6%
Now married: 59.2%
Separated: 1.0%
Widowed: 5.2%
Divorced: 11.9%
Zip code 30710 compared to state average:
Black race population percentage significantly below state average.
Foreign-born population percentage below state average.
Renting percentage below state average.
Length of stay since moving in significantly above state average.
Averages for the 2020 tax year for zip code 30710, filed in 2021:
Average Adjusted Gross Income (AGI) in 2020: $60,103 (Individual Income Tax Returns)
Here:
$60,103
State:
$70,847
Salary/wage: $52,049 (reported on 84.3% of returns)
Here:
$52,049
State:
$59,126
(% of AGI for various income ranges: 1144.1% for AGIs below $25k, 3615.0% for AGIs $25k-50k, 6485.0% for AGIs $50k-75k, 9774.2% for AGIs $75k-100k, 17645.0% for AGIs $100k-200k, 44127.5% for AGIs over 200k)
Taxable interest for individuals: $886 (reported on 23.1% of returns)
This zip code:
$886
Georgia:
$2,011
(% of AGI for various income ranges: 15.4% for AGIs below $25k, 8.6% for AGIs $25k-50k, 34.7% for AGIs $50k-75k, 29.5% for AGIs $75k-100k, 70.9% for AGIs $100k-200k, 260.0% for AGIs over 200k)
Ordinary dividends: $3,542 (reported on 11.7% of returns)
Here:
$3,542
State:
$8,996
(% of AGI for various income ranges: 18.7% for AGIs below $25k, 26.4% for AGIs $25k-50k, 47.3% for AGIs $50k-75k, 78.9% for AGIs $75k-100k, 185.0% for AGIs $100k-200k, 470.0% for AGIs over 200k)
Net capital gain/loss in AGI: +$11,929 (reported on 12.1% of returns)
Here:
+$11,929
State:
+$28,402
(% of AGI for various income ranges: 7.0% for AGIs below $25k, 26.9% for AGIs $25k-50k, 43.3% for AGIs $50k-75k, 107.9% for AGIs $75k-100k, 430.9% for AGIs $100k-200k, 6422.5% for AGIs over 200k)
Profit/loss from business: +$10,891 (reported on 15.3% of returns)
Here:
+$10,891
State:
+$6,707
(% of AGI for various income ranges: 138.3% for AGIs below $25k, 95.7% for AGIs $25k-50k, 187.0% for AGIs $50k-75k, 263.7% for AGIs $75k-100k, 960.0% for AGIs $100k-200k)
Taxable individual retirement arrangement distribution: $16,988 (reported on 8.9% of returns)
30710:
$16,988
Georgia:
$20,525
(% of AGI for various income ranges: 55.4% for AGIs below $25k, 112.4% for AGIs $25k-50k, 222.3% for AGIs $50k-75k, 176.8% for AGIs $75k-100k, 1004.5% for AGIs $100k-200k)
Total itemized deductions: $34,641 (reported on 6.0% of returns)
Here:
$34,641
State:
$34,001
(% of AGI for various income ranges: 97.1% for AGIs below $25k, 152.0% for AGIs $50k-75k, 324.7% for AGIs $75k-100k, 866.8% for AGIs $100k-200k, 5597.5% for AGIs over 200k)
Charity contributions: $15,844 (reported on 5.7% of returns)
Here:
$15,844
State:
$14,164
(% of AGI for various income ranges: 39.0% for AGIs $25k-50k, 111.1% for AGIs $75k-100k, 313.6% for AGIs $100k-200k, 3520.0% for AGIs over 200k)
Taxes paid: $8,181 (reported on 5.7% of returns)
30710:
$8,181
State:
$7,540
(% of AGI for various income ranges: 10.9% for AGIs below $25k, 33.7% for AGIs $50k-75k, 78.9% for AGIs $75k-100k, 244.1% for AGIs $100k-200k, 1115.0% for AGIs over 200k)
Earned income credit: $2,308 (reported on 18.9% of returns)
Here:
$2,308
State:
$2,530
(% of AGI for various income ranges: 100.9% for AGIs below $25k, 90.9% for AGIs $25k-50k)
Percentage of individuals using paid preparers for their 2020 taxes: 94.0%
Here:
94%
State:
93%
(% for various income ranges: 93.3% for AGIs below $25k, 94.6% for AGIs $25k-50k, 92.9% for AGIs $50k-75k, 96.3% for AGIs $75k-100k, 92.3% for AGIs $100k-200k, 100.0% for AGIs over 200k)
Averages for the 2012 tax year for zip code 30710, filed in 2013:
Average Adjusted Gross Income (AGI) in 2012: $50,857 (Individual Income Tax Returns)
Here:
$50,857
State:
$56,131
Salary/wage: $45,681 (reported on 87.5% of returns)
Here:
$45,681
State:
$47,942
(% of AGI for various income ranges: 79.4% for AGIs below $25k, 86.8% for AGIs $25k-50k, 83.4% for AGIs $50k-75k, 75.7% for AGIs $75k-100k, 76.1% for AGIs $100k-200k, 71.3% for AGIs over 200k)
Taxable interest for individuals: $2,043 (reported on 23.4% of returns)
This zip code:
$2,043
Georgia:
$1,706
(% of AGI for various income ranges: 1.1% for AGIs below $25k, 0.6% for AGIs $25k-50k, 0.7% for AGIs $50k-75k, 0.4% for AGIs $75k-100k, 1.8% for AGIs $100k-200k, 0.7% for AGIs over 200k)
Ordinary dividends: $2,384 (reported on 12.1% of returns)
Here:
$2,384
State:
$7,265
(% of AGI for various income ranges: 0.5% for AGIs below $25k, 0.4% for AGIs $25k-50k, 0.5% for AGIs $50k-75k, 0.3% for AGIs $75k-100k, 0.8% for AGIs $100k-200k, 0.7% for AGIs over 200k)
Net capital gain/loss in AGI: +$440 (reported on 9.8% of returns)
Here:
+$440
State:
+$16,323
(% of AGI for various income ranges: 0.2% for AGIs $50k-75k, 0.4% for AGIs $100k-200k)
Profit/loss from business: +$8,885 (reported on 15.2% of returns)
Here:
+$8,885
State:
+$7,583
(% of AGI for various income ranges: 8.5% for AGIs below $25k, 2.4% for AGIs $25k-50k, 1.3% for AGIs $50k-75k, 2.9% for AGIs $75k-100k, 3.3% for AGIs $100k-200k)
Taxable individual retirement arrangement distribution: $15,195 (reported on 7.8% of returns)
30710:
$15,195
Georgia:
$17,199
(% of AGI for various income ranges: 2.6% for AGIs below $25k, 2.1% for AGIs $25k-50k, 1.3% for AGIs $50k-75k, 2.1% for AGIs $75k-100k, 5.1% for AGIs $100k-200k)
Total itemized deductions: $20,492 (21% of AGI, reported on 31.2% of returns)
Here:
$20,492
State:
$23,886
Here:
20.6% of AGI
State:
21.5% of AGI
(% of AGI for various income ranges: 7.2% for AGIs below $25k, 8.8% for AGIs $25k-50k, 13.3% for AGIs $50k-75k, 15.5% for AGIs $75k-100k, 15.4% for AGIs $100k-200k, 12.9% for AGIs over 200k)
Charity contributions: $5,287 (reported on 24.6% of returns)
Here:
$5,287
State:
$5,507
(% of AGI for various income ranges: 0.7% for AGIs below $25k, 1.1% for AGIs $25k-50k, 2.1% for AGIs $50k-75k, 3.0% for AGIs $75k-100k, 3.5% for AGIs $100k-200k, 3.8% for AGIs over 200k)
Taxes paid: $6,580 (reported on 31.2% of returns)
30710:
$6,580
State:
$7,838
(% of AGI for various income ranges: 1.1% for AGIs below $25k, 1.5% for AGIs $25k-50k, 3.7% for AGIs $50k-75k, 4.4% for AGIs $75k-100k, 5.7% for AGIs $100k-200k, 6.0% for AGIs over 200k)
Earned income credit: $2,402 (reported on 23.4% of returns)
Here:
$2,402
State:
$2,589
(% of AGI for various income ranges: 8.2% for AGIs below $25k, 1.6% for AGIs $25k-50k)
Percentage of individuals using paid preparers for their 2012 taxes: 50.0%
Here:
50%
State:
55%
(% for various income ranges: 47.1% for AGIs below $25k, 47.8% for AGIs $25k-50k, 51.5% for AGIs $50k-75k, 52.4% for AGIs $75k-100k, 56.5% for AGIs $100k-200k, 75.0% for AGIs over 200k)
Averages for the 2004 tax year for zip code 30710, filed in 2005:
Average Adjusted Gross Income (AGI) in 2004: $46,558 (Individual Income Tax Returns)
Here:
$46,558
State:
$47,553
Salary/wage: $41,785 (reported on 91.5% of returns)
Here:
$41,785
State:
$42,178
(% of AGI for various income ranges: 106.5% for AGIs below $10k, 85.3% for AGIs $10k-25k, 90.6% for AGIs $25k-50k, 90.0% for AGIs $50k-75k, 84.8% for AGIs $75k-100k, 70.1% for AGIs over 100k)
Taxable interest for individuals: $1,248 (reported on 30.9% of returns)
This zip code:
$1,248
Georgia:
$1,772
(% of AGI for various income ranges: 2.3% for AGIs below $10k, 1.1% for AGIs $10k-25k, 0.6% for AGIs $25k-50k, 0.8% for AGIs $50k-75k, 0.3% for AGIs $75k-100k, 1.0% for AGIs over 100k)
Taxable dividends: $1,640 (reported on 13.8% of returns)
Here:
$1,640
State:
$4,283
(% of AGI for various income ranges: 1.6% for AGIs below $10k, 0.3% for AGIs $10k-25k, 0.3% for AGIs $25k-50k, 0.6% for AGIs $50k-75k, 0.5% for AGIs $75k-100k, 0.6% for AGIs over 100k)
Net capital gain/loss: +$9,444 (reported on 11.6% of returns)
Here:
+$9,444
State:
+$16,461
(% of AGI for various income ranges: -0.6% for AGIs below $10k, 0.2% for AGIs $10k-25k, 0.6% for AGIs $25k-50k, 0.4% for AGIs $50k-75k, 0.5% for AGIs $75k-100k, 5.8% for AGIs over 100k)
Profit/loss from business: +$7,236 (reported on 14.9% of returns)
Here:
+$7,236
State:
+$8,201
(% of AGI for various income ranges: 6.5% for AGIs below $10k, 5.4% for AGIs $10k-25k, 2.3% for AGIs $25k-50k, 1.0% for AGIs $50k-75k, 2.4% for AGIs $75k-100k, 2.0% for AGIs over 100k)
IRA payment deduction: $3,548 (reported on 2.5% of returns)
30710:
$3,548
Georgia:
$2,969
(% of AGI for various income ranges: 0.2% for AGIs $25k-50k, 0.3% for AGIs $50k-75k, 0.3% for AGIs $75k-100k, 0.2% for AGIs over 100k)
Self-employed pension: $9,000 (reported on 0.4% of returns)
Here:
$9,000
Georgia:
$16,203
Total itemized deductions: $18,436 (21% of AGI, reported on 33.4% of returns)
Here:
$18,436
State:
$19,944
Here:
20.6% of AGI
State:
22.6% of AGI
(% of AGI for various income ranges: 7.1% for AGIs $10k-25k, 9.7% for AGIs $25k-50k, 14.2% for AGIs $50k-75k, 15.9% for AGIs $75k-100k, 15.9% for AGIs over 100k)
Charity contributions deductions: $4,594 (5% of AGI, reported on 28.3% of returns)
Here:
$4,594
State:
$4,354
Here:
4.8% of AGI
State:
4.7% of AGI
(% of AGI for various income ranges: 1.0% for AGIs $10k-25k, 1.4% for AGIs $25k-50k, 2.6% for AGIs $50k-75k, 2.6% for AGIs $75k-100k, 4.3% for AGIs over 100k)
Total tax: $6,736 (reported on 73.9% of returns)
30710:
$6,736
State:
$8,223
(% of AGI for various income ranges: 3.3% for AGIs below $10k, 3.7% for AGIs $10k-25k, 5.9% for AGIs $25k-50k, 8.0% for AGIs $50k-75k, 9.7% for AGIs $75k-100k, 17.4% for AGIs over 100k)
Earned income credit: $1,856 (reported on 19.9% of returns)
Here:
$1,856
State:
$1,986
Percentage of individuals using paid preparers for their 2004 taxes: 60.3%
Here:
60%
State:
62%
(% for various income ranges: 53.2% for AGIs below $10k, 65.3% for AGIs $10k-25k, 58.5% for AGIs $25k-50k, 64.0% for AGIs $50k-75k, 60.1% for AGIs $75k-100k, 59.3% for AGIs over 100k)
Likely homosexual households (counted as self-reported same-sex unmarried-partner households)
Lesbian couples: 0.1% of all households
Gay men: 0.0% of all households
Household received Food Stamps/SNAP in the past 12 months: 189 Household did not receive Food Stamps/SNAP in the past 12 months: 2,439
Women who had a birth in the past 12 months: 69 (42 now married, 26 unmarried) Women who did not have a birth in the past 12 months: 1,606 (827 now married, 777 unmarried)
Housing units in zip code 30710 with a mortgage: 1,051 (40 second mortgage, 37 both second mortgage and home equity loan) Houses without a mortgage: 8
Median monthly owner costs for units with a mortgage: $1,289 Median monthly owner costs for units without a mortgage: $422
Residents with income below the poverty level in 2022:
This zip code:
8.2%
Whole state:
12.7%
Residents with income below 50% of the poverty level in 2022:
This zip code:
3.2%
Whole state:
6.3%
Median number of rooms in houses and condos:
Here:
6.3
State:
6.8
Median number of rooms in apartments:
Here:
5.1
State:
4.6
Notable locations in this zip code not listed on our city pages
Notable locations in zip code 30710: Cohutta National Fish Hatchery (A), Whitfield County Fire Department Station 10 Beaverdale (B), Cohutta Volunteer Fire Department (C), Dalton Childrens Home (D), Whitfield County Fire Department Station 2 Varnell (E). Display/hide their locations on the map
Churches in zip code 30710 include: Varnell Church (A), Mount Calvary Church (B), Cohutta Baptist Church (C), Hopewell Baptist Church (D), Andrew Chapel (E), Gobblers Knob Church (F), Mount Calvary Church (G), Little Prospect Church (H), Liberty Bell Church (I). Display/hide their locations on the map
Streams, rivers, and creeks: Oak Grove Branch (A), Murr Branch (B), Mills Creek (C), Hunsucker Branch (D), Hughes Branch (E), Hagin Branch (F), Dry Prong (G), Dry Branch (H), Blue Branch (I). Display/hide their locations on the map
In group quarters: 5 (-1 institutionalized population)
Size of family households: 976 2-persons, 434 3-persons, 533 4-persons, 219 5-persons, 47 6-persons, 3 7-or-more-persons
Size of nonfamily households: 401 1-person, 10 2-persons, 8 3-persons
1,133 married couples with children.
456 single-parent households (108 men, 348 women).
90.7% of residents of 30710 zip code speak English at home.
7.5% of residents speak Spanish at home (75% very well, 21% well, 4% not well).
0.9% of residents speak other Indo-European language at home (100% very well).
0.6% of residents speak Asian or Pacific Island language at home (52% very well, 48% well).
Foreign born population: 343 (4.7%) (68.5% of them are naturalized citizens)
This zip code:
4.7%
Whole state:
10.7%
68%Honduras
9%Dominica
8%Colombia
5%Thailand
3%Nepal
3%Iran
1%Malaysia
55%English
15%American
8%Irish
3%Scottish
2%German
2%Italian
2%European
Year of entry for the foreign-born population
02010 or later
982000 to 2009
2011990 to 1999
20Before 1990
Facilities with environmental interests located in this zip code:
COHUTTA ELEMENTARY SCHOOL (254 WOLFE STREET in COHUTTA, GA)
(National Center for Education Statistics) - STATE ID-2050 Organizations: WHITFIELD COUNTY (SCHOOL DISTRICT)
CONAGRA POULTRY CO (COHUTTA VARNELL RD. in COHUTTA, GA)
AIR MINOR (AIRS/AFS) Business SIC classification: POULTRY SLAUGHTERING AND PROCESSING
COHUTTA BLOCK CO (5001 RED CLAY RD. in COHUTTA, GA)
AIR MINOR (AIRS/AFS) Business SIC classification: CONCRETE BLOCK AND BRICK
Housing units lacking complete plumbing facilities: 1.1% Housing units lacking complete kitchen facilities: 1.7%
88.7%Electricity
10.0%Bottled, tank, or LP gas
0.9%Wood
Population in 1990: 5,052. Population change in the 1990s: +306 (+6.1%).
Place of birth for U.S.-born residents:
This state: 4,858
Northeast: 152
Midwest: 170
South: 1,667
West: 172
63% of the 30710 zip code residents lived in the same house 5 years ago. Out of people who lived in different houses, 63% lived in this county. Out of people who lived in different counties, 50% lived in Georgia.
96% of the 30710 zip code residents lived in the same house 1 year ago. Out of people who lived in different houses, 61% moved from this county. Out of people who lived in different houses, 11% moved from different county within same state. Out of people who lived in different houses, 28% moved from different state. Out of people who lived in different houses, 3% moved from abroad.
Private vs. public school enrollment:
Students in private schools in grades 1 to 8 (elementary and middle school): 67
Here:
10.0%
Georgia:
12.1%
Students in private schools in grades 9 to 12 (high school): 78
Here:
18.4%
Georgia:
10.8%
Students in private undergraduate colleges: 13
Here:
5.3%
Georgia:
17.1%
Occupation by median earnings in the past 12 months ($)
138,728Health diagnosing and treating practitioners and other technical occupations
98,092Architecture and engineering occupations
80,806Business and financial operations occupations
78,057Management occupations
59,534Computer and mathematical occupations
56,039Installation, maintenance, and repair occupations
Top industries in this zip code by the number of employees in 2005:
Other Services (except Public Administration): Commercial and Industrial Machinery and Equipment (except Automotive and Electronic) Repair and Maintenance (10-19 employees: 1 establishment)
Construction: New Single-Family Housing Construction (except Operative Builders) (5-9: 1, 1-4: 2)
Wholesale Trade: Wholesale Trade Agents and Brokers (1-4: 3)
Professional, Scientific, and Technical Services: Offices of Lawyers (1-4: 2)
Administrative and Support and Waste Management and Remediation Services: Landscaping Services (1-4: 2)
People in group quarters in 2010:
10 people in group homes intended for adults
Fatal accident statistics in 2014:
Fatal accident count: 1
Vehicles involved in fatal accidents: 2
Fatal accidents caused by drunken drivers: 0
Fatalities: 1
Persons involved in fatal accidents: 3
Pedestrians involved in fatal accidents: 0
Fatal accident statistics in 2012:
Fatal accident count: 1
Vehicles involved in fatal accidents: 2
Fatal accidents caused by drunken drivers: 0
Fatalities: 1
Persons involved in fatal accidents: 3
Pedestrians involved in fatal accidents: 0
Home Mortgage Disclosure Act Aggregated Statistics For Year 2009 (Based on 4 partial tracts)
A) FHA, FSA/RHS & VA Home Purchase Loans
B) Conventional Home Purchase Loans
C) Refinancings
D) Home Improvement Loans
F) Non-occupant Loans on < 5 Family Dwellings (A B C & D)
G) Loans On Manufactured Home Dwelling (A B C & D)
Number
Average Value
Number
Average Value
Number
Average Value
Number
Average Value
Number
Average Value
Number
Average Value
LOANS ORIGINATED
46
$130,371
24
$128,306
253
$157,749
13
$31,609
44
$216,567
20
$68,260
APPLICATIONS APPROVED, NOT ACCEPTED
2
$148,835
6
$127,133
7
$99,391
3
$29,447
0
$0
0
$0
APPLICATIONS DENIED
12
$132,392
8
$115,701
122
$132,262
17
$21,744
10
$137,753
15
$53,667
APPLICATIONS WITHDRAWN
10
$109,493
4
$112,878
91
$160,407
4
$23,488
0
$0
5
$74,884
FILES CLOSED FOR INCOMPLETENESS
1
$224,350
1
$152,840
23
$157,868
0
$0
0
$0
1
$84,660
Aggregated Statistics For Year 2008 (Based on 4 partial tracts)
A) FHA, FSA/RHS & VA Home Purchase Loans
B) Conventional Home Purchase Loans
C) Refinancings
D) Home Improvement Loans
E) Loans on Dwellings For 5+ Families
F) Non-occupant Loans on < 5 Family Dwellings (A B C & D)
G) Loans On Manufactured Home Dwelling (A B C & D)
Number
Average Value
Number
Average Value
Number
Average Value
Number
Average Value
Number
Average Value
Number
Average Value
Number
Average Value
LOANS ORIGINATED
64
$110,751
64
$135,238
235
$139,300
32
$59,285
4
$317,650
80
$113,897
39
$68,123
APPLICATIONS APPROVED, NOT ACCEPTED
1
$178,080
4
$168,615
39
$117,831
8
$23,956
0
$0
8
$98,505
2
$86,720
APPLICATIONS DENIED
16
$101,355
14
$86,250
192
$124,763
27
$60,187
0
$0
2
$132,055
31
$73,677
APPLICATIONS WITHDRAWN
8
$102,634
20
$162,518
62
$142,144
3
$6,543
0
$0
1
$218,740
6
$85,152
FILES CLOSED FOR INCOMPLETENESS
1
$121,990
9
$110,861
22
$152,060
1
$15,420
0
$0
1
$72,910
0
$0
Aggregated Statistics For Year 2007 (Based on 4 partial tracts)
A) FHA, FSA/RHS & VA Home Purchase Loans
B) Conventional Home Purchase Loans
C) Refinancings
D) Home Improvement Loans
E) Loans on Dwellings For 5+ Families
F) Non-occupant Loans on < 5 Family Dwellings (A B C & D)
G) Loans On Manufactured Home Dwelling (A B C & D)
Number
Average Value
Number
Average Value
Number
Average Value
Number
Average Value
Number
Average Value
Number
Average Value
Number
Average Value
LOANS ORIGINATED
34
$105,971
145
$112,060
257
$129,659
46
$37,569
4
$129,985
64
$105,026
51
$56,659
APPLICATIONS APPROVED, NOT ACCEPTED
1
$134,610
17
$102,886
39
$138,598
10
$61,890
0
$0
0
$0
7
$61,644
APPLICATIONS DENIED
4
$117,890
33
$96,619
229
$128,097
32
$40,317
0
$0
5
$148,628
21
$65,275
APPLICATIONS WITHDRAWN
5
$105,254
18
$104,561
103
$134,660
8
$50,916
0
$0
5
$51,514
7
$42,826
FILES CLOSED FOR INCOMPLETENESS
4
$165,012
7
$161,379
35
$122,609
0
$0
0
$0
4
$52,802
3
$61,800
Aggregated Statistics For Year 2006 (Based on 4 partial tracts)
A) FHA, FSA/RHS & VA Home Purchase Loans
B) Conventional Home Purchase Loans
C) Refinancings
D) Home Improvement Loans
F) Non-occupant Loans on < 5 Family Dwellings (A B C & D)
G) Loans On Manufactured Home Dwelling (A B C & D)
Number
Average Value
Number
Average Value
Number
Average Value
Number
Average Value
Number
Average Value
Number
Average Value
LOANS ORIGINATED
46
$107,943
245
$109,096
310
$112,176
48
$35,719
51
$95,628
42
$58,080
APPLICATIONS APPROVED, NOT ACCEPTED
3
$143,023
19
$97,516
59
$145,526
7
$45,471
2
$158,235
7
$50,773
APPLICATIONS DENIED
16
$72,204
75
$83,737
187
$115,760
47
$47,037
25
$76,014
55
$62,051
APPLICATIONS WITHDRAWN
1
$114,980
30
$98,536
143
$108,380
8
$60,455
8
$85,710
5
$25,184
FILES CLOSED FOR INCOMPLETENESS
0
$0
10
$118,346
44
$147,587
1
$139,370
0
$0
0
$0
Aggregated Statistics For Year 2005 (Based on 4 partial tracts)
A) FHA, FSA/RHS & VA Home Purchase Loans
B) Conventional Home Purchase Loans
C) Refinancings
D) Home Improvement Loans
F) Non-occupant Loans on < 5 Family Dwellings (A B C & D)
G) Loans On Manufactured Home Dwelling (A B C & D)
Number
Average Value
Number
Average Value
Number
Average Value
Number
Average Value
Number
Average Value
Number
Average Value
LOANS ORIGINATED
48
$94,234
265
$120,274
316
$116,857
51
$58,664
48
$108,519
48
$75,991
APPLICATIONS APPROVED, NOT ACCEPTED
3
$84,600
34
$83,409
91
$118,239
6
$15,212
11
$79,236
16
$58,456
APPLICATIONS DENIED
16
$93,721
76
$99,457
194
$129,041
39
$41,687
16
$84,201
50
$63,465
APPLICATIONS WITHDRAWN
8
$118,744
28
$111,827
126
$141,701
15
$76,925
13
$67,721
5
$69,032
FILES CLOSED FOR INCOMPLETENESS
2
$172,570
11
$67,673
36
$134,359
3
$42,067
0
$0
1
$164,060
Aggregated Statistics For Year 2004 (Based on 4 partial tracts)
A) FHA, FSA/RHS & VA Home Purchase Loans
B) Conventional Home Purchase Loans
C) Refinancings
D) Home Improvement Loans
E) Loans on Dwellings For 5+ Families
F) Non-occupant Loans on < 5 Family Dwellings (A B C & D)
G) Loans On Manufactured Home Dwelling (A B C & D)
Detailed PMIC statistics for the following Tracts:0001.01
, 0001.02
2002 - 2018 National Fire Incident Reporting System (NFIRS) incidents
Based on the data from the years 2002 - 2018 the average number of fires per year is 22. The highest number of fire incidents - 46 took place in 2002, and the least - 1 in 2009. The data has a decreasing trend.
When looking into fire subcategories, the most reports belonged to: Outside Fires (46.7%), and Structure Fires (36.6%).
Fire incident types reported to NFIRS in Zip Code 30710


 Nearest zip codes: 30756, 37302, 30755, 37311, 30721, 37315.


 Based on the data from the years 2002 - 2018 the average number of fires per year is 22. The highest number of fire incidents - 46 took place in 2002, and the least - 1 in 2009. The data has a decreasing trend.
 When looking into fire subcategories, the most reports belonged to: Outside Fires (46.7%), and Structure Fires (36.6%).