Estimated zip code population in 2022: 4,726 Zip code population in 2010: 2,981 Zip code population in 2000: 2,083
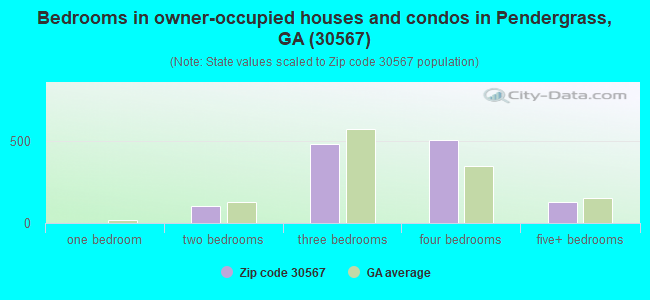
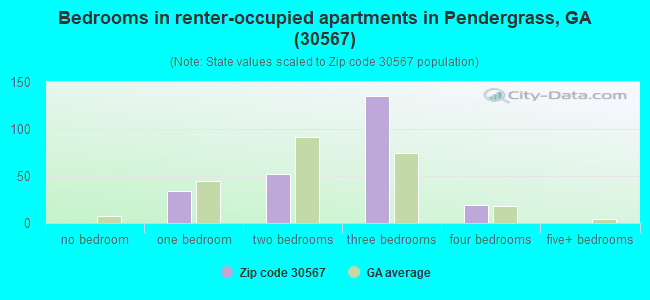
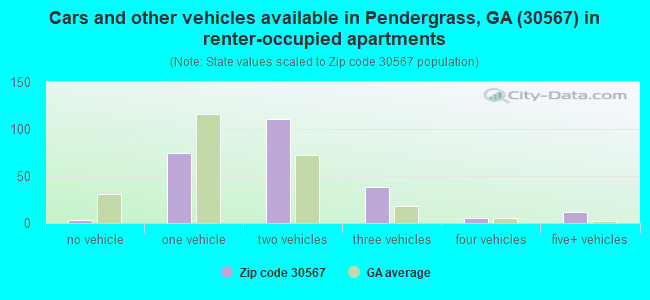
Houses and condos: 1,533 Renter-occupied apartments: 239
% of renters here:
16%
State:
34%
March 2022 cost of living index in zip code 30567: 82.9 (low, U.S. average is 100)
Land area: 31.3 sq. mi. Water area: 0.3 sq. mi.
Population density: 151 people per square mile
(very low).
OSM Map
General Map
Google Map
MSN Map
OSM Map
General Map
Google Map
MSN Map
OSM Map
General Map
Google Map
MSN Map
OSM Map
General Map
Google Map
MSN Map
Please wait while loading the map...
Real estate property taxes paid for housing units in 2022:
This zip code:
0.8% ($2,590)
Georgia:
0.7% ($2,160)
Median real estate property taxes paid for housing units with mortgages in 2022: $3,050 (0.9%) Median real estate property taxes paid for housing units with no mortgage in 2022: $1,339 (0.5%)
Business Search- 14 Million verified businesses
Males: 2,531
(53.6%)
Females: 2,193
(46.4%)
For population 25 years and over in 30567:
High school or higher: 87.5%
Bachelor's degree or higher: 18.1%
Graduate or professional degree: 8.9%
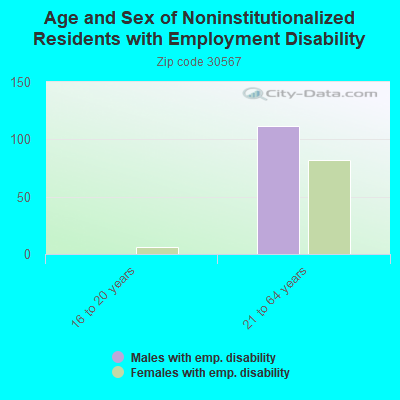
Unemployed: 2.0%
Mean travel time to work (commute): 31.6 minutes
For population 15 years and over in 30567:
Never married: 25.3%
Now married: 59.0%
Separated: 2.2%
Widowed: 3.5%
Divorced: 10.0%
Zip code 30567 compared to state average:
Unemployed percentage below state average.
Black race population percentage significantly below state average.
Foreign-born population percentage above state average.
Renting percentage below state average.
Number of college students below state average.
Percentage of population with a bachelor's degree or higher below state average.
Averages for the 2020 tax year for zip code 30567, filed in 2021:
Average Adjusted Gross Income (AGI) in 2020: $64,647 (Individual Income Tax Returns)
Here:
$64,647
State:
$70,847
Salary/wage: $55,609 (reported on 86.6% of returns)
Here:
$55,609
State:
$59,126
(% of AGI for various income ranges: 1172.4% for AGIs below $25k, 3771.3% for AGIs $25k-50k, 6940.7% for AGIs $50k-75k, 10037.5% for AGIs $75k-100k, 17655.7% for AGIs $100k-200k, 63385.0% for AGIs over 200k)
Taxable interest for individuals: $973 (reported on 20.1% of returns)
This zip code:
$973
Georgia:
$2,011
(% of AGI for various income ranges: 15.3% for AGIs below $25k, 14.3% for AGIs $25k-50k, 18.9% for AGIs $50k-75k, 29.4% for AGIs $75k-100k, 38.1% for AGIs $100k-200k, 580.0% for AGIs over 200k)
Ordinary dividends: $2,585 (reported on 12.1% of returns)
Here:
$2,585
State:
$8,996
(% of AGI for various income ranges: 9.2% for AGIs below $25k, 18.0% for AGIs $25k-50k, 61.1% for AGIs $50k-75k, 36.2% for AGIs $75k-100k, 128.1% for AGIs $100k-200k, 380.0% for AGIs over 200k)
Net capital gain/loss in AGI: +$13,552 (reported on 10.3% of returns)
Here:
+$13,552
State:
+$28,402
(% of AGI for various income ranges: 8.4% for AGIs below $25k, 50.4% for AGIs $50k-75k, 58.8% for AGIs $75k-100k, 461.9% for AGIs $100k-200k, 9375.0% for AGIs over 200k)
Profit/loss from business: +$7,089 (reported on 20.1% of returns)
Here:
+$7,089
State:
+$6,707
(% of AGI for various income ranges: 91.0% for AGIs below $25k, 191.3% for AGIs $25k-50k, 190.7% for AGIs $50k-75k, 210.6% for AGIs $75k-100k, 473.3% for AGIs $100k-200k)
Taxable individual retirement arrangement distribution: $19,807 (reported on 6.2% of returns)
30567:
$19,807
Georgia:
$20,525
(% of AGI for various income ranges: 35.5% for AGIs below $25k, 118.7% for AGIs $25k-50k, 256.9% for AGIs $75k-100k, 778.6% for AGIs $100k-200k)
Total itemized deductions: $29,370 (reported on 8.9% of returns)
Here:
$29,370
State:
$34,001
(% of AGI for various income ranges: 175.4% for AGIs $25k-50k, 245.6% for AGIs $50k-75k, 365.6% for AGIs $75k-100k, 1064.8% for AGIs $100k-200k, 7915.0% for AGIs over 200k)
Charity contributions: $12,306 (reported on 7.1% of returns)
Here:
$12,306
State:
$14,164
(% of AGI for various income ranges: 27.2% for AGIs $25k-50k, 82.6% for AGIs $50k-75k, 308.1% for AGIs $100k-200k, 4870.0% for AGIs over 200k)
Taxes paid: $7,270 (reported on 8.9% of returns)
30567:
$7,270
State:
$7,540
(% of AGI for various income ranges: 34.8% for AGIs $25k-50k, 80.0% for AGIs $50k-75k, 112.5% for AGIs $75k-100k, 291.4% for AGIs $100k-200k, 1430.0% for AGIs over 200k)
Earned income credit: $2,292 (reported on 17.0% of returns)
Here:
$2,292
State:
$2,530
(% of AGI for various income ranges: 97.6% for AGIs below $25k, 81.1% for AGIs $25k-50k)
Percentage of individuals using paid preparers for their 2020 taxes: 93.3%
Here:
93%
State:
93%
(% for various income ranges: 92.4% for AGIs below $25k, 92.9% for AGIs $25k-50k, 94.6% for AGIs $50k-75k, 91.3% for AGIs $75k-100k, 94.4% for AGIs $100k-200k, 100.0% for AGIs over 200k)
Averages for the 2012 tax year for zip code 30567, filed in 2013:
Average Adjusted Gross Income (AGI) in 2012: $47,550 (Individual Income Tax Returns)
Here:
$47,550
State:
$56,131
Salary/wage: $44,035 (reported on 83.6% of returns)
Here:
$44,035
State:
$47,942
(% of AGI for various income ranges: 79.5% for AGIs below $25k, 80.9% for AGIs $25k-50k, 81.1% for AGIs $50k-75k, 80.0% for AGIs $75k-100k, 70.6% for AGIs $100k-200k, 74.4% for AGIs over 200k)
Taxable interest for individuals: $876 (reported on 24.6% of returns)
This zip code:
$876
Georgia:
$1,706
(% of AGI for various income ranges: 1.3% for AGIs below $25k, 0.2% for AGIs $25k-50k, 0.2% for AGIs $50k-75k, 0.6% for AGIs $75k-100k, 0.6% for AGIs $100k-200k)
Ordinary dividends: $1,883 (reported on 13.4% of returns)
Here:
$1,883
State:
$7,265
(% of AGI for various income ranges: 0.3% for AGIs below $25k, 0.2% for AGIs $25k-50k, 0.5% for AGIs $50k-75k, 1.2% for AGIs $75k-100k, 0.6% for AGIs $100k-200k)
Net capital gain/loss in AGI: +$292 (reported on 9.0% of returns)
Here:
+$292
State:
+$16,323
(% of AGI for various income ranges: 0.2% for AGIs $75k-100k, 0.1% for AGIs $100k-200k)
Profit/loss from business: +$5,358 (reported on 17.9% of returns)
Here:
+$5,358
State:
+$7,583
(% of AGI for various income ranges: 6.7% for AGIs below $25k, 2.3% for AGIs $25k-50k, 2.1% for AGIs $50k-75k, 2.4% for AGIs $75k-100k, 0.1% for AGIs $100k-200k)
Taxable individual retirement arrangement distribution: $16,218 (reported on 8.2% of returns)
30567:
$16,218
Georgia:
$17,199
(% of AGI for various income ranges: 3.4% for AGIs $25k-50k, 6.2% for AGIs $50k-75k, 4.5% for AGIs $100k-200k)
Total itemized deductions: $21,333 (25% of AGI, reported on 34.3% of returns)
Here:
$21,333
State:
$23,886
Here:
24.8% of AGI
State:
21.5% of AGI
(% of AGI for various income ranges: 10.1% for AGIs below $25k, 13.3% for AGIs $25k-50k, 16.4% for AGIs $50k-75k, 18.5% for AGIs $75k-100k, 16.8% for AGIs $100k-200k, 14.2% for AGIs over 200k)
Charity contributions: $3,918 (reported on 29.1% of returns)
Here:
$3,918
State:
$5,507
(% of AGI for various income ranges: 1.1% for AGIs below $25k, 1.5% for AGIs $25k-50k, 2.8% for AGIs $50k-75k, 2.4% for AGIs $75k-100k, 3.4% for AGIs $100k-200k, 2.5% for AGIs over 200k)
Taxes paid: $6,496 (reported on 34.3% of returns)
30567:
$6,496
State:
$7,838
(% of AGI for various income ranges: 1.8% for AGIs below $25k, 2.4% for AGIs $25k-50k, 4.5% for AGIs $50k-75k, 5.7% for AGIs $75k-100k, 6.0% for AGIs $100k-200k, 7.0% for AGIs over 200k)
Earned income credit: $2,277 (reported on 23.1% of returns)
Here:
$2,277
State:
$2,589
(% of AGI for various income ranges: 7.8% for AGIs below $25k, 1.4% for AGIs $25k-50k)
Percentage of individuals using paid preparers for their 2012 taxes: 51.5%
Here:
51%
State:
55%
(% for various income ranges: 46.4% for AGIs below $25k, 53.1% for AGIs $25k-50k, 55.6% for AGIs $50k-75k, 50.0% for AGIs $75k-100k, 75.0% for AGIs $100k-200k)
Averages for the 2004 tax year for zip code 30567, filed in 2005:
Average Adjusted Gross Income (AGI) in 2004: $42,294 (Individual Income Tax Returns)
Here:
$42,294
State:
$47,553
Salary/wage: $37,430 (reported on 86.2% of returns)
Here:
$37,430
State:
$42,178
(% of AGI for various income ranges: 83.2% for AGIs below $10k, 75.5% for AGIs $10k-25k, 83.0% for AGIs $25k-50k, 83.7% for AGIs $50k-75k, 84.6% for AGIs $75k-100k, 59.7% for AGIs over 100k)
Taxable interest for individuals: $1,409 (reported on 35.2% of returns)
This zip code:
$1,409
Georgia:
$1,772
(% of AGI for various income ranges: 5.3% for AGIs below $10k, 1.1% for AGIs $10k-25k, 0.9% for AGIs $25k-50k, 0.4% for AGIs $50k-75k, 0.7% for AGIs $75k-100k, 2.0% for AGIs over 100k)
Taxable dividends: $902 (reported on 11.8% of returns)
Here:
$902
State:
$4,283
(% of AGI for various income ranges: 0.7% for AGIs below $10k, 0.3% for AGIs $10k-25k, 0.2% for AGIs $25k-50k, 0.2% for AGIs $50k-75k, 0.2% for AGIs $75k-100k, 0.3% for AGIs over 100k)
Net capital gain/loss: +$16,958 (reported on 8.5% of returns)
Here:
+$16,958
State:
+$16,461
(% of AGI for various income ranges: 0.2% for AGIs $10k-25k, 0.3% for AGIs $25k-50k, 0.5% for AGIs $50k-75k, 0.5% for AGIs $75k-100k, 11.5% for AGIs over 100k)
Profit/loss from business: +$6,079 (reported on 20.4% of returns)
Here:
+$6,079
State:
+$8,201
(% of AGI for various income ranges: 12.5% for AGIs below $10k, 10.6% for AGIs $10k-25k, 2.8% for AGIs $25k-50k, 3.5% for AGIs $50k-75k, -0.4% for AGIs $75k-100k, 1.0% for AGIs over 100k)
Total itemized deductions: $18,380 (25% of AGI, reported on 35.6% of returns)
Here:
$18,380
State:
$19,944
Here:
25.2% of AGI
State:
22.6% of AGI
(% of AGI for various income ranges: 8.1% for AGIs below $10k, 10.4% for AGIs $10k-25k, 15.1% for AGIs $25k-50k, 17.8% for AGIs $50k-75k, 18.0% for AGIs $75k-100k, 14.7% for AGIs over 100k)
Charity contributions deductions: $3,671 (5% of AGI, reported on 30.2% of returns)
Here:
$3,671
State:
$4,354
Here:
4.8% of AGI
State:
4.7% of AGI
(% of AGI for various income ranges: 1.5% for AGIs $10k-25k, 1.8% for AGIs $25k-50k, 2.6% for AGIs $50k-75k, 3.1% for AGIs $75k-100k, 3.6% for AGIs over 100k)
Total tax: $5,565 (reported on 74.1% of returns)
30567:
$5,565
State:
$8,223
(% of AGI for various income ranges: 3.3% for AGIs below $10k, 5.0% for AGIs $10k-25k, 6.3% for AGIs $25k-50k, 7.6% for AGIs $50k-75k, 9.3% for AGIs $75k-100k, 16.7% for AGIs over 100k)
Earned income credit: $1,876 (reported on 19.4% of returns)
Here:
$1,876
State:
$1,986
Percentage of individuals using paid preparers for their 2004 taxes: 64.6%
Here:
65%
State:
62%
(% for various income ranges: 56.6% for AGIs below $10k, 68.3% for AGIs $10k-25k, 66.0% for AGIs $25k-50k, 65.3% for AGIs $50k-75k, 67.3% for AGIs $75k-100k, 65.2% for AGIs over 100k)
Household received Food Stamps/SNAP in the past 12 months: 223 Household did not receive Food Stamps/SNAP in the past 12 months: 1,229
Women who had a birth in the past 12 months: 6 (6 now married, 0 unmarried) Women who did not have a birth in the past 12 months: 1,133 (580 now married, 551 unmarried)
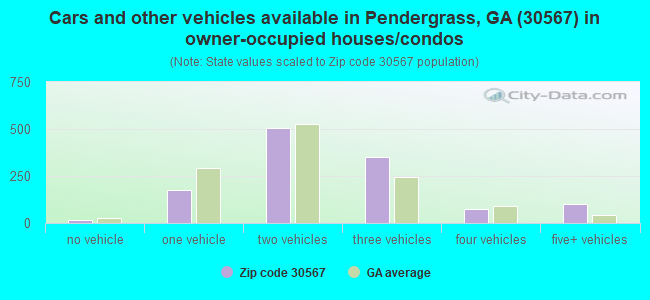
Housing units in zip code 30567 with a mortgage: 869 (101 second mortgage, 107 both second mortgage and home equity loan) Houses without a mortgage: 51
Median monthly owner costs for units with a mortgage: $1,706 Median monthly owner costs for units without a mortgage: $439
Residents with income below the poverty level in 2022:
This zip code:
10.5%
Whole state:
12.7%
Residents with income below 50% of the poverty level in 2022:
This zip code:
7.2%
Whole state:
6.3%
Median number of rooms in houses and condos:
Here:
6.5
State:
6.8
Median number of rooms in apartments:
Here:
5.7
State:
4.6
Notable locations in this zip code not listed on our city pages
Notable locations in zip code 30567: North Jackson Fire Department Station 1 (A), Plainview Volunteer Fire Department (B), North Jackson Fire Department Station 3 (C). Display/hide their locations on the map
Churches in zip code 30567 include: Pendergrass Baptist Church (A), Talmo Baptist Church (B), Holly Springs Church (C), Mountain Creek Church (D), Center Grove Church (E), Cave Springs Church (F). Display/hide their locations on the map
Cemeteries: Cave Springs Cemetery (1), Center Grove Cemetery (2), Holly Springs Cemetery (3), Mountain Creek Cemetery (4), Pendergrass City Cemetery (5), Talmo Cemetery (6). Display/hide their locations on the map
1,106 married couples with children.
279 single-parent households (200 men, 79 women).
80.0% of residents of 30567 zip code speak English at home.
13.5% of residents speak Spanish at home (53% very well, 33% well, 8% not well, 6% not at all).
0.5% of residents speak other Indo-European language at home (100% very well).
3.2% of residents speak Asian or Pacific Island language at home (38% very well, 6% well, 45% not well, 11% not at all).
1.6% of residents speak other language at home (100% very well).
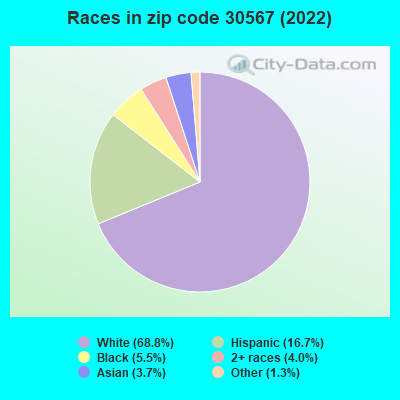
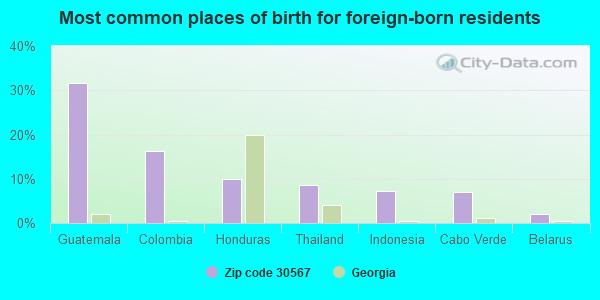
Foreign born population: 755 (16.0%) (52.0% of them are naturalized citizens)
This zip code:
16.0%
Whole state:
10.7%
32%Guatemala
16%Colombia
10%Honduras
8%Thailand
7%Indonesia
7%Cabo Verde
2%Belarus
17%English
15%American
6%Irish
6%South African
4%British
4%European
4%German
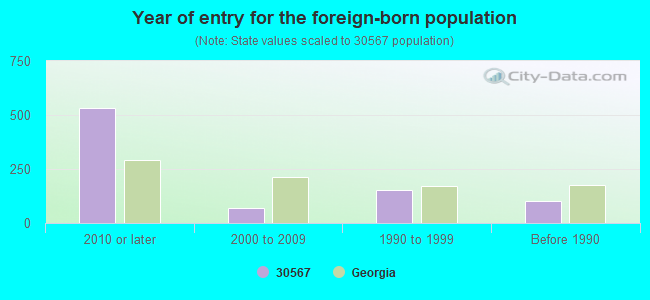
Year of entry for the foreign-born population
5342010 or later
682000 to 2009
1541990 to 1999
100Before 1990
Facilities with environmental interests located in this zip code:
CATERPILLAR INC (420 JOHN B BROOKS ROAD in PENDERGRASS, GA)
AIR MINOR (AIRS/AFS) (Resource Conservation and Recovery Act (tracking hazardous waste)) Business SIC classification: INTERNAL COMBUSTION ENGINES Alternative names: CATERPILLAR INC JEFFERSON PLNT
(Resource Conservation and Recovery Act (tracking hazardous waste)) Organizations: EXXONMOBIL OIL CORPORATION (CONTACT/OPERATOR)
, BRIDGES BENJAMIN BLAKE (CONTACT/OWNER)
Alternative names: EXXON CO USA 45048
PROFILE LAMPS INC (5786 HWY 129 NORTH in PENDERGRASS, GA)
(Resource Conservation and Recovery Act (tracking hazardous waste)) Organizations: SEAMAN JEFFERY (CONTACT/OWNER)
Alternative names: PROFILES
MISSION FOODS (225 JOHN BROOKS RD in PENDERGRASS, GA)
National Pollutant Discharge Elimination System NON-MAJOR (Tracking pollutant discharge elimination systems) - permit Business SIC classification: POTATO CHIPS, CORN CHIPS, AND SIMILAR SNACKS
M M SYSTEMS CORPORATION (50 M M WAY in PENDERGRASS, GA)
Small Quantity Generators, between 100 kg and 1000 kg of hazardous waste/month (Resource Conservation and Recovery Act (tracking hazardous waste)) - notification Organizations: MIKE ATTAWAY (CONTACT/OWNER)
MM SYSTEMS CORP (220 HENRY D ROBINSON in PENDERGRASS, GA)
AIR SYNTHETIC MINOR (AIRS/AFS) Business SIC classification: MISCELLANEOUS STRUCTURAL METALWORK
JEFFERSON BLANKING INC (234 S HOLLAND DR in PENDERGRASS, GA)
TRI REPORTER (Tracking of toxic chemicals releasing facilities) Business SIC classification: AUTOMOTIVE STAMPINGS
MISSION FOODS JEFFERSON (225 JOHN B. BROOKS RD. in PENDERGRASS, GA)
TRI REPORTER (Tracking of toxic chemicals releasing facilities) Business SIC classification: POTATO CHIPS, CORN CHIPS, AND SIMILAR SNACKS; FOOD PREPARATIONS
Housing units lacking complete plumbing facilities: 3.0% Housing units lacking complete kitchen facilities: 3.1%
67.5%Electricity
20.1%Utility gas
6.7%Bottled, tank, or LP gas
2.5%Solar energy
2.4%Wood
0.6%Other fuel
Population in 1990: 1,956. Population change in the 1990s: +127 (+6.5%).
Place of birth for U.S.-born residents:
This state: 2,693
Northeast: 106
Midwest: 136
South: 708
West: 277
66% of the 30567 zip code residents lived in the same house 5 years ago. Out of people who lived in different houses, 46% lived in this county. Out of people who lived in different counties, 50% lived in Georgia.
88% of the 30567 zip code residents lived in the same house 1 year ago. Out of people who lived in different houses, 22% moved from this county. Out of people who lived in different houses, 67% moved from different county within same state. Out of people who lived in different houses, 11% moved from different state.
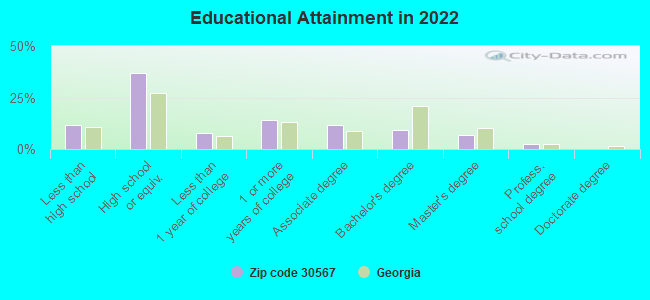
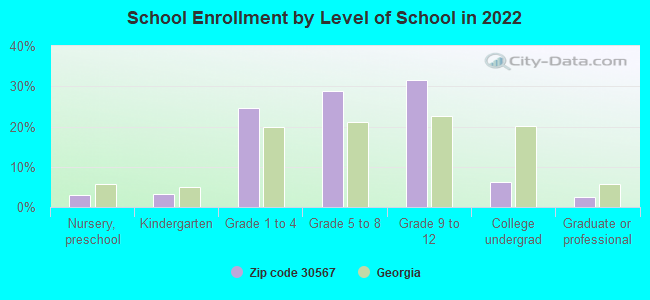
Private vs. public school enrollment:
Students in private schools in grades 1 to 8 (elementary and middle school): 14
Here:
1.9%
Georgia:
12.1%
Students in private schools in grades 9 to 12 (high school):
Here:
0.0%
Georgia:
10.8%
Students in private undergraduate colleges: 33
Here:
37.0%
Georgia:
17.1%
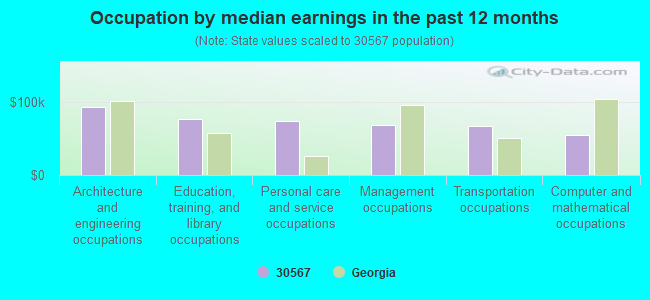
Occupation by median earnings in the past 12 months ($)
94,323Architecture and engineering occupations
77,763Education, training, and library occupations
73,821Personal care and service occupations
68,420Management occupations
67,458Transportation occupations
55,394Computer and mathematical occupations
Top industries in this zip code by the number of employees in 2005:
Management of Companies and Enterprises: Offices of Other Holding Companies (50-99 employees: 1 establishment)
Wholesale Trade: Other Chemical and Allied Products Merchant Wholesalers (20-49: 1, 1-4: 2)
Fatal accident statistics in 2010:
Fatal accident count: 1
Vehicles involved in fatal accidents: 1
Fatal accidents caused by drunken drivers: 1
Fatalities: 1
Persons involved in fatal accidents: 1
Pedestrians involved in fatal accidents: 0
2002 - 2018 National Fire Incident Reporting System (NFIRS) incidents
Based on the data from the years 2002 - 2018 the average number of fire incidents per year is 14. The highest number of fires - 40 took place in 2017, and the least - 0 in 2006. The data has an increasing trend.
When looking into fire subcategories, the most reports belonged to: Outside Fires (45.5%), and Structure Fires (40.4%).
Fire incident types reported to NFIRS in Zip Code 30567

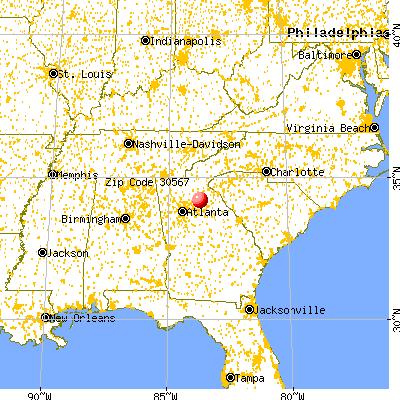


 Nearest zip codes: 30575, 30543, 30507, 30549, 30548, 30517.
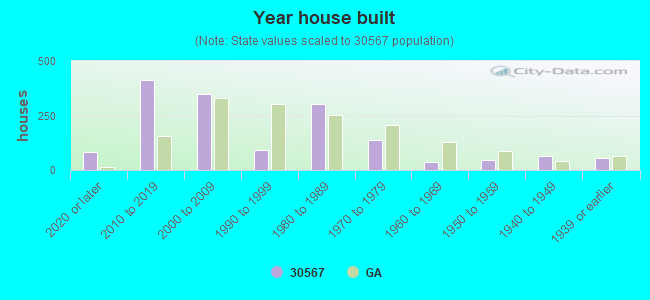


 Based on the data from the years 2002 - 2018 the average number of fire incidents per year is 14. The highest number of fires - 40 took place in 2017, and the least - 0 in 2006. The data has an increasing trend.
 When looking into fire subcategories, the most reports belonged to: Outside Fires (45.5%), and Structure Fires (40.4%).