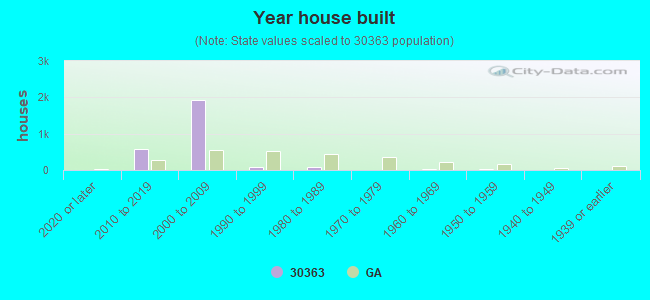
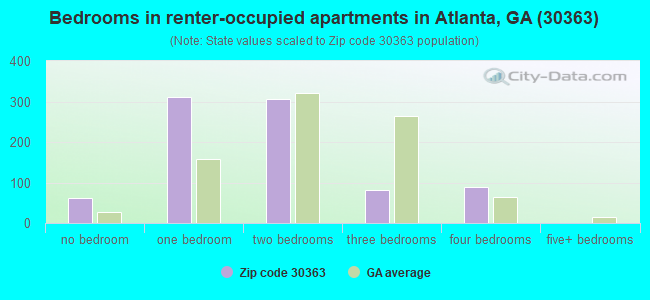
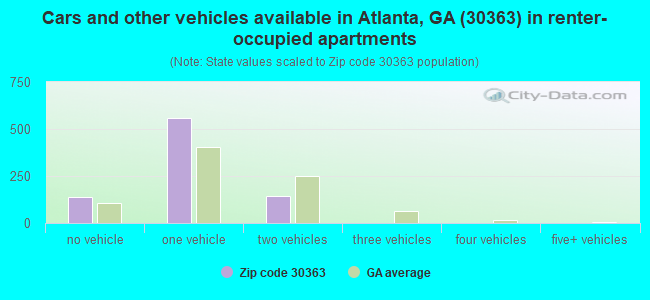
Houses and condos: 2,597 Renter-occupied apartments: 852
% of renters here:
40%
State:
34%
March 2022 cost of living index in zip code 30363: 92.2 (less than average, U.S. average is 100)
Land area: 0.3 sq. mi. Water area: 0.0 sq. mi.
Population density: 10,589 people per square mile
(high).
OSM Map
Google Map
MSN Map
OSM Map
General Map
Google Map
MSN Map
OSM Map
Google Map
MSN Map
OSM Map
Google Map
MSN Map
Please wait while loading the map...
Real estate property taxes paid for housing units in 2022:
This zip code:
1.1% ($4,955)
Georgia:
0.7% ($2,160)
Median real estate property taxes paid for housing units with mortgages in 2022: $4,982 (1.2%) Median real estate property taxes paid for housing units with no mortgage in 2022: $4,851 (0.9%)
Estimated median house/condo value in 2022: $432,857
30363:
$432,857
Georgia:
$297,400
According to our research of Georgia and other state lists, there were 3 registered sex offenders living in 30363 zip code as of May 23, 2024. The ratio of all residents to sex offenders in zip code 30363 is 1,036 to 1. The ratio of registered sex offenders to all residents in this zip code is much lower than the state average.
Median resident age:
This zip code:
33.6 years
Georgia median age:
37.6 years
Average household size:
This zip code:
1.6 people
Georgia:
2.6 people
Averages for the 2020 tax year for zip code 30363, filed in 2021:
Average Adjusted Gross Income (AGI) in 2020: $119,745 (Individual Income Tax Returns)
Here:
$119,745
State:
$70,847
Salary/wage: $98,923 (reported on 89.6% of returns)
Here:
$98,923
State:
$59,126
(% of AGI for various income ranges: 1165.7% for AGIs below $25k, 4203.6% for AGIs $25k-50k, 8057.7% for AGIs $50k-75k, 11773.1% for AGIs $75k-100k, 17316.2% for AGIs $100k-200k, 163422.5% for AGIs over 200k)
Taxable interest for individuals: $2,765 (reported on 29.5% of returns)
This zip code:
$2,765
Georgia:
$2,011
(% of AGI for various income ranges: 3.9% for AGIs below $25k, 27.1% for AGIs $25k-50k, 27.3% for AGIs $50k-75k, 18.8% for AGIs $75k-100k, 86.2% for AGIs $100k-200k, 2630.0% for AGIs over 200k)
Ordinary dividends: $5,478 (reported on 28.3% of returns)
Here:
$5,478
State:
$8,996
(% of AGI for various income ranges: 30.4% for AGIs below $25k, 27.9% for AGIs $25k-50k, 22.7% for AGIs $50k-75k, 28.7% for AGIs $75k-100k, 176.2% for AGIs $100k-200k, 5137.5% for AGIs over 200k)
Net capital gain/loss in AGI: +$40,887 (reported on 30.1% of returns)
Here:
+$40,887
State:
+$28,402
(% of AGI for various income ranges: 33.9% for AGIs below $25k, 60.7% for AGIs $25k-50k, 42.7% for AGIs $50k-75k, 99.4% for AGIs $75k-100k, 607.1% for AGIs $100k-200k, 48670.0% for AGIs over 200k)
Profit/loss from business: +$12,581 (reported on 24.3% of returns)
Here:
+$12,581
State:
+$6,707
(% of AGI for various income ranges: 148.9% for AGIs below $25k, 31.8% for AGIs $25k-50k, 182.7% for AGIs $50k-75k, 165.0% for AGIs $75k-100k, 789.5% for AGIs $100k-200k, 6135.0% for AGIs over 200k)
Taxable individual retirement arrangement distribution: $10,500 (reported on 2.3% of returns)
30363:
$10,500
Georgia:
$20,525
(% of AGI for various income ranges: 200.0% for AGIs $100k-200k)
Total itemized deductions: $33,386 (reported on 20.2% of returns)
Here:
$33,386
State:
$34,001
(% of AGI for various income ranges: 222.1% for AGIs $25k-50k, 357.3% for AGIs $50k-75k, 741.9% for AGIs $75k-100k, 1440.0% for AGIs $100k-200k, 15165.0% for AGIs over 200k)
Charity contributions: $12,239 (reported on 16.2% of returns)
Here:
$12,239
State:
$14,164
(% of AGI for various income ranges: 60.7% for AGIs below $25k, 77.7% for AGIs $50k-75k, 155.0% for AGIs $75k-100k, 315.7% for AGIs $100k-200k, 5437.5% for AGIs over 200k)
Taxes paid: $8,443 (reported on 20.2% of returns)
30363:
$8,443
State:
$7,540
(% of AGI for various income ranges: 56.4% for AGIs $25k-50k, 127.3% for AGIs $50k-75k, 247.5% for AGIs $75k-100k, 531.0% for AGIs $100k-200k, 2515.0% for AGIs over 200k)
Earned income credit: $1,514 (reported on 8.1% of returns)
Here:
$1,514
State:
$2,530
(% of AGI for various income ranges: 56.1% for AGIs below $25k, 19.6% for AGIs $25k-50k)
Percentage of individuals using paid preparers for their 2020 taxes: 94.2%
Here:
94%
State:
93%
(% for various income ranges: 91.7% for AGIs below $25k, 94.4% for AGIs $25k-50k, 90.3% for AGIs $50k-75k, 95.7% for AGIs $75k-100k, 96.9% for AGIs $100k-200k, 100.0% for AGIs over 200k)
Averages for the 2012 tax year for zip code 30363, filed in 2013:
Average Adjusted Gross Income (AGI) in 2012: $81,987 (Individual Income Tax Returns)
Here:
$81,987
State:
$56,131
Salary/wage: $73,639 (reported on 92.1% of returns)
Here:
$73,639
State:
$47,942
(% of AGI for various income ranges: 93.0% for AGIs below $25k, 96.6% for AGIs $25k-50k, 90.6% for AGIs $50k-75k, 92.8% for AGIs $75k-100k, 88.9% for AGIs $100k-200k, 66.7% for AGIs over 200k)
Taxable interest for individuals: $507 (reported on 28.0% of returns)
This zip code:
$507
Georgia:
$1,706
(% of AGI for various income ranges: 0.2% for AGIs below $25k, 0.1% for AGIs $25k-50k, 0.1% for AGIs $50k-75k, 0.3% for AGIs $100k-200k, 0.2% for AGIs over 200k)
Ordinary dividends: $6,922 (reported on 19.5% of returns)
Here:
$6,922
State:
$7,265
(% of AGI for various income ranges: 0.6% for AGIs below $25k, 2.0% for AGIs $25k-50k, 3.6% for AGIs $50k-75k, 2.6% for AGIs $75k-100k, 0.7% for AGIs $100k-200k, 1.2% for AGIs over 200k)
Net capital gain/loss in AGI: +$10,084 (reported on 15.2% of returns)
Here:
+$10,084
State:
+$16,323
(% of AGI for various income ranges: 0.1% for AGIs $50k-75k, 0.1% for AGIs $75k-100k, 0.4% for AGIs $100k-200k, 5.0% for AGIs over 200k)
Profit/loss from business: +$6,945 (reported on 18.9% of returns)
Here:
+$6,945
State:
+$7,583
(% of AGI for various income ranges: 0.3% for AGIs below $25k, 0.3% for AGIs $25k-50k, 2.6% for AGIs $50k-75k, 2.5% for AGIs $75k-100k, 2.0% for AGIs $100k-200k, 1.2% for AGIs over 200k)
Taxable individual retirement arrangement distribution: $13,050 (reported on 2.4% of returns)
30363:
$13,050
Georgia:
$17,199
Total itemized deductions: $21,522 (16% of AGI, reported on 42.1% of returns)
Here:
$21,522
State:
$23,886
Here:
15.7% of AGI
State:
21.5% of AGI
(% of AGI for various income ranges: 8.0% for AGIs below $25k, 10.2% for AGIs $25k-50k, 13.0% for AGIs $50k-75k, 11.6% for AGIs $75k-100k, 13.5% for AGIs $100k-200k, 8.9% for AGIs over 200k)
Charity contributions: $3,994 (reported on 30.5% of returns)
Here:
$3,994
State:
$5,507
(% of AGI for various income ranges: 1.1% for AGIs below $25k, 1.7% for AGIs $25k-50k, 1.8% for AGIs $50k-75k, 1.8% for AGIs $75k-100k, 1.8% for AGIs $100k-200k, 1.0% for AGIs over 200k)
Taxes paid: $8,963 (reported on 41.5% of returns)
30363:
$8,963
State:
$7,838
(% of AGI for various income ranges: 1.7% for AGIs below $25k, 2.1% for AGIs $25k-50k, 3.4% for AGIs $50k-75k, 3.9% for AGIs $75k-100k, 5.8% for AGIs $100k-200k, 5.3% for AGIs over 200k)
Earned income credit: $1,607 (reported on 8.5% of returns)
Here:
$1,607
State:
$2,589
(% of AGI for various income ranges: 4.2% for AGIs below $25k)
Percentage of individuals using paid preparers for their 2012 taxes: 43.3%
Here:
43%
State:
55%
(% for various income ranges: 40.9% for AGIs below $25k, 34.2% for AGIs $25k-50k, 43.3% for AGIs $50k-75k, 41.2% for AGIs $75k-100k, 50.0% for AGIs $100k-200k, 77.8% for AGIs over 200k)
Averages for the 2004 tax year for zip code 30363, filed in 2005:
Average Adjusted Gross Income (AGI) in 2004: $63,469 (Individual Income Tax Returns)
Here:
$63,469
State:
$47,553
Salary/wage: $55,375 (reported on 93.1% of returns)
Here:
$55,375
State:
$42,178
(% of AGI for various income ranges: 104.0% for AGIs below $10k, 96.9% for AGIs $10k-25k, 98.6% for AGIs $25k-50k, 93.9% for AGIs $50k-75k, 95.4% for AGIs $75k-100k, 63.7% for AGIs over 100k)
Taxable interest for individuals: $844 (reported on 39.2% of returns)
This zip code:
$844
Georgia:
$1,772
(% of AGI for various income ranges: 0.2% for AGIs $10k-25k, 0.2% for AGIs $25k-50k, 0.1% for AGIs $50k-75k, 0.1% for AGIs $75k-100k, 1.0% for AGIs over 100k)
Taxable dividends: $789 (reported on 29.1% of returns)
Here:
$789
State:
$4,283
(% of AGI for various income ranges: 0.5% for AGIs $10k-25k, 0.2% for AGIs $25k-50k, 0.2% for AGIs $50k-75k, 0.4% for AGIs $75k-100k, 0.5% for AGIs over 100k)
Net capital gain/loss: +$5,193 (reported on 23.5% of returns)
Here:
+$5,193
State:
+$16,461
(% of AGI for various income ranges: -0.6% for AGIs below $10k, -0.4% for AGIs $25k-50k, -0.4% for AGIs $50k-75k, 4.5% for AGIs over 100k)
Total itemized deductions: $17,908 (18% of AGI, reported on 46.4% of returns)
Here:
$17,908
State:
$19,944
Here:
18.0% of AGI
State:
22.6% of AGI
(% of AGI for various income ranges: 9.6% for AGIs $10k-25k, 11.5% for AGIs $25k-50k, 16.3% for AGIs $50k-75k, 14.5% for AGIs $75k-100k, 12.7% for AGIs over 100k)
Charity contributions deductions: $2,370 (3% of AGI, reported on 36.0% of returns)
Here:
$2,370
State:
$4,354
Here:
2.7% of AGI
State:
4.7% of AGI
(% of AGI for various income ranges: 1.7% for AGIs $25k-50k, 1.6% for AGIs $50k-75k, 1.9% for AGIs $75k-100k, 1.1% for AGIs over 100k)
Total tax: $10,476 (reported on 90.1% of returns)
30363:
$10,476
State:
$8,223
(% of AGI for various income ranges: 4.0% for AGIs below $10k, 5.3% for AGIs $10k-25k, 10.5% for AGIs $25k-50k, 13.3% for AGIs $50k-75k, 14.4% for AGIs $75k-100k, 18.6% for AGIs over 100k)
Earned income credit: $2,067 (reported on 4.0% of returns)
Here:
$2,067
State:
$1,986
Percentage of individuals using paid preparers for their 2004 taxes: 41.9%
Here:
42%
State:
62%
(% for various income ranges: 46.2% for AGIs below $10k, 37.0% for AGIs $10k-25k, 39.0% for AGIs $25k-50k, 43.8% for AGIs $50k-75k, 42.4% for AGIs $75k-100k, 48.1% for AGIs over 100k)
Household received Food Stamps/SNAP in the past 12 months: 63 Household did not receive Food Stamps/SNAP in the past 12 months: 2,032
Women who did not have a birth in the past 12 months: 1,512 (551 now married, 961 unmarried)
Housing units in zip code 30363 with a mortgage: 1,112 (71 second mortgage, 75 both second mortgage and home equity loan) Median monthly owner costs for units with a mortgage: $2,454 Median monthly owner costs for units without a mortgage: $1,123
Residents with income below the poverty level in 2022:
This zip code:
10.6%
Whole state:
12.7%
Residents with income below 50% of the poverty level in 2022:
This zip code:
2.0%
Whole state:
6.3%
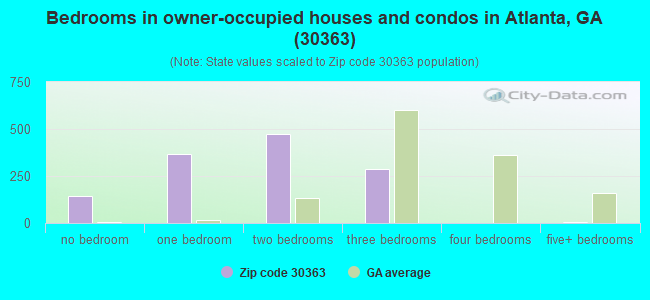
Median number of rooms in houses and condos:
Here:
3.3
State:
6.8
Median number of rooms in apartments:
Here:
3.4
State:
4.6
Notable locations in this zip code not listed on our city pages
Size of family households: 605 2-persons, 53 3-persons, 14 4-persons, 32 5-persons
Size of nonfamily households: 1,101 1-person, 303 2-persons
132 married couples with children.
65 single-parent households (65 women).
72.6% of residents of 30363 zip code speak English at home.
4.4% of residents speak Spanish at home (100% very well).
5.5% of residents speak other Indo-European language at home (100% very well).
16.9% of residents speak Asian or Pacific Island language at home (65% very well, 35% well).
0.9% of residents speak other language at home (100% very well).
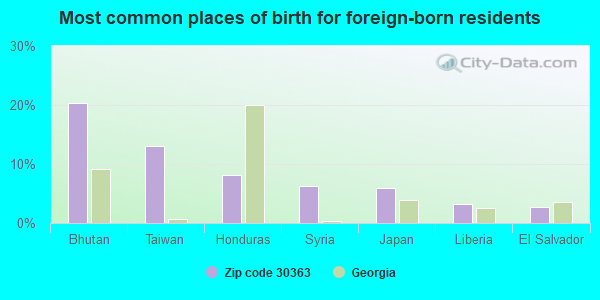
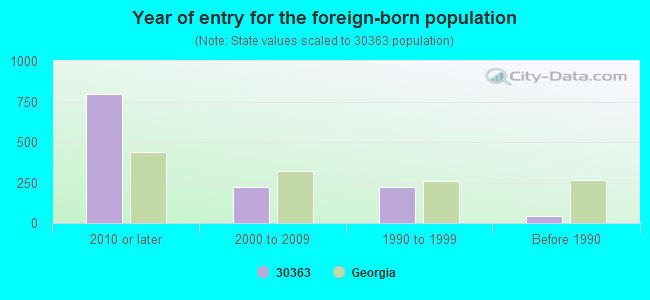
Foreign born population: 1,023 (30.7%) (32.5% of them are naturalized citizens)
This zip code:
30.7%
Whole state:
10.7%
20%Bhutan
13%Taiwan
8%Honduras
6%Syria
6%Japan
3%Liberia
3%El Salvador
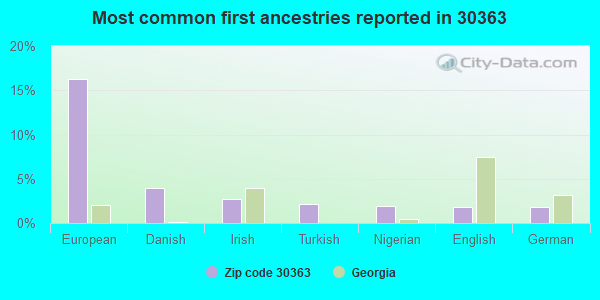
16%European
4%Danish
3%Irish
2%Turkish
2%Nigerian
2%English
2%German
Year of entry for the foreign-born population
7972010 or later
2252000 to 2009
2241990 to 1999
42Before 1990
There are 8 Medical Specialists in Zip Code 30363.Housing units lacking complete plumbing facilities: 1.4% Housing units lacking complete kitchen facilities: 1.4%
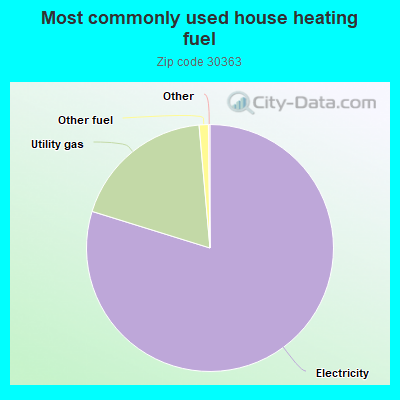
79.8%Electricity
18.8%Utility gas
1.2%Other fuel
Place of birth for U.S.-born residents:
This state: 413
Northeast: 286
Midwest: 510
South: 844
West: 125
85% of the 30363 zip code residents lived in the same house 1 year ago. Out of people who lived in different houses, 37% moved from this county. Out of people who lived in different houses, 33% moved from different county within same state. Out of people who lived in different houses, 15% moved from different state. Out of people who lived in different houses, 15% moved from abroad.
Private vs. public school enrollment:
Students in private schools in grades 1 to 8 (elementary and middle school):
Here:
0.0%
Georgia:
12.1%
Students in private schools in grades 9 to 12 (high school):
Here:
0.0%
Georgia:
10.8%
Students in private undergraduate colleges: 41
Here:
37.2%
Georgia:
17.1%
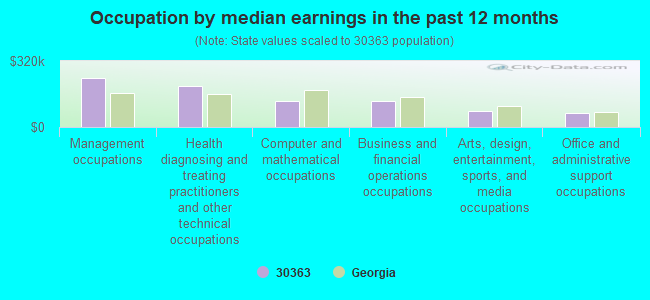
Occupation by median earnings in the past 12 months ($)
235,950Management occupations
197,244Health diagnosing and treating practitioners and other technical occupations
125,065Computer and mathematical occupations
124,001Business and financial operations occupations
76,966Arts, design, entertainment, sports, and media occupations
67,472Office and administrative support occupations
Top industries in this zip code by the number of employees in 2005:
Other Services (except Public Administration): Religious Organizations (100-249 employees: 1 establishment)
Other Services (except Public Administration): Civic and Social Organizations (100-249: 1)
Professional, Scientific, and Technical Services: Offices of Lawyers (20-49: 1)
Professional, Scientific, and Technical Services: Administrative Management and General Management Consulting Services (10-19: 1)
Accommodation and Food Services: Full-Service Restaurants (1-4: 2)
Fatal accident statistics in 2012:
Fatal accident count: 1
Vehicles involved in fatal accidents: 2
Fatal accidents caused by drunken drivers: 1
Fatalities: 1
Persons involved in fatal accidents: 1
Pedestrians involved in fatal accidents: 1
Fatal accident statistics in 2011:
Fatal accident count: 1
Vehicles involved in fatal accidents: 3
Fatal accidents caused by drunken drivers: 0
Fatalities: 1
Persons involved in fatal accidents: 5
Pedestrians involved in fatal accidents: 0
2009 - 2018 National Fire Incident Reporting System (NFIRS) incidents
According to the data from the years 2009 - 2018 the average number of fire incidents per year is 13. The highest number of fires - 29 took place in 2014, and the least - 1 in 2009. The data has a rising trend.
When looking into fire subcategories, the most incidents belonged to: Structure Fires (42.5%), and Mobile Property/Vehicle Fires (31.5%).
Fire incident types reported to NFIRS in Zip Code 30363


 According to the data from the years 2009 - 2018 the average number of fire incidents per year is 13. The highest number of fires - 29 took place in 2014, and the least - 1 in 2009. The data has a rising trend.
 When looking into fire subcategories, the most incidents belonged to: Structure Fires (42.5%), and Mobile Property/Vehicle Fires (31.5%).