Estimated zip code population in 2022: 34,941
Zip code population in 2010: 29,822
Zip code population in 2000: 31,330
Houses and condos: 12,789
Renter-occupied apartments: 5,003
% of renters here:
41%State:
34%
March 2022 cost of living index in zip code 30008: 101.5
(near average, U.S. average is 100)
Land area: 9.4
sq. mi.
Water area: 0.0
sq. mi.
Population density: 3,699 people per square mile (average).
OSM Map
General Map
Google Map
MSN Map
OSM Map
General Map
Google Map
MSN Map
OSM Map
General Map
Google Map
MSN Map
OSM Map
General Map
Google Map
MSN Map
Please wait while loading the map...
Real estate property taxes paid for housing units in 2022:
This zip code:
0.6% ($1,756)Georgia:
0.7% ($2,160)
Median real estate property taxes paid for housing units with mortgages in 2022: $1,920 (0.6%)
Median real estate property taxes paid for housing units with no mortgage in 2022: $1,040 (0.4%)
Profiles of local businesses
Business Search - 14 Million verified businesses
Males: 17,020 Females: 17,921
For population 25 years and over in 30008:
High school or higher: 81.4%Bachelor's degree or higher: 28.8%Graduate or professional degree: 11.0%Unemployed: 3.6%Mean travel time to work (commute): 29.4 minutes
For population 15 years and over in 30008:
Never married: 44.7%Now married: 35.2%Separated: 1.7%Widowed: 5.1%Divorced: 13.4%
Zip code 30008 compared to state average:
Hispanic race population percentage significantly above state average. Foreign-born population percentage significantly above state average. Length of stay since moving in significantly above state average. 14,825 42.4% Black 10,804 30.9% Hispanic or Latino 7,070 20.2% White 1,037 3.0% Asian 907 2.6% Two or more races 279 0.8% Some other race 10 0.03% American Indian 5 0.01% Native Hawaiian and Other
Data:
Median household income ($)
Median household income (% change since 2000)
Household income diversity
Ratio of average income to average house value (%)
Ratio of average income to average rent
Median household income ($) - White
Median household income ($) - Black or African American
Median household income ($) - Asian
Median household income ($) - Hispanic or Latino
Median household income ($) - American Indian and Alaska Native
Median household income ($) - Multirace
Median household income ($) - Other Race
Median household income for houses/condos with a mortgage ($)
Median household income for apartments without a mortgage ($)
Races - White alone (%)
Races - White alone (% change since 2000)
Races - Black alone (%)
Races - Black alone (% change since 2000)
Races - American Indian alone (%)
Races - American Indian alone (% change since 2000)
Races - Asian alone (%)
Races - Asian alone (% change since 2000)
Races - Hispanic (%)
Races - Hispanic (% change since 2000)
Races - Native Hawaiian and Other Pacific Islander alone (%)
Races - Native Hawaiian and Other Pacific Islander alone (% change since 2000)
Races - Two or more races (%)
Races - Two or more races (% change since 2000)
Races - Other race alone (%)
Races - Other race alone (% change since 2000)
Racial diversity
Unemployment (%)
Unemployment (% change since 2000)
Unemployment (%) - White
Unemployment (%) - Black or African American
Unemployment (%) - Asian
Unemployment (%) - Hispanic or Latino
Unemployment (%) - American Indian and Alaska Native
Unemployment (%) - Multirace
Unemployment (%) - Other Race
Population density (people per square mile)
Population - Males (%)
Population - Females (%)
Population - Males (%) - White
Population - Males (%) - Black or African American
Population - Males (%) - Asian
Population - Males (%) - Hispanic or Latino
Population - Males (%) - American Indian and Alaska Native
Population - Males (%) - Multirace
Population - Males (%) - Other Race
Population - Females (%) - White
Population - Females (%) - Black or African American
Population - Females (%) - Asian
Population - Females (%) - Hispanic or Latino
Population - Females (%) - American Indian and Alaska Native
Population - Females (%) - Multirace
Population - Females (%) - Other Race
Coronavirus confirmed cases (May 23, 2024)
Deaths caused by coronavirus (May 23, 2024)
Coronavirus confirmed cases (per 100k population) (May 23, 2024)
Deaths caused by coronavirus (per 100k population) (May 23, 2024)
Daily increase in number of cases (May 23, 2024)
Weekly increase in number of cases (May 23, 2024)
Cases doubled (in days) (May 23, 2024)
Hospitalized patients (Apr 18, 2022)
Negative test results (Apr 18, 2022)
Total test results (Apr 18, 2022)
COVID Vaccine doses distributed (per 100k population) (Sep 19, 2023)
COVID Vaccine doses administered (per 100k population) (Sep 19, 2023)
COVID Vaccine doses distributed (Sep 19, 2023)
COVID Vaccine doses administered (Sep 19, 2023)
Likely homosexual households (%)
Likely homosexual households (% change since 2000)
Likely homosexual households - Lesbian couples (%)
Likely homosexual households - Lesbian couples (% change since 2000)
Likely homosexual households - Gay men (%)
Likely homosexual households - Gay men (% change since 2000)
Cost of living index
Median gross rent ($)
Median contract rent ($)
Median monthly housing costs ($)
Median house or condo value ($)
Median house or condo value ($ change since 2000)
Mean house or condo value by units in structure - 1, detached ($)
Mean house or condo value by units in structure - 1, attached ($)
Mean house or condo value by units in structure - 2 ($)
Mean house or condo value by units in structure by units in structure - 3 or 4 ($)
Mean house or condo value by units in structure - 5 or more ($)
Mean house or condo value by units in structure - Boat, RV, van, etc. ($)
Mean house or condo value by units in structure - Mobile home ($)
Median house or condo value ($) - White
Median house or condo value ($) - Black or African American
Median house or condo value ($) - Asian
Median house or condo value ($) - Hispanic or Latino
Median house or condo value ($) - American Indian and Alaska Native
Median house or condo value ($) - Multirace
Median house or condo value ($) - Other Race
Median resident age
Resident age diversity
Median resident age - Males
Median resident age - Females
Median resident age - White
Median resident age - Black or African American
Median resident age - Asian
Median resident age - Hispanic or Latino
Median resident age - American Indian and Alaska Native
Median resident age - Multirace
Median resident age - Other Race
Median resident age - Males - White
Median resident age - Males - Black or African American
Median resident age - Males - Asian
Median resident age - Males - Hispanic or Latino
Median resident age - Males - American Indian and Alaska Native
Median resident age - Males - Multirace
Median resident age - Males - Other Race
Median resident age - Females - White
Median resident age - Females - Black or African American
Median resident age - Females - Asian
Median resident age - Females - Hispanic or Latino
Median resident age - Females - American Indian and Alaska Native
Median resident age - Females - Multirace
Median resident age - Females - Other Race
Commute - mean travel time to work (minutes)
Travel time to work - Less than 5 minutes (%)
Travel time to work - Less than 5 minutes (% change since 2000)
Travel time to work - 5 to 9 minutes (%)
Travel time to work - 5 to 9 minutes (% change since 2000)
Travel time to work - 10 to 19 minutes (%)
Travel time to work - 10 to 19 minutes (% change since 2000)
Travel time to work - 20 to 29 minutes (%)
Travel time to work - 20 to 29 minutes (% change since 2000)
Travel time to work - 30 to 39 minutes (%)
Travel time to work - 30 to 39 minutes (% change since 2000)
Travel time to work - 40 to 59 minutes (%)
Travel time to work - 40 to 59 minutes (% change since 2000)
Travel time to work - 60 to 89 minutes (%)
Travel time to work - 60 to 89 minutes (% change since 2000)
Travel time to work - 90 or more minutes (%)
Travel time to work - 90 or more minutes (% change since 2000)
Marital status - Never married (%)
Marital status - Now married (%)
Marital status - Separated (%)
Marital status - Widowed (%)
Marital status - Divorced (%)
Median family income ($)
Median family income (% change since 2000)
Median non-family income ($)
Median non-family income (% change since 2000)
Median per capita income ($)
Median per capita income (% change since 2000)
Median family income ($) - White
Median family income ($) - Black or African American
Median family income ($) - Asian
Median family income ($) - Hispanic or Latino
Median family income ($) - American Indian and Alaska Native
Median family income ($) - Multirace
Median family income ($) - Other Race
Median year house/condo built
Median year apartment built
Year house built - Built 2005 or later (%)
Year house built - Built 2000 to 2004 (%)
Year house built - Built 1990 to 1999 (%)
Year house built - Built 1980 to 1989 (%)
Year house built - Built 1970 to 1979 (%)
Year house built - Built 1960 to 1969 (%)
Year house built - Built 1950 to 1959 (%)
Year house built - Built 1940 to 1949 (%)
Year house built - Built 1939 or earlier (%)
Average household size
Household density (households per square mile)
Average household size - White
Average household size - Black or African American
Average household size - Asian
Average household size - Hispanic or Latino
Average household size - American Indian and Alaska Native
Average household size - Multirace
Average household size - Other Race
Occupied housing units (%)
Vacant housing units (%)
Owner occupied housing units (%)
Renter occupied housing units (%)
Vacancy status - For rent (%)
Vacancy status - For sale only (%)
Vacancy status - Rented or sold, not occupied (%)
Vacancy status - For seasonal, recreational, or occasional use (%)
Vacancy status - For migrant workers (%)
Vacancy status - Other vacant (%)
Residents with income below the poverty level (%)
Residents with income below 50% of the poverty level (%)
Children below poverty level (%)
Poor families by family type - Married-couple family (%)
Poor families by family type - Male, no wife present (%)
Poor families by family type - Female, no husband present (%)
Poverty status for native-born residents (%)
Poverty status for foreign-born residents (%)
Poverty among high school graduates not in families (%)
Poverty among people who did not graduate high school not in families (%)
Residents with income below the poverty level (%) - White
Residents with income below the poverty level (%) - Black or African American
Residents with income below the poverty level (%) - Asian
Residents with income below the poverty level (%) - Hispanic or Latino
Residents with income below the poverty level (%) - American Indian and Alaska Native
Residents with income below the poverty level (%) - Multirace
Residents with income below the poverty level (%) - Other Race
Air pollution - Air Quality Index (AQI)
Air pollution - CO
Air pollution - NO2
Air pollution - SO2
Air pollution - Ozone
Air pollution - PM10
Air pollution - PM25
Air pollution - Pb
Crime - Murders per 100,000 population
Crime - Rapes per 100,000 population
Crime - Robberies per 100,000 population
Crime - Assaults per 100,000 population
Crime - Burglaries per 100,000 population
Crime - Thefts per 100,000 population
Crime - Auto thefts per 100,000 population
Crime - Arson per 100,000 population
Crime - City-data.com crime index
Crime - Violent crime index
Crime - Property crime index
Crime - Murders per 100,000 population (5 year average)
Crime - Rapes per 100,000 population (5 year average)
Crime - Robberies per 100,000 population (5 year average)
Crime - Assaults per 100,000 population (5 year average)
Crime - Burglaries per 100,000 population (5 year average)
Crime - Thefts per 100,000 population (5 year average)
Crime - Auto thefts per 100,000 population (5 year average)
Crime - Arson per 100,000 population (5 year average)
Crime - City-data.com crime index (5 year average)
Crime - Violent crime index (5 year average)
Crime - Property crime index (5 year average)
1996 Presidential Elections Results (%) - Democratic Party (Clinton)
1996 Presidential Elections Results (%) - Republican Party (Dole)
1996 Presidential Elections Results (%) - Other
2000 Presidential Elections Results (%) - Democratic Party (Gore)
2000 Presidential Elections Results (%) - Republican Party (Bush)
2000 Presidential Elections Results (%) - Other
2004 Presidential Elections Results (%) - Democratic Party (Kerry)
2004 Presidential Elections Results (%) - Republican Party (Bush)
2004 Presidential Elections Results (%) - Other
2008 Presidential Elections Results (%) - Democratic Party (Obama)
2008 Presidential Elections Results (%) - Republican Party (McCain)
2008 Presidential Elections Results (%) - Other
2012 Presidential Elections Results (%) - Democratic Party (Obama)
2012 Presidential Elections Results (%) - Republican Party (Romney)
2012 Presidential Elections Results (%) - Other
2016 Presidential Elections Results (%) - Democratic Party (Clinton)
2016 Presidential Elections Results (%) - Republican Party (Trump)
2016 Presidential Elections Results (%) - Other
2020 Presidential Elections Results (%) - Democratic Party (Biden)
2020 Presidential Elections Results (%) - Republican Party (Trump)
2020 Presidential Elections Results (%) - Other
Ancestries Reported - Arab (%)
Ancestries Reported - Czech (%)
Ancestries Reported - Danish (%)
Ancestries Reported - Dutch (%)
Ancestries Reported - English (%)
Ancestries Reported - French (%)
Ancestries Reported - French Canadian (%)
Ancestries Reported - German (%)
Ancestries Reported - Greek (%)
Ancestries Reported - Hungarian (%)
Ancestries Reported - Irish (%)
Ancestries Reported - Italian (%)
Ancestries Reported - Lithuanian (%)
Ancestries Reported - Norwegian (%)
Ancestries Reported - Polish (%)
Ancestries Reported - Portuguese (%)
Ancestries Reported - Russian (%)
Ancestries Reported - Scotch-Irish (%)
Ancestries Reported - Scottish (%)
Ancestries Reported - Slovak (%)
Ancestries Reported - Subsaharan African (%)
Ancestries Reported - Swedish (%)
Ancestries Reported - Swiss (%)
Ancestries Reported - Ukrainian (%)
Ancestries Reported - United States (%)
Ancestries Reported - Welsh (%)
Ancestries Reported - West Indian (%)
Ancestries Reported - Other (%)
Educational Attainment - No schooling completed (%)
Educational Attainment - Less than high school (%)
Educational Attainment - High school or equivalent (%)
Educational Attainment - Less than 1 year of college (%)
Educational Attainment - 1 or more years of college (%)
Educational Attainment - Associate degree (%)
Educational Attainment - Bachelor's degree (%)
Educational Attainment - Master's degree (%)
Educational Attainment - Professional school degree (%)
Educational Attainment - Doctorate degree (%)
School Enrollment - Nursery, preschool (%)
School Enrollment - Kindergarten (%)
School Enrollment - Grade 1 to 4 (%)
School Enrollment - Grade 5 to 8 (%)
School Enrollment - Grade 9 to 12 (%)
School Enrollment - College undergrad (%)
School Enrollment - Graduate or professional (%)
School Enrollment - Not enrolled in school (%)
School enrollment - Public schools (%)
School enrollment - Private schools (%)
School enrollment - Not enrolled (%)
Median number of rooms in houses and condos
Median number of rooms in apartments
Housing units lacking complete plumbing facilities (%)
Housing units lacking complete kitchen facilities (%)
Density of houses
Urban houses (%)
Rural houses (%)
Households with people 60 years and over (%)
Households with people 65 years and over (%)
Households with people 75 years and over (%)
Households with one or more nonrelatives (%)
Households with no nonrelatives (%)
Population in households (%)
Family households (%)
Nonfamily households (%)
Population in families (%)
Family households with own children (%)
Median number of bedrooms in owner occupied houses
Mean number of bedrooms in owner occupied houses
Median number of bedrooms in renter occupied houses
Mean number of bedrooms in renter occupied houses
Median number of vehichles in owner occupied houses
Mean number of vehichles in owner occupied houses
Median number of vehichles in renter occupied houses
Mean number of vehichles in renter occupied houses
Mortgage status - with mortgage (%)
Mortgage status - with second mortgage (%)
Mortgage status - with home equity loan (%)
Mortgage status - with both second mortgage and home equity loan (%)
Mortgage status - without a mortgage (%)
Average family size
Average family size - White
Average family size - Black or African American
Average family size - Asian
Average family size - Hispanic or Latino
Average family size - American Indian and Alaska Native
Average family size - Multirace
Average family size - Other Race
Geographical mobility - Same house 1 year ago (%)
Geographical mobility - Moved within same county (%)
Geographical mobility - Moved from different county within same state (%)
Geographical mobility - Moved from different state (%)
Geographical mobility - Moved from abroad (%)
Place of birth - Born in state of residence (%)
Place of birth - Born in other state (%)
Place of birth - Native, outside of US (%)
Place of birth - Foreign born (%)
Housing units in structures - 1, detached (%)
Housing units in structures - 1, attached (%)
Housing units in structures - 2 (%)
Housing units in structures - 3 or 4 (%)
Housing units in structures - 5 to 9 (%)
Housing units in structures - 10 to 19 (%)
Housing units in structures - 20 to 49 (%)
Housing units in structures - 50 or more (%)
Housing units in structures - Mobile home (%)
Housing units in structures - Boat, RV, van, etc. (%)
House/condo owner moved in on average (years ago)
Renter moved in on average (years ago)
Year householder moved into unit - Moved in 1999 to March 2000 (%)
Year householder moved into unit - Moved in 1995 to 1998 (%)
Year householder moved into unit - Moved in 1990 to 1994 (%)
Year householder moved into unit - Moved in 1980 to 1989 (%)
Year householder moved into unit - Moved in 1970 to 1979 (%)
Year householder moved into unit - Moved in 1969 or earlier (%)
Means of transportation to work - Drove car alone (%)
Means of transportation to work - Carpooled (%)
Means of transportation to work - Public transportation (%)
Means of transportation to work - Bus or trolley bus (%)
Means of transportation to work - Streetcar or trolley car (%)
Means of transportation to work - Subway or elevated (%)
Means of transportation to work - Railroad (%)
Means of transportation to work - Ferryboat (%)
Means of transportation to work - Taxicab (%)
Means of transportation to work - Motorcycle (%)
Means of transportation to work - Bicycle (%)
Means of transportation to work - Walked (%)
Means of transportation to work - Other means (%)
Working at home (%)
Industry diversity
Most Common Industries - Agriculture, forestry, fishing and hunting, and mining (%)
Most Common Industries - Agriculture, forestry, fishing and hunting (%)
Most Common Industries - Mining, quarrying, and oil and gas extraction (%)
Most Common Industries - Construction (%)
Most Common Industries - Manufacturing (%)
Most Common Industries - Wholesale trade (%)
Most Common Industries - Retail trade (%)
Most Common Industries - Transportation and warehousing, and utilities (%)
Most Common Industries - Transportation and warehousing (%)
Most Common Industries - Utilities (%)
Most Common Industries - Information (%)
Most Common Industries - Finance and insurance, and real estate and rental and leasing (%)
Most Common Industries - Finance and insurance (%)
Most Common Industries - Real estate and rental and leasing (%)
Most Common Industries - Professional, scientific, and management, and administrative and waste management services (%)
Most Common Industries - Professional, scientific, and technical services (%)
Most Common Industries - Management of companies and enterprises (%)
Most Common Industries - Administrative and support and waste management services (%)
Most Common Industries - Educational services, and health care and social assistance (%)
Most Common Industries - Educational services (%)
Most Common Industries - Health care and social assistance (%)
Most Common Industries - Arts, entertainment, and recreation, and accommodation and food services (%)
Most Common Industries - Arts, entertainment, and recreation (%)
Most Common Industries - Accommodation and food services (%)
Most Common Industries - Other services, except public administration (%)
Most Common Industries - Public administration (%)
Occupation diversity
Most Common Occupations - Management, business, science, and arts occupations (%)
Most Common Occupations - Management, business, and financial occupations (%)
Most Common Occupations - Management occupations (%)
Most Common Occupations - Business and financial operations occupations (%)
Most Common Occupations - Computer, engineering, and science occupations (%)
Most Common Occupations - Computer and mathematical occupations (%)
Most Common Occupations - Architecture and engineering occupations (%)
Most Common Occupations - Life, physical, and social science occupations (%)
Most Common Occupations - Education, legal, community service, arts, and media occupations (%)
Most Common Occupations - Community and social service occupations (%)
Most Common Occupations - Legal occupations (%)
Most Common Occupations - Education, training, and library occupations (%)
Most Common Occupations - Arts, design, entertainment, sports, and media occupations (%)
Most Common Occupations - Healthcare practitioners and technical occupations (%)
Most Common Occupations - Health diagnosing and treating practitioners and other technical occupations (%)
Most Common Occupations - Health technologists and technicians (%)
Most Common Occupations - Service occupations (%)
Most Common Occupations - Healthcare support occupations (%)
Most Common Occupations - Protective service occupations (%)
Most Common Occupations - Fire fighting and prevention, and other protective service workers including supervisors (%)
Most Common Occupations - Law enforcement workers including supervisors (%)
Most Common Occupations - Food preparation and serving related occupations (%)
Most Common Occupations - Building and grounds cleaning and maintenance occupations (%)
Most Common Occupations - Personal care and service occupations (%)
Most Common Occupations - Sales and office occupations (%)
Most Common Occupations - Sales and related occupations (%)
Most Common Occupations - Office and administrative support occupations (%)
Most Common Occupations - Natural resources, construction, and maintenance occupations (%)
Most Common Occupations - Farming, fishing, and forestry occupations (%)
Most Common Occupations - Construction and extraction occupations (%)
Most Common Occupations - Installation, maintenance, and repair occupations (%)
Most Common Occupations - Production, transportation, and material moving occupations (%)
Most Common Occupations - Production occupations (%)
Most Common Occupations - Transportation occupations (%)
Most Common Occupations - Material moving occupations (%)
People in Group quarters - Institutionalized population (%)
People in Group quarters - Correctional institutions (%)
People in Group quarters - Federal prisons and detention centers (%)
People in Group quarters - Halfway houses (%)
People in Group quarters - Local jails and other confinement facilities (including police lockups) (%)
People in Group quarters - Military disciplinary barracks (%)
People in Group quarters - State prisons (%)
People in Group quarters - Other types of correctional institutions (%)
People in Group quarters - Nursing homes (%)
People in Group quarters - Hospitals/wards, hospices, and schools for the handicapped (%)
People in Group quarters - Hospitals/wards and hospices for chronically ill (%)
People in Group quarters - Hospices or homes for chronically ill (%)
People in Group quarters - Military hospitals or wards for chronically ill (%)
People in Group quarters - Other hospitals or wards for chronically ill (%)
People in Group quarters - Hospitals or wards for drug/alcohol abuse (%)
People in Group quarters - Mental (Psychiatric) hospitals or wards (%)
People in Group quarters - Schools, hospitals, or wards for the mentally retarded (%)
People in Group quarters - Schools, hospitals, or wards for the physically handicapped (%)
People in Group quarters - Institutions for the deaf (%)
People in Group quarters - Institutions for the blind (%)
People in Group quarters - Orthopedic wards and institutions for the physically handicapped (%)
People in Group quarters - Wards in general hospitals for patients who have no usual home elsewhere (%)
People in Group quarters - Wards in military hospitals for patients who have no usual home elsewhere (%)
People in Group quarters - Juvenile institutions (%)
People in Group quarters - Long-term care (%)
People in Group quarters - Homes for abused, dependent, and neglected children (%)
People in Group quarters - Residential treatment centers for emotionally disturbed children (%)
People in Group quarters - Training schools for juvenile delinquents (%)
People in Group quarters - Short-term care, detention or diagnostic centers for delinquent children (%)
People in Group quarters - Type of juvenile institution unknown (%)
People in Group quarters - Noninstitutionalized population (%)
People in Group quarters - College dormitories (includes college quarters off campus) (%)
People in Group quarters - Military quarters (%)
People in Group quarters - On base (%)
People in Group quarters - Barracks, unaccompanied personnel housing (UPH), (Enlisted/Officer), ;and similar group living quarters for military personnel (%)
People in Group quarters - Transient quarters for temporary residents (%)
People in Group quarters - Military ships (%)
People in Group quarters - Group homes (%)
People in Group quarters - Homes or halfway houses for drug/alcohol abuse (%)
People in Group quarters - Homes for the mentally ill (%)
People in Group quarters - Homes for the mentally retarded (%)
People in Group quarters - Homes for the physically handicapped (%)
People in Group quarters - Other group homes (%)
People in Group quarters - Religious group quarters (%)
People in Group quarters - Dormitories (%)
People in Group quarters - Agriculture workers' dormitories on farms (%)
People in Group quarters - Job Corps and vocational training facilities (%)
People in Group quarters - Other workers' dormitories (%)
People in Group quarters - Crews of maritime vessels (%)
People in Group quarters - Other nonhousehold living situations (%)
People in Group quarters - Other noninstitutional group quarters (%)
Residents speaking English at home (%)
Residents speaking English at home - Born in the United States (%)
Residents speaking English at home - Native, born elsewhere (%)
Residents speaking English at home - Foreign born (%)
Residents speaking Spanish at home (%)
Residents speaking Spanish at home - Born in the United States (%)
Residents speaking Spanish at home - Native, born elsewhere (%)
Residents speaking Spanish at home - Foreign born (%)
Residents speaking other language at home (%)
Residents speaking other language at home - Born in the United States (%)
Residents speaking other language at home - Native, born elsewhere (%)
Residents speaking other language at home - Foreign born (%)
Class of Workers - Employee of private company (%)
Class of Workers - Self-employed in own incorporated business (%)
Class of Workers - Private not-for-profit wage and salary workers (%)
Class of Workers - Local government workers (%)
Class of Workers - State government workers (%)
Class of Workers - Federal government workers (%)
Class of Workers - Self-employed workers in own not incorporated business and Unpaid family workers (%)
House heating fuel used in houses and condos - Utility gas (%)
House heating fuel used in houses and condos - Bottled, tank, or LP gas (%)
House heating fuel used in houses and condos - Electricity (%)
House heating fuel used in houses and condos - Fuel oil, kerosene, etc. (%)
House heating fuel used in houses and condos - Coal or coke (%)
House heating fuel used in houses and condos - Wood (%)
House heating fuel used in houses and condos - Solar energy (%)
House heating fuel used in houses and condos - Other fuel (%)
House heating fuel used in houses and condos - No fuel used (%)
House heating fuel used in apartments - Utility gas (%)
House heating fuel used in apartments - Bottled, tank, or LP gas (%)
House heating fuel used in apartments - Electricity (%)
House heating fuel used in apartments - Fuel oil, kerosene, etc. (%)
House heating fuel used in apartments - Coal or coke (%)
House heating fuel used in apartments - Wood (%)
House heating fuel used in apartments - Solar energy (%)
House heating fuel used in apartments - Other fuel (%)
House heating fuel used in apartments - No fuel used (%)
Armed forces status - In Armed Forces (%)
Armed forces status - Civilian (%)
Armed forces status - Civilian - Veteran (%)
Armed forces status - Civilian - Nonveteran (%)
Fatal accidents locations in years 2005-2021
Fatal accidents locations in 2005
Fatal accidents locations in 2006
Fatal accidents locations in 2007
Fatal accidents locations in 2008
Fatal accidents locations in 2009
Fatal accidents locations in 2010
Fatal accidents locations in 2011
Fatal accidents locations in 2012
Fatal accidents locations in 2013
Fatal accidents locations in 2014
Fatal accidents locations in 2015
Fatal accidents locations in 2016
Fatal accidents locations in 2017
Fatal accidents locations in 2018
Fatal accidents locations in 2019
Fatal accidents locations in 2020
Fatal accidents locations in 2021
Alcohol use - People drinking some alcohol every month (%)
Alcohol use - People not drinking at all (%)
Alcohol use - Average days/month drinking alcohol
Alcohol use - Average drinks/week
Alcohol use - Average days/year people drink much
Audiometry - Average condition of hearing (%)
Audiometry - People that can hear a whisper from across a quiet room (%)
Audiometry - People that can hear normal voice from across a quiet room (%)
Audiometry - Ears ringing, roaring, buzzing (%)
Audiometry - Had a job exposure to loud noise (%)
Audiometry - Had off-work exposure to loud noise (%)
Blood Pressure & Cholesterol - Has high blood pressure (%)
Blood Pressure & Cholesterol - Checking blood pressure at home (%)
Blood Pressure & Cholesterol - Frequently checking blood cholesterol (%)
Blood Pressure & Cholesterol - Has high cholesterol level (%)
Consumer Behavior - Money monthly spent on food at supermarket/grocery store
Consumer Behavior - Money monthly spent on food at other stores
Consumer Behavior - Money monthly spent on eating out
Consumer Behavior - Money monthly spent on carryout/delivered foods
Consumer Behavior - Income spent on food at supermarket/grocery store (%)
Consumer Behavior - Income spent on food at other stores (%)
Consumer Behavior - Income spent on eating out (%)
Consumer Behavior - Income spent on carryout/delivered foods (%)
Current Health Status - General health condition (%)
Current Health Status - Blood donors (%)
Current Health Status - Has blood ever tested for HIV virus (%)
Current Health Status - Left-handed people (%)
Dermatology - People using sunscreen (%)
Diabetes - Diabetics (%)
Diabetes - Had a blood test for high blood sugar (%)
Diabetes - People taking insulin (%)
Diet Behavior & Nutrition - Diet health (%)
Diet Behavior & Nutrition - Milk product consumption (# of products/month)
Diet Behavior & Nutrition - Meals not home prepared (#/week)
Diet Behavior & Nutrition - Meals from fast food or pizza place (#/week)
Diet Behavior & Nutrition - Ready-to-eat foods (#/month)
Diet Behavior & Nutrition - Frozen meals/pizza (#/month)
Drug Use - People that ever used marijuana or hashish (%)
Drug Use - Ever used hard drugs (%)
Drug Use - Ever used any form of cocaine (%)
Drug Use - Ever used heroin (%)
Drug Use - Ever used methamphetamine (%)
Health Insurance - People covered by health insurance (%)
Kidney Conditions-Urology - Avg. # of times urinating at night
Medical Conditions - People with asthma (%)
Medical Conditions - People with anemia (%)
Medical Conditions - People with psoriasis (%)
Medical Conditions - People with overweight (%)
Medical Conditions - Elderly people having difficulties in thinking or remembering (%)
Medical Conditions - People who ever received blood transfusion (%)
Medical Conditions - People having trouble seeing even with glass/contacts (%)
Medical Conditions - People with arthritis (%)
Medical Conditions - People with gout (%)
Medical Conditions - People with congestive heart failure (%)
Medical Conditions - People with coronary heart disease (%)
Medical Conditions - People with angina pectoris (%)
Medical Conditions - People who ever had heart attack (%)
Medical Conditions - People who ever had stroke (%)
Medical Conditions - People with emphysema (%)
Medical Conditions - People with thyroid problem (%)
Medical Conditions - People with chronic bronchitis (%)
Medical Conditions - People with any liver condition (%)
Medical Conditions - People who ever had cancer or malignancy (%)
Mental Health - People who have little interest in doing things (%)
Mental Health - People feeling down, depressed, or hopeless (%)
Mental Health - People who have trouble sleeping or sleeping too much (%)
Mental Health - People feeling tired or having little energy (%)
Mental Health - People with poor appetite or overeating (%)
Mental Health - People feeling bad about themself (%)
Mental Health - People who have trouble concentrating on things (%)
Mental Health - People moving or speaking slowly or too fast (%)
Mental Health - People having thoughts they would be better off dead (%)
Oral Health - Average years since last visit a dentist
Oral Health - People embarrassed because of mouth (%)
Oral Health - People with gum disease (%)
Oral Health - General health of teeth and gums (%)
Oral Health - Average days a week using dental floss/device
Oral Health - Average days a week using mouthwash for dental problem
Oral Health - Average number of teeth
Pesticide Use - Households using pesticides to control insects (%)
Pesticide Use - Households using pesticides to kill weeds (%)
Physical Activity - People doing vigorous-intensity work activities (%)
Physical Activity - People doing moderate-intensity work activities (%)
Physical Activity - People walking or bicycling (%)
Physical Activity - People doing vigorous-intensity recreational activities (%)
Physical Activity - People doing moderate-intensity recreational activities (%)
Physical Activity - Average hours a day doing sedentary activities
Physical Activity - Average hours a day watching TV or videos
Physical Activity - Average hours a day using computer
Physical Functioning - People having limitations keeping them from working (%)
Physical Functioning - People limited in amount of work they can do (%)
Physical Functioning - People that need special equipment to walk (%)
Physical Functioning - People experiencing confusion/memory problems (%)
Physical Functioning - People requiring special healthcare equipment (%)
Prescription Medications - Average number of prescription medicines taking
Preventive Aspirin Use - Adults 40+ taking low-dose aspirin (%)
Reproductive Health - Vaginal deliveries (%)
Reproductive Health - Cesarean deliveries (%)
Reproductive Health - Deliveries resulted in a live birth (%)
Reproductive Health - Pregnancies resulted in a delivery (%)
Reproductive Health - Women breastfeeding newborns (%)
Reproductive Health - Women that had a hysterectomy (%)
Reproductive Health - Women that had both ovaries removed (%)
Reproductive Health - Women that have ever taken birth control pills (%)
Reproductive Health - Women taking birth control pills (%)
Reproductive Health - Women that have ever used Depo-Provera or injectables (%)
Reproductive Health - Women that have ever used female hormones (%)
Sexual Behavior - People 18+ that ever had sex (vaginal, anal, or oral) (%)
Sexual Behavior - Males 18+ that ever had vaginal sex with a woman (%)
Sexual Behavior - Males 18+ that ever performed oral sex on a woman (%)
Sexual Behavior - Males 18+ that ever had anal sex with a woman (%)
Sexual Behavior - Males 18+ that ever had any sex with a man (%)
Sexual Behavior - Females 18+ that ever had vaginal sex with a man (%)
Sexual Behavior - Females 18+ that ever performed oral sex on a man (%)
Sexual Behavior - Females 18+ that ever had anal sex with a man (%)
Sexual Behavior - Females 18+ that ever had any kind of sex with a woman (%)
Sexual Behavior - Average age people first had sex
Sexual Behavior - Average number of female sex partners in lifetime (males 18+)
Sexual Behavior - Average number of female vaginal sex partners in lifetime (males 18+)
Sexual Behavior - Average age people first performed oral sex on a woman (18+)
Sexual Behavior - Average number of woman performed oral sex on in lifetime (18+)
Sexual Behavior - Average number of male sex partners in lifetime (males 18+)
Sexual Behavior - Average number of male anal sex partners in lifetime (males 18+)
Sexual Behavior - Average age people first performed oral sex on a man (18+)
Sexual Behavior - Average number of male oral sex partners in lifetime (18+)
Sexual Behavior - People using protection when performing oral sex (%)
Sexual Behavior - Average number of times people have vaginal or anal sex a year
Sexual Behavior - People having sex without condom (%)
Sexual Behavior - Average number of male sex partners in lifetime (females 18+)
Sexual Behavior - Average number of male vaginal sex partners in lifetime (females 18+)
Sexual Behavior - Average number of female sex partners in lifetime (females 18+)
Sexual Behavior - Circumcised males 18+ (%)
Sleep Disorders - Average hours sleeping at night
Sleep Disorders - People that has trouble sleeping (%)
Smoking-Cigarette Use - People smoking cigarettes (%)
Taste & Smell - People 40+ having problems with smell (%)
Taste & Smell - People 40+ having problems with taste (%)
Taste & Smell - People 40+ that ever had wisdom teeth removed (%)
Taste & Smell - People 40+ that ever had tonsils teeth removed (%)
Taste & Smell - People 40+ that ever had a loss of consciousness because of a head injury (%)
Taste & Smell - People 40+ that ever had a broken nose or other serious injury to face or skull (%)
Taste & Smell - People 40+ that ever had two or more sinus infections (%)
Weight - Average height (inches)
Weight - Average weight (pounds)
Weight - Average BMI
Weight - People that are obese (%)
Weight - People that ever were obese (%)
Weight - People trying to lose weight (%)
100%
urban population.
Estimated median house/condo value in 2022: $291,474
30008:
$291,474Georgia:
$297,400
According to our research of Georgia and other state lists, there were 44 registered sex offenders living in 30008 zip code as of May 23, 2024 . The ratio of all residents to sex offenders in zip code 30008 is 782 to 1.The ratio of registered sex offenders to all residents in this zip code is lower than the state average.
Median resident age: This zip code:
35.5 yearsGeorgia median age:
37.6 years
Average household size: This zip code:
2.7 peopleGeorgia:
2.6 people
Averages for the 2020 tax year for zip code 30008, filed in 2021:
Average Adjusted Gross Income (AGI) in 2020: $42,266 (Individual Income Tax Returns) Here:
$42,266State:
$70,847
Salary/wage: $42,206 (reported on 78.1% of returns )Here:
$42,206State:
$59,126
(% of AGI for various income ranges: 1153.6% for AGIs below $25k , 3851.5% for AGIs $25k-50k , 7540.0% for AGIs $50k-75k , 11314.4% for AGIs $75k-100k , 19893.2% for AGIs $100k-200k , 59177.5% for AGIs over 200k ) Taxable interest for individuals: $683 (reported on 13.0% of returns )This zip code:
$683Georgia:
$2,011
(% of AGI for various income ranges: 3.6% for AGIs below $25k , 8.4% for AGIs $25k-50k , 19.6% for AGIs $50k-75k , 22.2% for AGIs $75k-100k , 56.5% for AGIs $100k-200k , 365.0% for AGIs over 200k ) Ordinary dividends: $2,436 (reported on 8.0% of returns )(% of AGI for various income ranges: 5.5% for AGIs below $25k , 8.4% for AGIs $25k-50k , 29.4% for AGIs $50k-75k , 45.4% for AGIs $75k-100k , 138.2% for AGIs $100k-200k , 2165.0% for AGIs over 200k ) Net capital gain/loss in AGI: +$5,620 (reported on 7.4% of returns )Here:
+$5,620State:
+$28,402
(% of AGI for various income ranges: 2.3% for AGIs below $25k , 9.9% for AGIs $25k-50k , 56.1% for AGIs $50k-75k , 67.5% for AGIs $75k-100k , 324.7% for AGIs $100k-200k , 6525.0% for AGIs over 200k ) Profit/loss from business: +$6,804 (reported on 33.5% of returns )Here:
+$6,804State:
+$6,707
(% of AGI for various income ranges: 365.0% for AGIs below $25k , 326.9% for AGIs $25k-50k , 258.7% for AGIs $50k-75k , 184.9% for AGIs $75k-100k , 306.8% for AGIs $100k-200k , 1795.0% for AGIs over 200k ) Taxable individual retirement arrangement distribution: $15,919 (reported on 3.7% of returns )30008:
$15,919Georgia:
$20,525
(% of AGI for various income ranges: 18.1% for AGIs below $25k , 45.5% for AGIs $25k-50k , 96.4% for AGIs $50k-75k , 228.3% for AGIs $75k-100k , 609.3% for AGIs $100k-200k ) Total itemized deductions: $24,394 (reported on 8.5% of returns )Here:
$24,394State:
$34,001
(% of AGI for various income ranges: 28.7% for AGIs below $25k , 148.6% for AGIs $25k-50k , 487.5% for AGIs $50k-75k , 1079.4% for AGIs $75k-100k , 1437.5% for AGIs $100k-200k , 7455.0% for AGIs over 200k ) Charity contributions: $8,271 (reported on 7.1% of returns )(% of AGI for various income ranges: 4.1% for AGIs below $25k , 34.1% for AGIs $25k-50k , 137.6% for AGIs $50k-75k , 281.1% for AGIs $75k-100k , 449.7% for AGIs $100k-200k , 2910.0% for AGIs over 200k ) Taxes paid: $6,261 (reported on 8.5% of returns )(% of AGI for various income ranges: 3.5% for AGIs below $25k , 26.3% for AGIs $25k-50k , 123.9% for AGIs $50k-75k , 302.5% for AGIs $75k-100k , 472.5% for AGIs $100k-200k , 1207.5% for AGIs over 200k ) Earned income credit: $2,599 (reported on 25.2% of returns )(% of AGI for various income ranges: 144.7% for AGIs below $25k , 101.6% for AGIs $25k-50k , 1.3% for AGIs $50k-75k ) Percentage of individuals using paid preparers for their 2020 taxes: 90.0%(% for various income ranges: 87.1% for AGIs below $25k , 92.3% for AGIs $25k-50k , 91.8% for AGIs $50k-75k , 92.0% for AGIs $75k-100k , 92.7% for AGIs $100k-200k , 92.3% for AGIs over 200k )
Averages for the 2012 tax year for zip code 30008, filed in 2013:
Average Adjusted Gross Income (AGI) in 2012: $35,852 (Individual Income Tax Returns) Here:
$35,852State:
$56,131
Salary/wage: $36,217 (reported on 82.9% of returns )Here:
$36,217State:
$47,942
(% of AGI for various income ranges: 75.7% for AGIs below $25k , 89.2% for AGIs $25k-50k , 85.5% for AGIs $50k-75k , 86.1% for AGIs $75k-100k , 84.0% for AGIs $100k-200k , 69.7% for AGIs over 200k ) Taxable interest for individuals: $724 (reported on 15.4% of returns )This zip code:
$724Georgia:
$1,706
(% of AGI for various income ranges: 0.4% for AGIs below $25k , 0.2% for AGIs $25k-50k , 0.2% for AGIs $50k-75k , 0.3% for AGIs $75k-100k , 0.5% for AGIs $100k-200k , 0.2% for AGIs over 200k ) Ordinary dividends: $2,432 (reported on 8.2% of returns )(% of AGI for various income ranges: 0.4% for AGIs below $25k , 0.3% for AGIs $25k-50k , 0.5% for AGIs $50k-75k , 0.6% for AGIs $75k-100k , 1.0% for AGIs $100k-200k , 1.0% for AGIs over 200k ) Net capital gain/loss in AGI: +$899 (reported on 5.9% of returns )(% of AGI for various income ranges: 0.2% for AGIs $75k-100k , 0.8% for AGIs $100k-200k , 0.7% for AGIs over 200k ) Profit/loss from business: +$4,735 (reported on 27.1% of returns )Here:
+$4,735State:
+$7,583
(% of AGI for various income ranges: 15.3% for AGIs below $25k , 1.1% for AGIs $25k-50k , 0.9% for AGIs $50k-75k , 1.0% for AGIs $75k-100k , 0.5% for AGIs $100k-200k ) Taxable individual retirement arrangement distribution: $11,203 (reported on 4.9% of returns )30008:
$11,203Georgia:
$17,199
(% of AGI for various income ranges: 1.4% for AGIs below $25k , 1.1% for AGIs $25k-50k , 1.7% for AGIs $50k-75k , 1.5% for AGIs $75k-100k , 2.4% for AGIs $100k-200k ) Total itemized deductions: $17,281 (26% of AGI, reported on 29.3% of returns )Here:
$17,281State:
$23,886
Here:
26.3% of AGIState:
21.5% of AGI
(% of AGI for various income ranges: 7.1% for AGIs below $25k , 13.9% for AGIs $25k-50k , 17.6% for AGIs $50k-75k , 16.7% for AGIs $75k-100k , 16.0% for AGIs $100k-200k , 13.8% for AGIs over 200k ) Charity contributions: $3,816 (reported on 23.8% of returns )(% of AGI for various income ranges: 0.8% for AGIs below $25k , 2.3% for AGIs $25k-50k , 3.0% for AGIs $50k-75k , 3.0% for AGIs $75k-100k , 3.4% for AGIs $100k-200k , 3.8% for AGIs over 200k ) Taxes paid: $4,306 (reported on 29.0% of returns )(% of AGI for various income ranges: 0.9% for AGIs below $25k , 2.4% for AGIs $25k-50k , 4.2% for AGIs $50k-75k , 4.8% for AGIs $75k-100k , 5.5% for AGIs $100k-200k , 5.1% for AGIs over 200k ) Earned income credit: $2,754 (reported on 31.5% of returns )(% of AGI for various income ranges: 10.9% for AGIs below $25k , 1.5% for AGIs $25k-50k ) Percentage of individuals using paid preparers for their 2012 taxes: 54.9%(% for various income ranges: 57.6% for AGIs below $25k , 53.7% for AGIs $25k-50k , 52.1% for AGIs $50k-75k , 47.8% for AGIs $75k-100k , 47.9% for AGIs $100k-200k , 50.0% for AGIs over 200k )
Averages for the 2004 tax year for zip code 30008, filed in 2005:
Average Adjusted Gross Income (AGI) in 2004: $34,548 (Individual Income Tax Returns) Here:
$34,548State:
$47,553
Salary/wage: $35,405 (reported on 85.6% of returns )Here:
$35,405State:
$42,178
(% of AGI for various income ranges: 91.6% for AGIs below $10k , 84.3% for AGIs $10k-25k , 89.5% for AGIs $25k-50k , 89.5% for AGIs $50k-75k , 88.3% for AGIs $75k-100k , 84.3% for AGIs over 100k ) Taxable interest for individuals: $824 (reported on 26.5% of returns )This zip code:
$824Georgia:
$1,772
(% of AGI for various income ranges: 1.4% for AGIs below $10k , 0.8% for AGIs $10k-25k , 0.6% for AGIs $25k-50k , 0.4% for AGIs $50k-75k , 0.6% for AGIs $75k-100k , 0.8% for AGIs over 100k ) Taxable dividends: $1,135 (reported on 13.3% of returns )(% of AGI for various income ranges: 1.1% for AGIs below $10k , 0.4% for AGIs $10k-25k , 0.3% for AGIs $25k-50k , 0.4% for AGIs $50k-75k , 0.5% for AGIs $75k-100k , 0.6% for AGIs over 100k ) Net capital gain/loss: +$3,924 (reported on 9.3% of returns )Here:
+$3,924State:
+$16,461
(% of AGI for various income ranges: -0.7% for AGIs below $10k , -0.1% for AGIs $10k-25k , 0.2% for AGIs $25k-50k , 0.4% for AGIs $50k-75k , 0.9% for AGIs $75k-100k , 4.6% for AGIs over 100k ) Profit/loss from business: +$4,298 (reported on 20.6% of returns )Here:
+$4,298State:
+$8,201
(% of AGI for various income ranges: 16.9% for AGIs below $10k , 7.7% for AGIs $10k-25k , 1.8% for AGIs $25k-50k , 0.8% for AGIs $50k-75k , 1.4% for AGIs $75k-100k , 1.0% for AGIs over 100k ) IRA payment deduction: $2,461 (reported on 1.6% of returns )30008:
$2,461Georgia:
$2,969
(% of AGI for various income ranges: 0.1% for AGIs $10k-25k , 0.1% for AGIs $25k-50k , 0.1% for AGIs $50k-75k , 0.1% for AGIs $75k-100k , 0.1% for AGIs over 100k ) Self-employed pension: $5,880 (reported on 0.2% of returns )Here:
$5,880Georgia:
$16,203
Total itemized deductions: $15,684 (28% of AGI, reported on 39.8% of returns )Here:
$15,684State:
$19,944
Here:
27.6% of AGIState:
22.6% of AGI
(% of AGI for various income ranges: 13.1% for AGIs below $10k , 12.8% for AGIs $10k-25k , 19.2% for AGIs $25k-50k , 20.8% for AGIs $50k-75k , 19.7% for AGIs $75k-100k , 16.4% for AGIs over 100k ) Charity contributions deductions: $3,110 (5% of AGI, reported on 34.0% of returns )Here:
5.2% of AGIState:
4.7% of AGI
(% of AGI for various income ranges: 1.1% for AGIs below $10k , 1.8% for AGIs $10k-25k , 3.0% for AGIs $25k-50k , 3.6% for AGIs $50k-75k , 3.6% for AGIs $75k-100k , 3.4% for AGIs over 100k ) Total tax: $4,325 (reported on 67.2% of returns )(% of AGI for various income ranges: 4.7% for AGIs below $10k , 3.5% for AGIs $10k-25k , 5.9% for AGIs $25k-50k , 9.0% for AGIs $50k-75k , 10.4% for AGIs $75k-100k , 14.5% for AGIs over 100k ) Earned income credit: $2,040 (reported on 25.1% of returns )Percentage of individuals using paid preparers for their 2004 taxes: 55.6%(% for various income ranges: 51.9% for AGIs below $10k , 60.5% for AGIs $10k-25k , 56.8% for AGIs $25k-50k , 51.9% for AGIs $50k-75k , 51.2% for AGIs $75k-100k , 48.7% for AGIs over 100k )
Estimated median household income in 2022: This zip code:
$69,635Georgia:
$72,837
Nearest zip codes: 30064 ,
30060 ,
30082 ,
30106 ,
30126 ,
30080 .
Marietta Zip Code Map
Percentage of family households: This zip code:
51.8%Georgia:
48.5%
Percentage of households with unmarried partners: This zip code:
8.8%Georgia:
46.9%
Likely homosexual households (counted as self-reported same-sex unmarried-partner households)
Lesbian couples: 0.0% of all households Gay men: 0.4% of all households
Household received Food Stamps/SNAP in the past 12 months: 1,554Household did not receive Food Stamps/SNAP in the past 12 months: 10,709
Women who had a birth in the past 12 months: 340 (243 now married , 96 unmarried) Women who did not have a birth in the past 12 months: 7,715 (2,722 now married , 4,997 unmarried)
Housing units in zip code 30008 with a mortgage: 5,729 (500
second mortgage , 24
home equity loan , 290
both second mortgage and home equity loan )
Houses without a mortgage: 17
Median monthly owner costs for units with a mortgage: $1,448
Median monthly owner costs for units without a mortgage: $461
Residents with income below the poverty level in 2022:
This zip code:
14.3%Whole state:
12.7%
Residents with income below 50% of the poverty level in 2022:
This zip code:
8.9%Whole state:
6.3%
Median number of rooms in houses and condos: Median number of rooms in apartments: Notable locations in this zip code not listed on our city pages
Click to draw/clear zip code borders Notable locations in zip code 30008: (A) , Georgia Department of Public Safety (B) , Cobb County Fire and Emergency Services Station 10 (C) , Cobb County Administration (D) , Cobb County Fire and Emergency Services Station 30 (E) . Display/hide their locations on the map
Shopping Centers: (1) , Westside Shopping Center (2) . Display/hide their locations on the map
Churches in zip code 30008 include: (A) , Holydale Church (B) . Display/hide their locations on the map
Cemeteries: (1) , Norris Cemetery (2) , Paupers Cemetery (3) , Marietta City Cemetery (4) , Pair Cemetery (5) . Display/hide their locations on the map
Reservoirs: (A) , County Farm Lake (B) , North Georgia Fairgrounds Lake (C) . Display/hide their locations on the map
Parks in zip code 30008 include: (1) , Bishop Park (2) , Hedges Park (3) , Fair Oaks Park (4) , Al Bishop Park (5) , Miller Park (6) , Odell Park (7) , Trademore Park (8) . Display/hide their locations on the map
Year house built (houses)
0 2020 or later611 2010 to 20191,842 2000 to 20092,520 1990 to 19993,209 1980 to 19891,950 1970 to 19791,233 1960 to 1969602 1950 to 1959190 1940 to 1949119 1939 or earlier
Zip code 30008 household income distribution in 2022 640 Less than $10,000277 $10,000 to $14,999570 $15,000 to $19,999523 $20,000 to $24,999675 $25,000 to $29,999379 $30,000 to $34,999273 $35,000 to $39,999343 $40,000 to $44,999342 $45,000 to $49,9991,098 $50,000 to $59,9991,415 $60,000 to $74,9991,657 $75,000 to $99,9991,368 $100,000 to $124,9991,170 $125,000 to $149,999968 $150,000 to $199,999524 $200,000 or moreEstimate of home value of owner-occupied houses/condos in 2022 in zip code 30008 74 Less than $10,00018 $15,000 to $19,99940 $20,000 to $24,99936 $25,000 to $29,99910 $40,000 to $49,99911 $50,000 to $59,99926 $60,000 to $69,99945 $70,000 to $79,999125 $80,000 to $89,99950 $90,000 to $99,999236 $100,000 to $124,999158 $125,000 to $149,999411 $150,000 to $174,999455 $175,000 to $199,9991,298 $200,000 to $249,9991,556 $250,000 to $299,9991,631 $300,000 to $399,999448 $400,000 to $499,999213 $500,000 to $749,999Rent paid by renters in 2022 in zip code 30008 34 Less than $10056 $150 to $19916 $200 to $24924 $250 to $29954 $300 to $34986 $350 to $39993 $450 to $49915 $500 to $54995 $550 to $59957 $600 to $649130 $650 to $69953 $700 to $749147 $750 to $799341 $800 to $899467 $900 to $9991,225 $1,000 to $1,249908 $1,250 to $1,499773 $1,500 to $1,999148 $2,000 to $2,49928 No cash rent
Median gross rent in 2022: $1,353.
Median price asked for vacant for-sale houses and condos in 2022: $253,887.
Estimated median house (or condo) value in 2022 for: White Non-Hispanic householders: $302,018Black or African American householders: $344,469American Indian or Alaska Native householders: $260,650Asian householders: $398,275Some other race householders: $302,289Two or more races householders: $324,730Hispanic or Latino householders: $330,679Estimated median house or condo value in 2022: $291,474
30008:
$291,474Georgia:
$297,400
Lower value quartile - upper value quartile: $211,665 - $345,926
Mean price in 2022: Detached houses: $232,437Here:
$232,437State:
$376,364
Townhouses or other attached units: $205,989Here:
$205,989State:
$341,709
In 3-to-4-unit structures: $128,271Here:
$128,271State:
$250,092
Mobile homes: $347,259Here:
$347,259State:
$102,413
Housing units in structures:
One, detached: 8,074One, attached: 1,783Two: 433 or 4: 3445 to 9: 71410 to 19: 81020 to 49: 40150 or more: 441Mobile homes: 196Unemployment : 3.6%
Means of transportation to work in zip code 30008 66.7% 10,473 Drove a car alone10.5% 1,640 Carpooled1.1% 168 Bus or trolley bus0.1% 20 Subway or elevated1.8% 276 Taxi0.1% 12 Motorcycle0.7% 106 Walked0.4% 60 Other means19.4% 3,051 Worked at homeTravel time to work (commute) in zip code 30008 52 Less than 5 minutes653 5 to 9 minutes880 10 to 14 minutes1,812 15 to 19 minutes2,594 20 to 24 minutes544 25 to 29 minutes2,678 30 to 34 minutes481 35 to 39 minutes685 40 to 44 minutes1,274 45 to 59 minutes785 60 to 89 minutes335 90 or more minutes
Percentage of zip code residents living and working in this county: 73.3%
Household type by relationship:
Households: 34,941
Male householders: 5,887 (1,688 living alone ), Female householders: 6,381 (1,559 living alone )4,094 spouses (4,017 opposite-sex spouses ), 1,238 unmarried partners , (1,229 opposite-sex unmarried partners ), 10,368 children (9,988 natural , 37 adopted , 333 stepchildren ), 846 grandchildren , 1,126 brothers or sisters , 708 parents , 10 foster children , 628 other relatives , 1,209 non-relatives In group quarters: 2,298 (-1 institutionalized population )
Size of family households: 3,134 2-persons , 1,849 3-persons , 1,726 4-persons , 866 5-persons , 487 6-persons , 236 7-or-more-persons
Size of nonfamily households: 3,259 1-person , 524 2-persons , 156 3-persons , 32 4-persons , 12 6-persons
3,495 married couples with children. single-parent households (1,319 men , 2,447 women ).
65.2% of residents of 30008 zip code speak English at home. of residents speak Spanish at home (48% very well, 14% well, 22% not well, 16% not at all ).of residents speak other Indo-European language at home (59% very well, 34% well, 7% not well ).of residents speak Asian or Pacific Island language at home (51% very well, 11% well, 38% not well ).of residents speak other language at home (94% very well, 4% well, 2% not at all ).
Foreign born population: 8,292 (23.7%)
(39.9%
of them are naturalized citizens )
This zip code:
23.7%Whole state:
10.7%
28% Honduras 23% El Salvador 10% Costa Rica 8% Liberia 6% West Indies 3% Guatemala 3% Haiti 6% British West Indian 4% American 4% West Indian 3% English 2% Nigerian 2% Irish 2% African
Year of entry for the foreign-born population
2,902 2010 or later 2,978 2000 to 2009 1,974 1990 to 1999 1,706 Before 1990
There are
68 Medical Specialists in Zip Code 30008 .
Facilities with environmental interests located in this zip code:
COBB COUNTY COMPOSTING FACILITY (1775 COUNTY SERVICE PARKWAY in MARIETTA, GA)
AIR MINOR (AIRS/AFS) Business SIC classification: REFUSE SYSTEMSAlternative names: BEDMINSTER COBB CORPORATION
COBB COUNTY DOT (1890 COUNTY SERVICES PKWY in MARIETTA, GA)
Small Quantity Generators, between 100 kg and 1000 kg of hazardous waste/month (Resource Conservation and Recovery Act (tracking hazardous waste)) - notification Organizations: COBB COUNTY BOARD OF COMMISSIONERS (CONTACT/OWNER)
Housing units lacking complete plumbing facilities: 0.2%
Housing units lacking complete kitchen facilities: 0.9%
65.0% Utility gas 32.7% Electricity 1.1% Bottled, tank, or LP gas
Place of birth for U.S.-born residents:
This state: 14,614Northeast: 3,024Midwest: 2,032South: 5,157West: 659
39% of the 30008 zip code residents lived in the same house 5 years ago.
Out of people who lived in different houses, 47% lived in this county.
Out of people who lived in different counties, 50% lived in Georgia.
87% of the 30008 zip code residents lived in the same house 1 year ago.
Out of people who lived in different houses, 48% moved from this county.
Out of people who lived in different houses, 25% moved from different county within same state.
Out of people who lived in different houses, 21% moved from different state.
Out of people who lived in different houses, 5% moved from abroad.
Private vs. public school enrollment:
Students in private schools in grades 1 to 8 (elementary and middle school): 87
Students in private schools in grades 9 to 12 (high school): 76
Students in private undergraduate colleges: 238
Occupation by median earnings in the past 12 months ($)
94,950 Computer and mathematical occupations 81,871 Business and financial operations occupations 77,473 Architecture and engineering occupations 73,934 Arts, design, entertainment, sports, and media occupations 73,905 Health diagnosing and treating practitioners and other technical occupations 65,997 Management occupations
Companies with federal contracts located in this zip code:
RESTAURANT SOLUTIONS, INC (1423 AUSTELL ROAD in MARIETTA, GA; small business)
$127,241 with Army for Food Cooking, Baking, and Serving Equipment. Signed on 2004-06-25. Completion date: 2004-09-13.
RANDALL HOGAN (3840 MULKEY CIR SW in MARIETTA, GA; small business) in 8 contracts from 2001 to 2005
Contracts for Recreation Site Maintenance Services (non-construction) by Army, U.S. Army Corps of Engineers - civil program financing onlySigned by year: 2000: $0; 2001: $6,160; 2002: $0; 2003: $9,300; 2004: $20,960; 2005: $15,040; 2006: $0.
Biggest contracts: with Army for Recreation Site Maintenance Services (non-construction). Signed on 2004-03-04. Completion date: 2004-10-10.
with U.S. Army Corps of Engineers - civil program financing only for Recreation Site Maintenance Services (non-construction). Signed on 2004-03-04. Completion date: 2004-10-10.
, same as above. Signed on 2003-03-18. Completion date: 2003-09-22.
with Army for Recreation Site Maintenance Services (non-construction). Signed on 2005-03-11. Completion date: 2005-09-26.
OPTICAL ENGINEERING COMPANY IN (710 DAVIS CIRCLE in MARIETTA, GA; small business) in 3 contracts from 2002 to 2005
$29,511 with Air Force for ADPE System Configuration. Signed on 2004-09-21. Completion date: 2004-11-05.
with Army for Drafting, Surveying, and Mapping Instruments. Signed on 2002-12-13. Completion date: 2002-12-31.
with Air Force for Production Jigs, Fixtures, and Templates. Signed on 2005-05-24. Completion date: 2005-07-08.
Top industries in this zip code by the number of employees in 2005:
Administrative and Support and Waste Management and Remediation Services: Office Administrative Services (250-499 employees: 1 establishment)Health Care and Social Assistance: Nursing Care Facilities (100-249: 2)Administrative and Support and Waste Management and Remediation Services: Temporary Help Services (100-249: 1)Accommodation and Food Services: Limited-Service Restaurants (20-49: 3, 10-19: 2, 5-9: 1, 1-4: 3)Construction: Masonry Contractors (50-99: 1, 1-4: 2)Educational Services: Elementary and Secondary Schools (50-99: 1)Construction: Water and Sewer Line and Related Structures Construction (50-99: 1)Construction: Plumbing, Heating, and Air-Conditioning Contractors (20-49: 1, 10-19: 1, 5-9: 1, 1-4: 4)
People in group quarters in 2010:
2,085 people in local jails and other municipal confinement facilities
258 people in correctional residential facilities
207 people in nursing facilities/skilled-nursing facilities
61 people in correctional facilities intended for juveniles
38 people in group homes intended for adults
31 people in emergency and transitional shelters (with sleeping facilities) for people experiencing homelessness
6 people in other noninstitutional facilities
People in group quarters in 2000:
2,115 people in local jails and other confinement facilities (including police lockups)
284 people in nursing homes
146 people in other noninstitutional group quarters
126 people in hospitals or wards for drug/alcohol abuse
49 people in short-term care, detention or diagnostic centers for delinquent children
20 people in homes for the mentally retarded
16 people in hospitals/wards and hospices for chronically ill
16 people in unknown juvenile institutions
14 people in mental (psychiatric) hospitals or wards
10 people in hospices or homes for chronically ill
7 people in homes or halfway houses for drug/alcohol abuse
6 people in military hospitals or wards for chronically ill
5 people in orthopedic wards and institutions for the physically handicapped
Fatal accident statistics in 2014:
Fatal accident count: 1Vehicles involved in fatal accidents: 2Fatal accidents caused by drunken drivers: 0Fatalities: 1Persons involved in fatal accidents: 2Pedestrians involved in fatal accidents: 0
Fatal accident statistics in 2013:
Fatal accident count: 3Vehicles involved in fatal accidents: 5Fatal accidents caused by drunken drivers: 0Fatalities: 3Persons involved in fatal accidents: 9Pedestrians involved in fatal accidents: 1
Home Mortgage Disclosure Act Aggregated Statistics For Year 2009(Based on 4 full and 12 partial tracts) A) FHA, FSA/RHS & VA B) Conventional C) Refinancings D) Home Improvement Loans F) Non-occupant Loans on G) Loans On Manufactured Number Average Value Number Average Value Number Average Value Number Average Value Number Average Value Number Average Value
LOANS ORIGINATED 288 $129,157 111 $152,051 618 $144,026 28 $46,218 80 $154,547 0 $0 APPLICATIONS APPROVED, NOT ACCEPTED 16 $126,026 13 $79,558 70 $130,618 7 $25,951 10 $84,749 0 $0 APPLICATIONS DENIED 57 $107,071 41 $98,701 409 $134,888 44 $40,740 43 $85,947 2 $29,995 APPLICATIONS WITHDRAWN 67 $136,637 28 $87,882 258 $140,226 6 $35,132 22 $82,490 0 $0 FILES CLOSED FOR INCOMPLETENESS 7 $96,580 8 $160,289 76 $154,192 2 $103,565 1 $92,810 0 $0
Aggregated Statistics For Year 2008(Based on 4 full and 12 partial tracts) A) FHA, FSA/RHS & VA B) Conventional C) Refinancings D) Home Improvement Loans E) Loans on Dwellings For 5+ Families F) Non-occupant Loans on G) Loans On Manufactured Number Average Value Number Average Value Number Average Value Number Average Value Number Average Value Number Average Value Number Average Value
LOANS ORIGINATED 269 $144,385 289 $127,327 494 $142,151 45 $64,417 3 $6,460,860 155 $103,550 19 $27,269 APPLICATIONS APPROVED, NOT ACCEPTED 20 $133,172 34 $123,230 127 $127,467 10 $27,919 0 $0 19 $104,050 6 $26,662 APPLICATIONS DENIED 99 $136,948 123 $116,353 591 $139,581 129 $43,380 0 $0 89 $102,384 7 $14,263 APPLICATIONS WITHDRAWN 57 $146,808 60 $122,923 186 $156,650 14 $61,484 1 $3,433,500 42 $101,684 1 $121,100 FILES CLOSED FOR INCOMPLETENESS 8 $131,740 25 $130,318 52 $145,568 8 $21,962 1 $884,520 7 $100,789 0 $0
Aggregated Statistics For Year 2007(Based on 4 full and 12 partial tracts) A) FHA, FSA/RHS & VA B) Conventional C) Refinancings D) Home Improvement Loans E) Loans on Dwellings For 5+ Families F) Non-occupant Loans on G) Loans On Manufactured Number Average Value Number Average Value Number Average Value Number Average Value Number Average Value Number Average Value Number Average Value
LOANS ORIGINATED 119 $160,175 900 $133,862 798 $124,535 137 $49,928 9 $9,937,862 255 $106,662 1 $15,630 APPLICATIONS APPROVED, NOT ACCEPTED 4 $187,428 132 $105,466 197 $121,319 46 $53,885 3 $2,688,080 68 $97,729 4 $56,470 APPLICATIONS DENIED 28 $181,385 311 $127,454 946 $132,975 171 $46,661 2 $4,249,725 192 $112,801 6 $38,980 APPLICATIONS WITHDRAWN 25 $147,662 167 $132,759 367 $135,681 49 $78,976 0 $0 60 $137,196 0 $0 FILES CLOSED FOR INCOMPLETENESS 6 $130,835 33 $139,676 107 $137,479 3 $33,097 0 $0 12 $95,872 0 $0
Aggregated Statistics For Year 2006(Based on 4 full and 12 partial tracts) A) FHA, FSA/RHS & VA B) Conventional C) Refinancings D) Home Improvement Loans E) Loans on Dwellings For 5+ Families F) Non-occupant Loans on G) Loans On Manufactured Number Average Value Number Average Value Number Average Value Number Average Value Number Average Value Number Average Value Number Average Value
LOANS ORIGINATED 101 $155,820 1,540 $108,857 988 $110,634 131 $37,743 2 $492,830 429 $99,791 9 $28,186 APPLICATIONS APPROVED, NOT ACCEPTED 2 $154,615 201 $100,384 290 $107,967 22 $39,558 0 $0 67 $99,557 1 $64,430 APPLICATIONS DENIED 17 $170,243 529 $104,908 991 $124,532 199 $37,540 0 $0 186 $96,247 15 $25,008 APPLICATIONS WITHDRAWN 16 $132,632 269 $123,061 552 $124,828 42 $95,485 1 $1,316,250 84 $110,919 0 $0 FILES CLOSED FOR INCOMPLETENESS 2 $109,505 109 $111,248 159 $139,121 4 $92,392 0 $0 15 $185,265 1 $110,570
Aggregated Statistics For Year 2005(Based on 4 full and 12 partial tracts) A) FHA, FSA/RHS & VA B) Conventional C) Refinancings D) Home Improvement Loans E) Loans on Dwellings For 5+ Families F) Non-occupant Loans on G) Loans On Manufactured Number Average Value Number Average Value Number Average Value Number Average Value Number Average Value Number Average Value Number Average Value
LOANS ORIGINATED 143 $151,136 1,782 $102,265 1,193 $118,246 142 $39,811 5 $5,397,192 571 $108,803 31 $21,417 APPLICATIONS APPROVED, NOT ACCEPTED 7 $154,686 178 $103,507 247 $118,996 26 $32,089 0 $0 68 $108,319 13 $30,973 APPLICATIONS DENIED 18 $148,969 450 $120,522 998 $124,198 175 $45,515 2 $460,065 227 $133,380 16 $60,411 APPLICATIONS WITHDRAWN 21 $154,216 299 $124,209 562 $132,160 67 $102,857 0 $0 111 $135,023 4 $28,495 FILES CLOSED FOR INCOMPLETENESS 2 $107,685 120 $128,894 253 $135,516 10 $66,656 0 $0 31 $157,766 0 $0
Aggregated Statistics For Year 2004(Based on 4 full and 12 partial tracts) A) FHA, FSA/RHS & VA B) Conventional C) Refinancings D) Home Improvement Loans F) Non-occupant Loans on G) Loans On Manufactured Number Average Value Number Average Value Number Average Value Number Average Value Number Average Value Number Average Value
LOANS ORIGINATED 173 $143,044 1,196 $110,797 1,464 $114,536 110 $47,840 424 $103,512 14 $28,098 APPLICATIONS APPROVED, NOT ACCEPTED 5 $133,334 115 $106,318 312 $111,596 23 $28,793 41 $86,660 8 $48,222 APPLICATIONS DENIED 40 $140,717 296 $112,645 967 $118,639 173 $39,477 124 $111,220 44 $30,328 APPLICATIONS WITHDRAWN 20 $139,998 139 $110,485 463 $122,842 48 $55,442 58 $102,109 0 $0 FILES CLOSED FOR INCOMPLETENESS 10 $134,881 52 $113,378 238 $130,411 10 $70,069 12 $123,771 0 $0
Aggregated Statistics For Year 2003(Based on 4 full and 12 partial tracts) A) FHA, FSA/RHS & VA B) Conventional C) Refinancings D) Home Improvement Loans E) Loans on Dwellings For 5+ Families F) Non-occupant Loans on Number Average Value Number Average Value Number Average Value Number Average Value Number Average Value Number Average Value
LOANS ORIGINATED 225 $137,844 983 $122,944 2,633 $112,270 77 $35,882 4 $659,752 468 $101,364 APPLICATIONS APPROVED, NOT ACCEPTED 7 $121,620 94 $118,281 310 $113,170 13 $39,667 0 $0 36 $91,659 APPLICATIONS DENIED 30 $128,934 184 $110,163 844 $112,482 94 $27,599 0 $0 115 $107,593 APPLICATIONS WITHDRAWN 18 $118,597 88 $113,602 382 $117,636 23 $42,629 0 $0 53 $97,626 FILES CLOSED FOR INCOMPLETENESS 5 $158,194 52 $118,382 126 $114,630 13 $42,532 0 $0 13 $123,396
Aggregated Statistics For Year 2002(Based on 4 partial tracts) A) FHA, FSA/RHS & VA B) Conventional C) Refinancings D) Home Improvement Loans E) Loans on Dwellings For 5+ Families F) Non-occupant Loans on Number Average Value Number Average Value Number Average Value Number Average Value Number Average Value Number Average Value
LOANS ORIGINATED 43 $131,402 105 $118,515 158 $100,037 12 $26,774 0 $0 51 $100,872 APPLICATIONS APPROVED, NOT ACCEPTED 0 $0 7 $117,293 22 $80,688 4 $26,185 0 $0 4 $63,252 APPLICATIONS DENIED 4 $145,578 28 $107,818 57 $94,028 14 $15,989 2 $220,605 4 $39,065 APPLICATIONS WITHDRAWN 4 $169,992 6 $111,818 54 $110,956 3 $16,437 0 $0 7 $98,770 FILES CLOSED FOR INCOMPLETENESS 0 $0 5 $144,900 24 $98,806 0 $0 0 $0 1 $131,830
Aggregated Statistics For Year 2001(Based on 4 partial tracts) A) FHA, FSA/RHS & VA B) Conventional C) Refinancings D) Home Improvement Loans F) Non-occupant Loans on Number Average Value Number Average Value Number Average Value Number Average Value Number Average Value
LOANS ORIGINATED 54 $118,144 76 $102,499 142 $100,190 7 $54,089 47 $90,491 APPLICATIONS APPROVED, NOT ACCEPTED 1 $127,410 7 $97,199 22 $76,211 2 $26,825 1 $63,180 APPLICATIONS DENIED 8 $127,246 24 $70,730 74 $80,808 20 $19,549 3 $77,663 APPLICATIONS WITHDRAWN 1 $128,470 8 $127,978 44 $97,949 8 $23,941 2 $157,950 FILES CLOSED FOR INCOMPLETENESS 4 $95,368 3 $163,917 12 $73,554 0 $0 1 $61,070
Aggregated Statistics For Year 2000(Based on 4 partial tracts) A) FHA, FSA/RHS & VA B) Conventional C) Refinancings D) Home Improvement Loans E) Loans on Dwellings For 5+ Families F) Non-occupant Loans on Number Average Value Number Average Value Number Average Value Number Average Value Number Average Value Number Average Value
LOANS ORIGINATED 38 $102,051 81 $104,497 63 $77,654 11 $12,512 2 $756,580 31 $80,585 APPLICATIONS APPROVED, NOT ACCEPTED 1 $76,930 12 $55,585 17 $59,968 12 $21,996 0 $0 3 $61,030 APPLICATIONS DENIED 6 $70,552 56 $55,850 52 $66,590 30 $26,419 0 $0 10 $90,174 APPLICATIONS WITHDRAWN 3 $93,013 13 $94,534 35 $73,664 1 $10,530 0 $0 6 $93,543 FILES CLOSED FOR INCOMPLETENESS 0 $0 9 $69,957 14 $73,823 1 $5,260 0 $0 1 $98,240
Aggregated Statistics For Year 1999(Based on 1 full and 5 partial tracts) A) FHA, FSA/RHS & VA B) Conventional C) Refinancings D) Home Improvement Loans E) Loans on Dwellings For 5+ Families F) Non-occupant Loans on Number Average Value Number Average Value Number Average Value Number Average Value Number Average Value Number Average Value
LOANS ORIGINATED 314 $109,248 451 $96,022 370 $78,727 27 $21,250 2 $2,074,145 86 $88,976 APPLICATIONS APPROVED, NOT ACCEPTED 4 $97,512 51 $77,873 92 $77,916 30 $18,717 0 $0 14 $79,506 APPLICATIONS DENIED 35 $109,155 172 $62,765 228 $68,877 97 $17,294 0 $0 28 $79,916 APPLICATIONS WITHDRAWN 28 $109,152 45 $94,337 141 $68,199 8 $50,504 0 $0 8 $87,978 FILES CLOSED FOR INCOMPLETENESS 1 $118,100 13 $97,483 52 $84,329 2 $18,765 0 $0 4 $99,890
Private Mortgage Insurance Companies Aggregated Statistics For Year 2009(Based on 4 full and 12 partial tracts) A) Conventional B) Refinancings C) Non-occupant Loans on Number Average Value Number Average Value Number Average Value
LOANS ORIGINATED 29 $118,417 24 $194,522 0 $0 APPLICATIONS APPROVED, NOT ACCEPTED 8 $131,308 19 $147,495 1 $166,100 APPLICATIONS DENIED 1 $184,400 6 $173,632 0 $0 APPLICATIONS WITHDRAWN 2 $169,965 2 $102,625 0 $0 FILES CLOSED FOR INCOMPLETENESS 3 $219,203 0 $0 0 $0
Aggregated Statistics For Year 2008(Based on 4 full and 12 partial tracts) A) Conventional B) Refinancings C) Non-occupant Loans on Number Average Value Number Average Value Number Average Value
LOANS ORIGINATED 179 $149,016 93 $170,959 33 $109,412 APPLICATIONS APPROVED, NOT ACCEPTED 76 $149,517 53 $156,965 25 $116,887 APPLICATIONS DENIED 27 $156,794 9 $130,788 6 $130,042 APPLICATIONS WITHDRAWN 9 $154,326 9 $209,348 2 $107,170 FILES CLOSED FOR INCOMPLETENESS 8 $184,030 2 $152,870 3 $187,543
Aggregated Statistics For Year 2007(Based on 4 full and 12 partial tracts) A) Conventional B) Refinancings C) Non-occupant Loans on Number Average Value Number Average Value Number Average Value
LOANS ORIGINATED 466 $157,207 141 $146,374 54 $108,235 APPLICATIONS APPROVED, NOT ACCEPTED 33 $142,597 50 $147,150 11 $102,245 APPLICATIONS DENIED 9 $140,323 1 $115,980 2 $49,875 APPLICATIONS WITHDRAWN 19 $139,199 10 $140,084 4 $108,965 FILES CLOSED FOR INCOMPLETENESS 3 $155,777 0 $0 0 $0
Aggregated Statistics For Year 2006(Based on 4 full and 12 partial tracts) A) Conventional B) Refinancings C) Non-occupant Loans on Number Average Value Number Average Value Number Average Value
LOANS ORIGINATED 220 $144,107 65 $144,130 32 $123,459 APPLICATIONS APPROVED, NOT ACCEPTED 37 $135,642 27 $132,847 9 $110,494 APPLICATIONS DENIED 0 $0 0 $0 0 $0 APPLICATIONS WITHDRAWN 7 $142,390 3 $102,067 2 $134,810 FILES CLOSED FOR INCOMPLETENESS 0 $0 0 $0 0 $0
Aggregated Statistics For Year 2005(Based on 4 full and 12 partial tracts) A) Conventional B) Refinancings C) Non-occupant Loans on Number Average Value Number Average Value Number Average Value
LOANS ORIGINATED 261 $146,713 113 $137,633 77 $133,200 APPLICATIONS APPROVED, NOT ACCEPTED 29 $147,644 33 $140,678 4 $87,755 APPLICATIONS DENIED 11 $170,613 4 $135,972 10 $154,211 APPLICATIONS WITHDRAWN 14 $143,251 14 $161,935 8 $138,731 FILES CLOSED FOR INCOMPLETENESS 5 $128,732 0 $0 2 $87,470
Aggregated Statistics For Year 2004(Based on 4 full and 12 partial tracts) A) Conventional B) Refinancings C) Non-occupant Loans on Number Average Value Number Average Value Number Average Value
LOANS ORIGINATED 262 $140,148 150 $133,762 50 $117,913 APPLICATIONS APPROVED, NOT ACCEPTED 46 $136,311 48 $135,105 8 $98,162 APPLICATIONS DENIED 4 $154,980 6 $150,505 3 $116,637 APPLICATIONS WITHDRAWN 26 $146,170 34 $158,962 1 $38,150 FILES CLOSED FOR INCOMPLETENESS 2 $114,180 1 $131,630 0 $0
Aggregated Statistics For Year 2003(Based on 4 full and 12 partial tracts) A) Conventional B) Refinancings C) Non-occupant Loans on Number Average Value Number Average Value Number Average Value
LOANS ORIGINATED 413 $132,619 354 $133,088 74 $110,766 APPLICATIONS APPROVED, NOT ACCEPTED 31 $130,211 82 $137,826 6 $81,813 APPLICATIONS DENIED 8 $145,391 11 $145,949 4 $120,870 APPLICATIONS WITHDRAWN 15 $124,935 34 $130,348 9 $103,786 FILES CLOSED FOR INCOMPLETENESS 4 $140,085 3 $106,643 2 $87,470
Aggregated Statistics For Year 2002(Based on 4 partial tracts) A) Conventional B) Refinancings C) Non-occupant Loans on Number Average Value Number Average Value Number Average Value
LOANS ORIGINATED 43 $116,089 16 $116,236 10 $103,928 APPLICATIONS APPROVED, NOT ACCEPTED 6 $111,842 2 $115,655 0 $0 APPLICATIONS DENIED 1 $170,750 0 $0 0 $0 APPLICATIONS WITHDRAWN 4 $84,342 1 $69,500 0 $0 FILES CLOSED FOR INCOMPLETENESS 0 $0 0 $0 0 $0
Aggregated Statistics For Year 2001(Based on 4 partial tracts) A) Conventional B) Refinancings C) Non-occupant Loans on Number Average Value Number Average Value Number Average Value
LOANS ORIGINATED 41 $106,887 16 $118,829 10 $83,398 APPLICATIONS APPROVED, NOT ACCEPTED 6 $102,167 2 $116,225 1 $99,640 APPLICATIONS DENIED 1 $77,920 0 $0 0 $0 APPLICATIONS WITHDRAWN 0 $0 0 $0 0 $0 FILES CLOSED FOR INCOMPLETENESS 1 $94,770 0 $0 1 $94,770
Aggregated Statistics For Year 2000(Based on 4 partial tracts) A) Conventional B) Refinancings C) Non-occupant Loans on Number Average Value Number Average Value Number Average Value
LOANS ORIGINATED 38 $108,398 4 $131,180 7 $85,207 APPLICATIONS APPROVED, NOT ACCEPTED 7 $101,404 0 $0 0 $0 APPLICATIONS DENIED 3 $100,467 0 $0 1 $113,720 APPLICATIONS WITHDRAWN 5 $88,164 0 $0 0 $0 FILES CLOSED FOR INCOMPLETENESS 0 $0 0 $0 0 $0
Aggregated Statistics For Year 1999(Based on 1 full and 5 partial tracts) A) Conventional B) Refinancings C) Non-occupant Loans on Number Average Value Number Average Value Number Average Value
LOANS ORIGINATED 184 $105,547 46 $103,354 29 $85,517 APPLICATIONS APPROVED, NOT ACCEPTED 9 $96,886 8 $95,125 2 $66,345 APPLICATIONS DENIED 9 $115,724 3 $79,010 3 $113,313 APPLICATIONS WITHDRAWN 8 $91,050 2 $125,115 3 $50,703 FILES CLOSED FOR INCOMPLETENESS 2 $119,700 1 $139,590 0 $0
2002 - 2018 National Fire Incident Reporting System (NFIRS) incidents See full 2006 National Fire Incident Reporting System statistics for zip code 30008, Georgia
Most common first names in zip code 30008 among deceased individuals Name Count Lived (average)
Mary 35 78.7 years James 30 74.4 years John 30 73.2 years Charles 26 74.0 years Robert 22 70.2 years William 18 67.3 years Dorothy 18 76.2 years Ruth 15 84.1 years Louise 12 79.3 years Richard 12 63.6 years
Most common last names in zip code 30008 among deceased individuals Last name Count Lived (average)
Smith 23 82.1 years Brown 15 71.9 years Taylor 12 78.6 years Anderson 11 74.8 years Davis 9 73.6 years Moore 8 78.2 years Adams 8 72.9 years Johnson 8 71.6 years Scott 8 74.8 years Young 7 71.7 years
Businesses in zip code 30008
Name Count Name Count
AutoZone 1 Little Caesars Pizza 1 Brunswick Bowling & Billiards 1 Pizza Hut 1 Burger King 1 U-Haul 1 Chick-Fil-A 1 Waffle House 3 FedEx 1 Wendy's 1 KFC 1
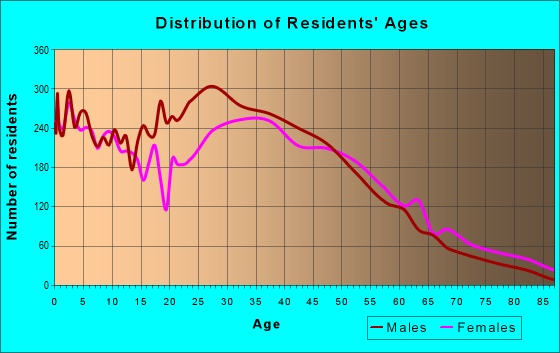
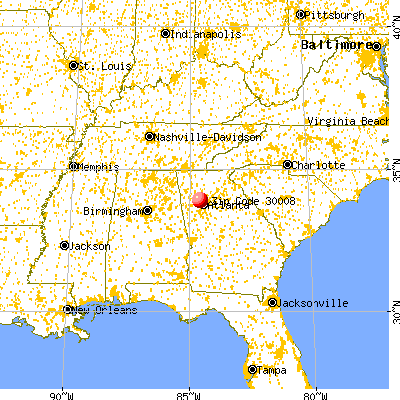


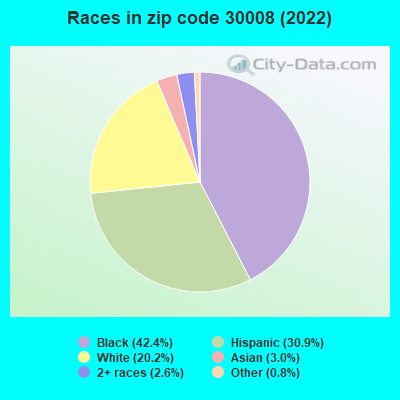


 Nearest zip codes: 30064, 30060, 30082, 30106, 30126, 30080.
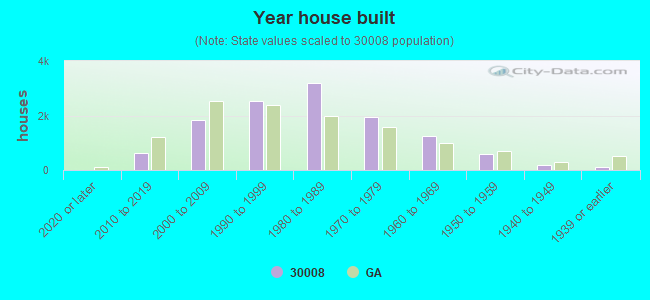
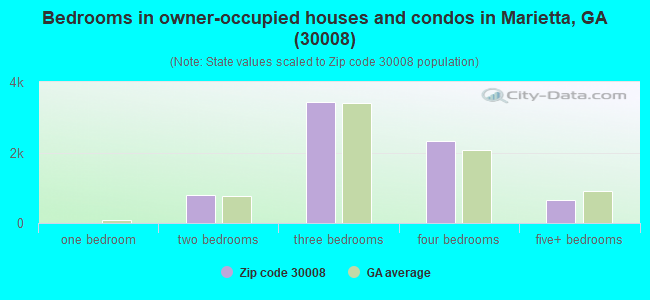
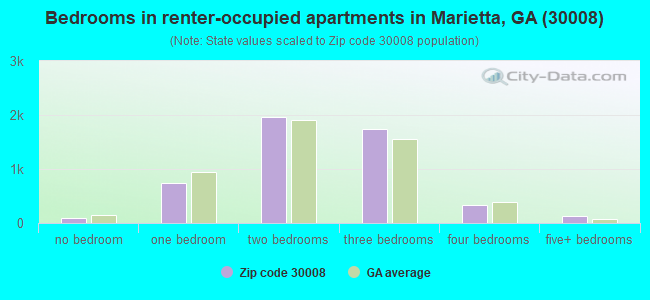
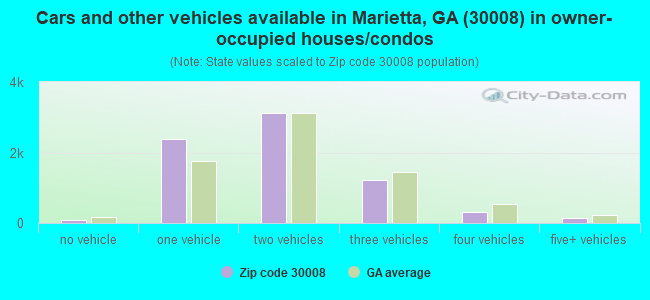
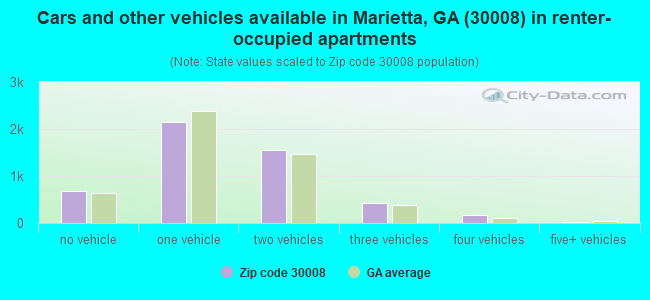


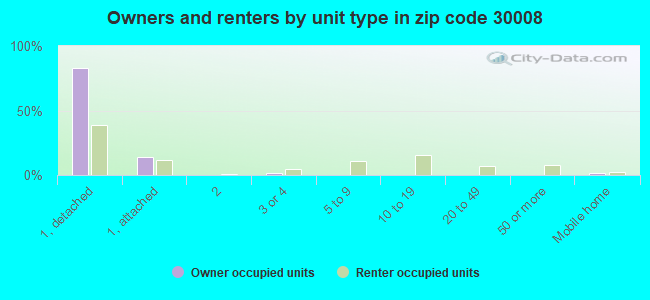
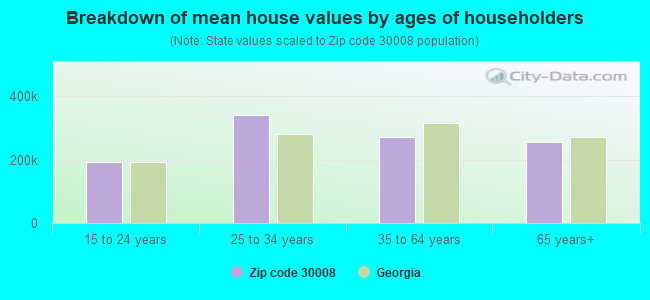


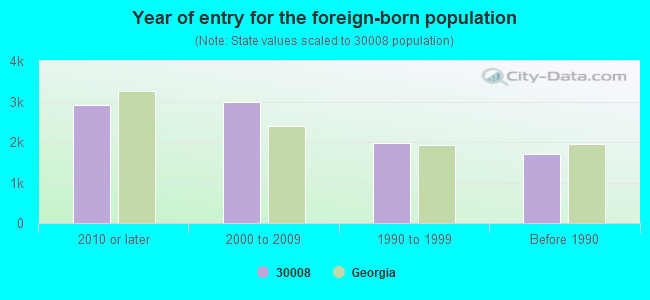


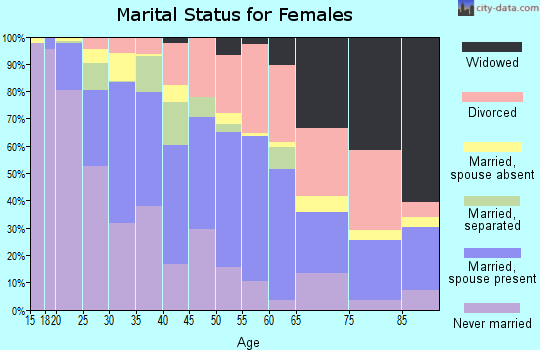
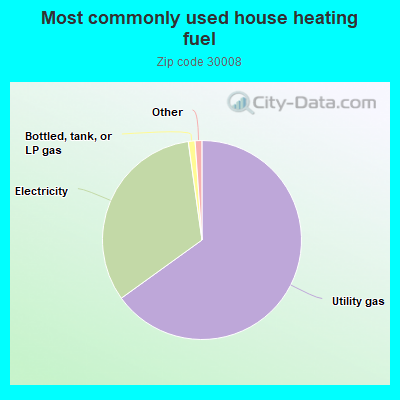
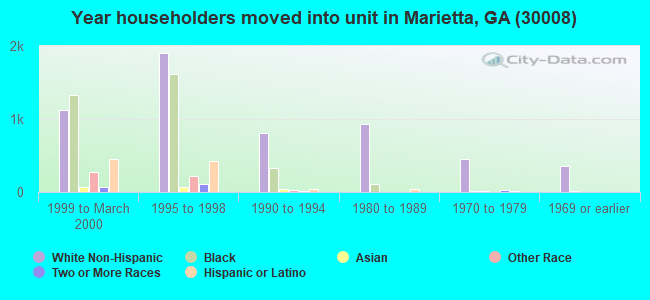


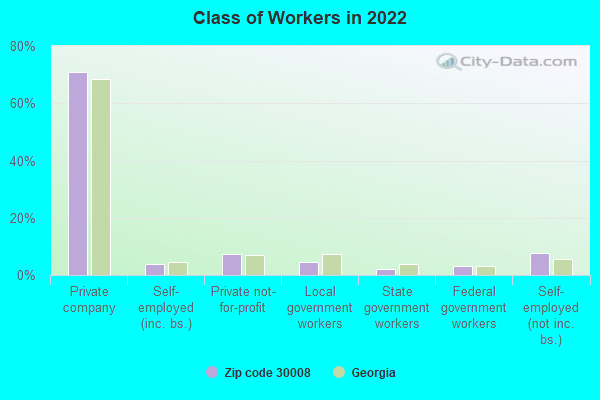
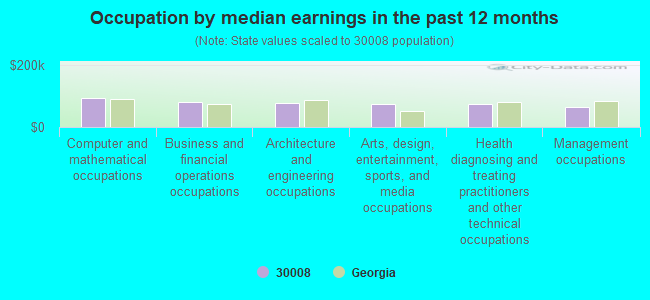
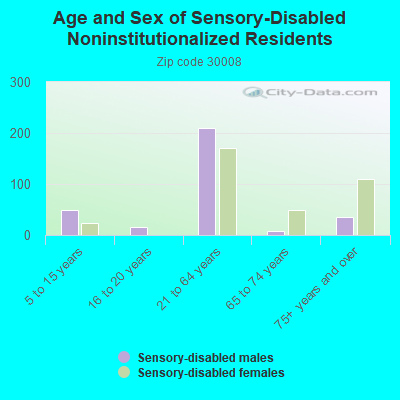
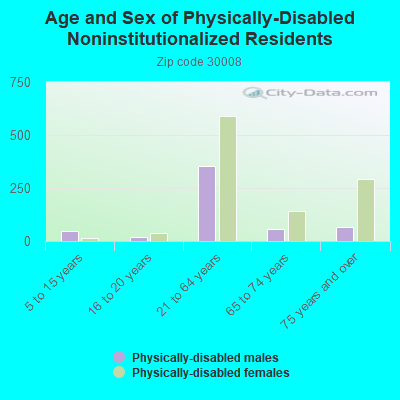

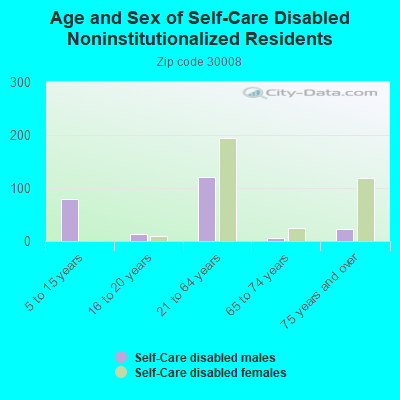
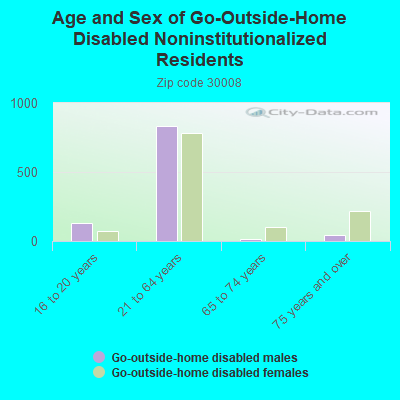
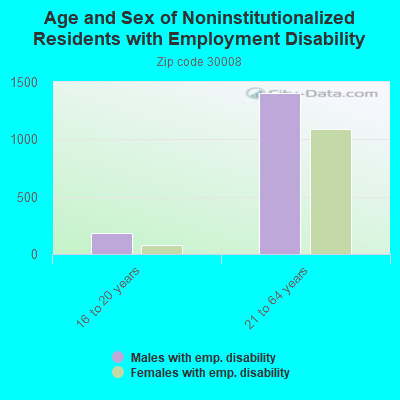
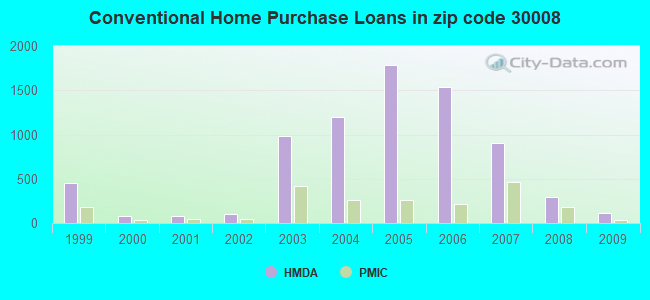
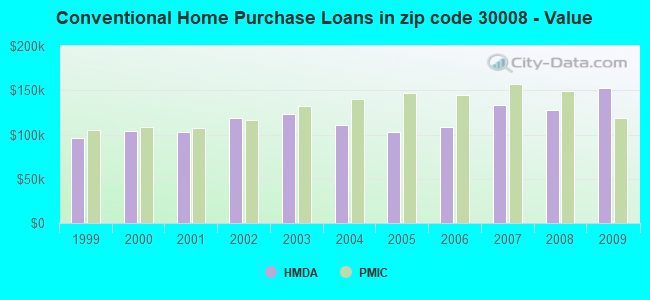
 Based on the data from the years 2002 - 2018 the average number of fire incidents per year is 77. The highest number of fire incidents - 148 took place in 2007, and the least - 47 in 2015. The data has a dropping trend.
 When looking into fire subcategories, the most reports belonged to: Structure Fires (38.5%), and Outside Fires (37.9%).