Estimated zip code population in 2022: 10,767 Zip code population in 2010: 9,481 Zip code population in 2000: 9,486
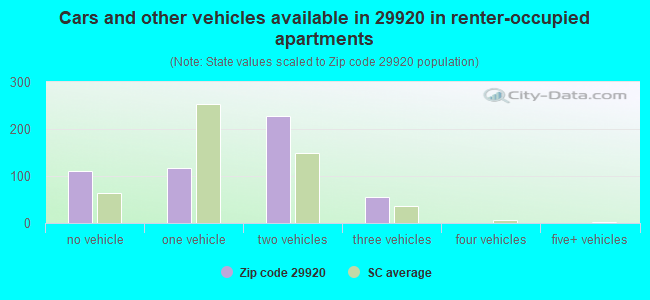
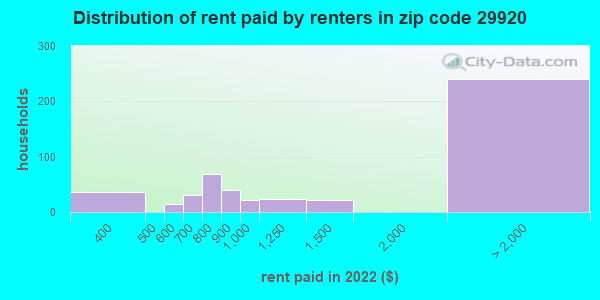
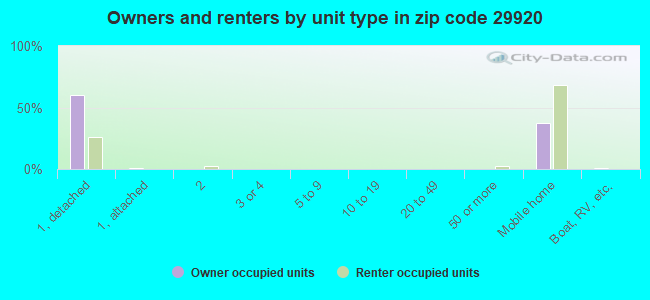
Houses and condos: 7,296 Renter-occupied apartments: 516
% of renters here:
11%
State:
28%
March 2022 cost of living index in zip code 29920: 82.6 (low, U.S. average is 100)
Land area: 97.7 sq. mi. Water area: 46.5 sq. mi.
Population density: 110 people per square mile
(very low).
OSM Map
General Map
Google Map
MSN Map
OSM Map
General Map
Google Map
MSN Map
OSM Map
General Map
Google Map
MSN Map
OSM Map
General Map
Google Map
MSN Map
Please wait while loading the map...
Real estate property taxes paid for housing units in 2022:
This zip code:
0.4% ($1,419)
South Carolina:
0.5% ($1,185)
Median real estate property taxes paid for housing units with mortgages in 2022: $1,489 (0.4%) Median real estate property taxes paid for housing units with no mortgage in 2022: $1,376 (0.4%)
Business Search- 14 Million verified businesses
Males: 5,555
(51.6%)
Females: 5,209
(48.4%)
For population 25 years and over in 29920:
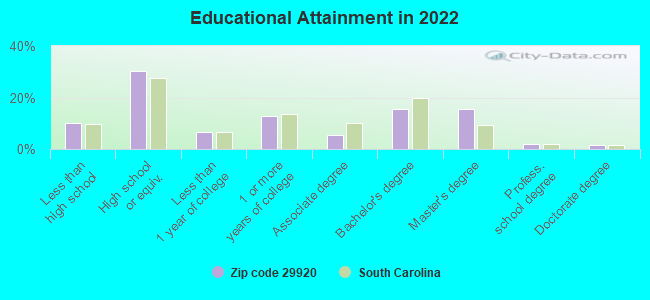
High school or higher: 89.9%
Bachelor's degree or higher: 34.9%
Graduate or professional degree: 19.5%
Unemployed: 0.8%
Mean travel time to work (commute): 32.4 minutes
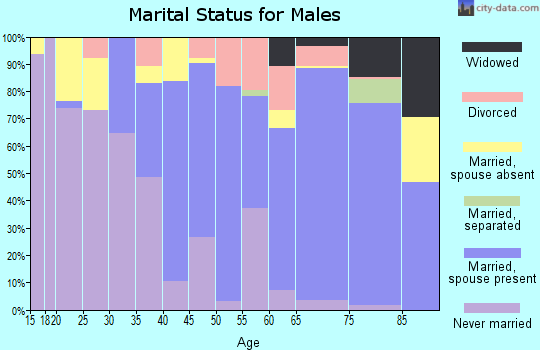
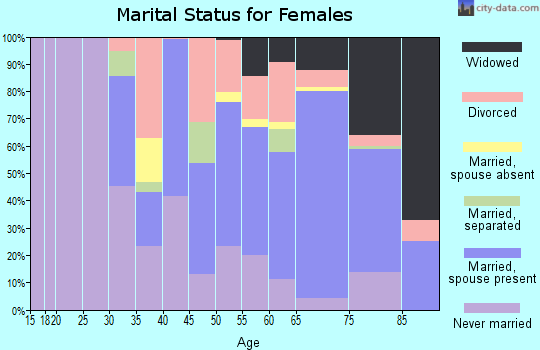
For population 15 years and over in 29920:
Never married: 28.4%
Now married: 53.8%
Separated: 1.7%
Widowed: 8.8%
Divorced: 7.3%
Zip code 29920 compared to state average:
Unemployed percentage significantly below state average.
Black race population percentage above state average.
Median age significantly above state average.
Renting percentage significantly below state average.
Length of stay since moving in significantly above state average.
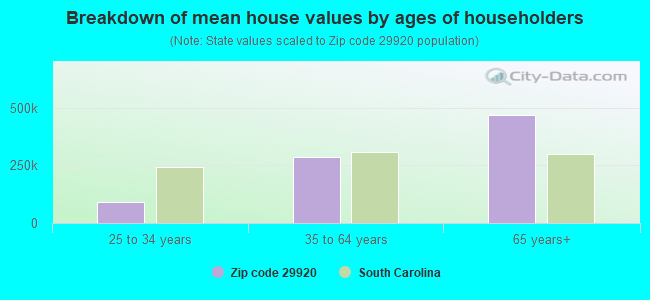
Estimated median house/condo value in 2022: $339,741
29920:
$339,741
South Carolina:
$254,600
According to our research of South Carolina and other state lists, there were 2 registered sex offenders living in 29920 zip code as of May 20, 2024. The ratio of all residents to sex offenders in zip code 29920 is 5,288 to 1. The ratio of registered sex offenders to all residents in this zip code is much lower than the state average.
Median resident age:
This zip code:
55.1 years
South Carolina median age:
40.5 years
Average household size:
This zip code:
2.3 people
South Carolina:
2.4 people
Averages for the 2020 tax year for zip code 29920, filed in 2021:
Average Adjusted Gross Income (AGI) in 2020: $74,022 (Individual Income Tax Returns)
Here:
$74,022
State:
$65,754
Salary/wage: $48,021 (reported on 70.0% of returns)
Here:
$48,021
State:
$52,566
(% of AGI for various income ranges: 1229.6% for AGIs below $25k, 3430.9% for AGIs $25k-50k, 5708.1% for AGIs $50k-75k, 6827.5% for AGIs $75k-100k, 11224.3% for AGIs $100k-200k, 73037.5% for AGIs over 200k)
Taxable interest for individuals: $2,592 (reported on 33.4% of returns)
This zip code:
$2,592
South Carolina:
$1,749
(% of AGI for various income ranges: 12.0% for AGIs below $25k, 31.2% for AGIs $25k-50k, 82.2% for AGIs $50k-75k, 271.2% for AGIs $75k-100k, 433.9% for AGIs $100k-200k, 2428.8% for AGIs over 200k)
Ordinary dividends: $14,310 (reported on 26.2% of returns)
Here:
$14,310
State:
$8,783
(% of AGI for various income ranges: 28.8% for AGIs below $25k, 80.0% for AGIs $25k-50k, 310.3% for AGIs $50k-75k, 750.6% for AGIs $75k-100k, 1702.1% for AGIs $100k-200k, 13151.2% for AGIs over 200k)
Net capital gain/loss in AGI: +$25,591 (reported on 24.7% of returns)
Here:
+$25,591
State:
+$24,194
(% of AGI for various income ranges: 17.2% for AGIs below $25k, 44.1% for AGIs $25k-50k, 207.2% for AGIs $50k-75k, 760.0% for AGIs $75k-100k, 2232.1% for AGIs $100k-200k, 28388.8% for AGIs over 200k)
Profit/loss from business: +$15,890 (reported on 16.7% of returns)
Here:
+$15,890
State:
+$11,253
(% of AGI for various income ranges: 98.3% for AGIs below $25k, 72.3% for AGIs $25k-50k, 301.2% for AGIs $50k-75k, 560.0% for AGIs $75k-100k, 1395.7% for AGIs $100k-200k, 6770.0% for AGIs over 200k)
Taxable individual retirement arrangement distribution: $34,844 (reported on 15.7% of returns)
29920:
$34,844
South Carolina:
$21,604
(% of AGI for various income ranges: 48.2% for AGIs below $25k, 134.5% for AGIs $25k-50k, 567.2% for AGIs $50k-75k, 1854.4% for AGIs $75k-100k, 3726.4% for AGIs $100k-200k, 12596.2% for AGIs over 200k)
Self-employed (Keogh) retirement plans: $29,275 (reported on 0.8% of returns)
29920:
$29,275
South Carolina:
$25,038
(% of AGI for various income ranges: 1463.8% for AGIs over 200k)
Total itemized deductions: $35,237 (reported on 12.1% of returns)
Here:
$35,237
State:
$35,199
(% of AGI for various income ranges: 56.4% for AGIs below $25k, 208.8% for AGIs $25k-50k, 579.7% for AGIs $50k-75k, 1306.2% for AGIs $75k-100k, 2042.5% for AGIs $100k-200k, 11006.2% for AGIs over 200k)
Charity contributions: $12,867 (reported on 10.3% of returns)
Here:
$12,867
State:
$14,319
(% of AGI for various income ranges: 44.4% for AGIs $25k-50k, 160.3% for AGIs $50k-75k, 219.4% for AGIs $75k-100k, 516.4% for AGIs $100k-200k, 4810.0% for AGIs over 200k)
Taxes paid: $7,358 (reported on 12.1% of returns)
29920:
$7,358
State:
$7,486
(% of AGI for various income ranges: 7.4% for AGIs below $25k, 27.6% for AGIs $25k-50k, 106.2% for AGIs $50k-75k, 281.2% for AGIs $75k-100k, 547.1% for AGIs $100k-200k, 2175.0% for AGIs over 200k)
Earned income credit: $2,461 (reported on 21.7% of returns)
Here:
$2,461
State:
$2,397
(% of AGI for various income ranges: 130.8% for AGIs below $25k, 95.2% for AGIs $25k-50k)
Percentage of individuals using paid preparers for their 2020 taxes: 89.7%
Here:
90%
State:
93%
(% for various income ranges: 90.7% for AGIs below $25k, 89.3% for AGIs $25k-50k, 87.3% for AGIs $50k-75k, 85.7% for AGIs $75k-100k, 89.7% for AGIs $100k-200k, 94.4% for AGIs over 200k)
Averages for the 2012 tax year for zip code 29920, filed in 2013:
Average Adjusted Gross Income (AGI) in 2012: $56,250 (Individual Income Tax Returns)
Here:
$56,250
State:
$51,133
Salary/wage: $34,622 (reported on 72.8% of returns)
Here:
$34,622
State:
$42,173
(% of AGI for various income ranges: 79.2% for AGIs below $25k, 68.4% for AGIs $25k-50k, 47.0% for AGIs $50k-75k, 36.2% for AGIs $75k-100k, 25.4% for AGIs $100k-200k, 39.7% for AGIs over 200k)
Taxable interest for individuals: $2,098 (reported on 31.2% of returns)
This zip code:
$2,098
South Carolina:
$1,468
(% of AGI for various income ranges: 0.8% for AGIs below $25k, 0.6% for AGIs $25k-50k, 1.1% for AGIs $50k-75k, 1.2% for AGIs $75k-100k, 1.5% for AGIs $100k-200k, 1.3% for AGIs over 200k)
Ordinary dividends: $12,468 (reported on 25.6% of returns)
Here:
$12,468
State:
$6,511
(% of AGI for various income ranges: 1.4% for AGIs below $25k, 2.4% for AGIs $25k-50k, 3.8% for AGIs $50k-75k, 6.0% for AGIs $75k-100k, 6.0% for AGIs $100k-200k, 9.1% for AGIs over 200k)
Net capital gain/loss in AGI: +$10,912 (reported on 23.0% of returns)
Here:
+$10,912
State:
+$13,061
(% of AGI for various income ranges: 0.4% for AGIs $25k-50k, 0.7% for AGIs $50k-75k, 1.9% for AGIs $75k-100k, 3.4% for AGIs $100k-200k, 11.6% for AGIs over 200k)
Profit/loss from business: +$11,492 (reported on 16.5% of returns)
Here:
+$11,492
State:
+$10,167
(% of AGI for various income ranges: 4.9% for AGIs below $25k, 2.2% for AGIs $25k-50k, 1.9% for AGIs $50k-75k, 2.0% for AGIs $75k-100k, 3.2% for AGIs $100k-200k, 4.6% for AGIs over 200k)
Taxable individual retirement arrangement distribution: $34,864 (reported on 18.1% of returns)
29920:
$34,864
South Carolina:
$17,019
(% of AGI for various income ranges: 2.8% for AGIs below $25k, 3.9% for AGIs $25k-50k, 10.0% for AGIs $50k-75k, 13.1% for AGIs $75k-100k, 17.5% for AGIs $100k-200k, 12.3% for AGIs over 200k)
Self-employment retirement plans: $17,500 (reported on 0.7% of returns)
29920:
$17,500
South Carolina:
$21,023
Total itemized deductions: $27,054 (23% of AGI, reported on 33.0% of returns)
Here:
$27,054
State:
$22,890
Here:
23.4% of AGI
State:
21.4% of AGI
(% of AGI for various income ranges: 12.0% for AGIs below $25k, 14.2% for AGIs $25k-50k, 18.1% for AGIs $50k-75k, 18.6% for AGIs $75k-100k, 17.8% for AGIs $100k-200k, 14.6% for AGIs over 200k)
Charity contributions: $5,772 (reported on 29.5% of returns)
Here:
$5,772
State:
$5,169
(% of AGI for various income ranges: 1.3% for AGIs below $25k, 2.1% for AGIs $25k-50k, 3.5% for AGIs $50k-75k, 2.9% for AGIs $75k-100k, 3.2% for AGIs $100k-200k, 3.9% for AGIs over 200k)
Taxes paid: $8,801 (reported on 32.8% of returns)
29920:
$8,801
State:
$7,644
(% of AGI for various income ranges: 1.8% for AGIs below $25k, 2.9% for AGIs $25k-50k, 4.2% for AGIs $50k-75k, 5.5% for AGIs $75k-100k, 5.8% for AGIs $100k-200k, 7.1% for AGIs over 200k)
Earned income credit: $2,492 (reported on 29.1% of returns)
Here:
$2,492
State:
$2,418
(% of AGI for various income ranges: 10.1% for AGIs below $25k, 1.5% for AGIs $25k-50k)
Percentage of individuals using paid preparers for their 2012 taxes: 48.6%
Here:
49%
State:
57%
(% for various income ranges: 41.7% for AGIs below $25k, 45.9% for AGIs $25k-50k, 51.2% for AGIs $50k-75k, 56.7% for AGIs $75k-100k, 64.4% for AGIs $100k-200k, 82.4% for AGIs over 200k)
Averages for the 2004 tax year for zip code 29920, filed in 2005:
Average Adjusted Gross Income (AGI) in 2004: $46,311 (Individual Income Tax Returns)
Here:
$46,311
State:
$41,965
Salary/wage: $29,257 (reported on 76.1% of returns)
Here:
$29,257
State:
$35,695
(% of AGI for various income ranges: 315.4% for AGIs below $10k, 80.1% for AGIs $10k-25k, 73.2% for AGIs $25k-50k, 51.3% for AGIs $50k-75k, 30.4% for AGIs $75k-100k, 31.6% for AGIs over 100k)
Taxable interest for individuals: $3,061 (reported on 37.6% of returns)
This zip code:
$3,061
South Carolina:
$1,623
(% of AGI for various income ranges: 17.9% for AGIs below $10k, 0.9% for AGIs $10k-25k, 1.5% for AGIs $25k-50k, 2.7% for AGIs $50k-75k, 3.2% for AGIs $75k-100k, 2.8% for AGIs over 100k)
Taxable dividends: $9,309 (reported on 26.7% of returns)
Here:
$9,309
State:
$3,999
(% of AGI for various income ranges: 13.5% for AGIs below $10k, 1.6% for AGIs $10k-25k, 1.9% for AGIs $25k-50k, 4.7% for AGIs $50k-75k, 5.6% for AGIs $75k-100k, 7.5% for AGIs over 100k)
Net capital gain/loss: +$19,869 (reported on 23.9% of returns)
Here:
+$19,869
State:
+$13,100
(% of AGI for various income ranges: -5.6% for AGIs below $10k, -0.6% for AGIs $10k-25k, 1.7% for AGIs $25k-50k, 3.0% for AGIs $50k-75k, 4.5% for AGIs $75k-100k, 19.5% for AGIs over 100k)
Profit/loss from business: +$12,698 (reported on 15.7% of returns)
Here:
+$12,698
State:
+$9,144
(% of AGI for various income ranges: -13.8% for AGIs below $10k, 4.9% for AGIs $10k-25k, 3.8% for AGIs $25k-50k, 2.7% for AGIs $50k-75k, 3.1% for AGIs $75k-100k, 5.3% for AGIs over 100k)
IRA payment deduction: $3,424 (reported on 2.3% of returns)
29920:
$3,424
South Carolina:
$2,972
(% of AGI for various income ranges: 0.2% for AGIs $10k-25k, 0.2% for AGIs $25k-50k, 0.3% for AGIs $50k-75k, 0.4% for AGIs $75k-100k, 0.1% for AGIs over 100k)
Self-employed pension: $19,333 (reported on 1.1% of returns)
Here:
$19,333
South Carolina:
$15,117
Total itemized deductions: $23,351 (24% of AGI, reported on 33.4% of returns)
Here:
$23,351
State:
$19,039
Here:
24.3% of AGI
State:
22.8% of AGI
(% of AGI for various income ranges: 47.4% for AGIs below $10k, 9.3% for AGIs $10k-25k, 15.3% for AGIs $25k-50k, 21.7% for AGIs $50k-75k, 21.7% for AGIs $75k-100k, 16.3% for AGIs over 100k)
Charity contributions deductions: $5,300 (5% of AGI, reported on 30.2% of returns)
Here:
$5,300
State:
$4,305
Here:
5.2% of AGI
State:
5.0% of AGI
(% of AGI for various income ranges: 2.5% for AGIs below $10k, 1.1% for AGIs $10k-25k, 2.7% for AGIs $25k-50k, 3.3% for AGIs $50k-75k, 4.0% for AGIs $75k-100k, 4.2% for AGIs over 100k)
Total tax: $8,396 (reported on 65.0% of returns)
29920:
$8,396
State:
$6,497
(% of AGI for various income ranges: 10.2% for AGIs below $10k, 2.8% for AGIs $10k-25k, 5.7% for AGIs $25k-50k, 8.6% for AGIs $50k-75k, 10.4% for AGIs $75k-100k, 17.3% for AGIs over 100k)
Earned income credit: $2,018 (reported on 30.2% of returns)
Here:
$2,018
State:
$1,882
Percentage of individuals using paid preparers for their 2004 taxes: 61.7%
Here:
62%
State:
66%
(% for various income ranges: 54.7% for AGIs below $10k, 65.5% for AGIs $10k-25k, 58.2% for AGIs $25k-50k, 60.3% for AGIs $50k-75k, 61.8% for AGIs $75k-100k, 72.6% for AGIs over 100k)
Household received Food Stamps/SNAP in the past 12 months: 468 Household did not receive Food Stamps/SNAP in the past 12 months: 4,095
Women who had a birth in the past 12 months: 130 (38 now married, 85 unmarried) Women who did not have a birth in the past 12 months: 1,272 (695 now married, 583 unmarried)
Housing units in zip code 29920 with a mortgage: 1,725 (149 second mortgage, 109 both second mortgage and home equity loan) Houses without a mortgage: 25
Median monthly owner costs for units with a mortgage: $1,437 Median monthly owner costs for units without a mortgage: $509
Residents with income below the poverty level in 2022:
This zip code:
17.8%
Whole state:
14.0%
Residents with income below 50% of the poverty level in 2022:
This zip code:
7.6%
Whole state:
7.3%
Median number of rooms in houses and condos:
Here:
6.1
State:
6.4
Median number of rooms in apartments:
Here:
5.3
State:
4.5
Notable locations in this zip code not listed on our city pages
Notable locations in zip code 29920: Hunting Island Lighthouse (A), Beaufort County Landing (B), Pine Landing (C), Orange Grove Plantation (D), Gleasons Landing (E), Coffin Point Plantation (F), Dataw Island Marina (G), County Landing (H), Little Gem Tree Farm (I), Beaufort County Library Saint Helena Branch (J), Fripp Island Fire Department (K), Lady's - Saint Helena Island Fire Department Station 24 (L), Lady's - Saint Helena Island Fire Department Station 22 (M), Lady's - Saint Helena Island Fire Department Station 23 (N), Penn Community Services (O). Display/hide their locations on the map
Churches in zip code 29920 include: Saint Joseph Church (A), Pinckney Church (B), Adam Street Church (C), Warsaw Church (D), Bethel Church (E), Ebenezer Church (F), Brick Church (G), Scottsville Church (H), Orange Grove Church (I). Display/hide their locations on the map
Cemeteries: Mulberry Hill Cemetery (1), Fripp Point Cemetery (2), Frogmore Cemetery (3), Fuller Cemetery (4), Pritchard Cemetery (5), Oakland Cemetery (6), Big House Cemetery (7). Display/hide their locations on the map
Rivers and creeks: Sparrow Nest Creek (A), Ward Creek (B), Pine Island Creek (C), Village Creek (D), Turtle Creek (E), Harbor River (F), Coffin Creek (G), Club Bridge Creek (H), Beaufort River (I). Display/hide their locations on the map
Tourist attractions (not listed on the city page) : Beaufort County - Libraries- St Helena Branch (Cultural Attractions- Events- & Facilities; 1025 Sea Island Parkway) (1), Gullah & Geechie MAHN Tours (Tours & Charters; 97 Perry Road) (2), Int'l' University of the Gullaheechee Nation (Tours & Charters; 869 Sea Island Parkway) (3), Gullah Geechee Sea Island Coalition (Tours & Charters; 17 Henry Holmes Road) (4), Kayak Farm (Tours & Charters; 1289 Sea Island Parkway) (5). Display/hide their approximate locations on the map
In group quarters: 260 (-1 institutionalized population)
Size of family households: 1,807 2-persons, 420 3-persons, 360 4-persons, 213 5-persons, 84 6-persons, 8 7-or-more-persons
Size of nonfamily households: 1,451 1-person, 217 2-persons, 20 3-persons
401 married couples with children.
394 single-parent households (92 men, 302 women).
93.7% of residents of 29920 zip code speak English at home.
5.8% of residents speak Spanish at home (5% very well, 28% well, 32% not well, 35% not at all).
0.9% of residents speak other Indo-European language at home (83% very well, 13% well, 4% not well).
0.1% of residents speak Asian or Pacific Island language at home (36% very well, 64% well).
0.1% of residents speak other language at home (100% very well).
Foreign born population: 613 (5.7%) (19.3% of them are naturalized citizens)
This zip code:
5.7%
Whole state:
5.2%
71%Honduras
6%France
4%India
2%Sweden
1%Ukraine
1%Haiti
1%St. Vincent and the Grenadines
10%English
6%German
6%American
3%Irish
2%Italian
1%Scotch-Irish
1%Scottish
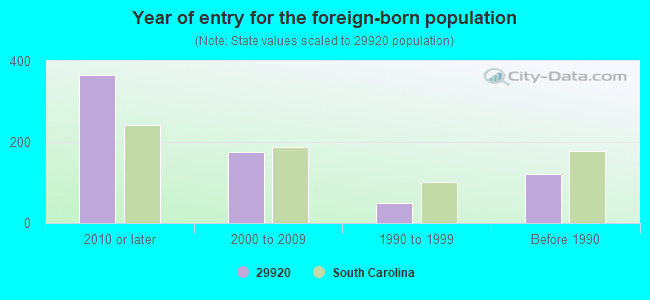
Year of entry for the foreign-born population
3652010 or later
1752000 to 2009
501990 to 1999
122Before 1990
Facilities with environmental interests located in this zip code:
FRIPP ISLAND PUBLIC SERVICE DISTRICT (291 TARPON BOULEVARD in FRIPP ISLAND, SC)
CRITERIA AND HAZARDOUS AIR POLLUTANT INVENTORY (Inventory of air pollution sources) STATE MASTER (South Carolina database) - 401 CERTIFICATION, DRINKING WATER PROGRAM STATE MASTER (South Carolina database) - National Pollutant Discharge Elimination System Permit, DRINKING WATER SYSTEM STATE MASTER (South Carolina database) - LABORATORY CERTIFICATION STATE MASTER (South Carolina database) - DRINKING WATER PROGRAM COMMUNITY WATER SYSTEM (SDWIS) Business SIC classification: SEWERAGE SYSTEMS Alternative names: FRIPP ISLAND PSD, FRIPP ISLAND PUBLIC SVC DIST
Housing units lacking complete plumbing facilities: 1.9% Housing units lacking complete kitchen facilities: 1.1%
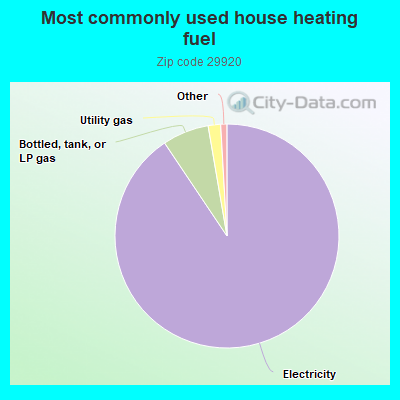
90.7%Electricity
6.7%Bottled, tank, or LP gas
1.8%Utility gas
Population in 1990: 4,669. Population change in the 1990s: +4,817 (+103.2%).
Place of birth for U.S.-born residents:
This state: 5,252
Northeast: 2,181
Midwest: 930
South: 1,465
West: 300
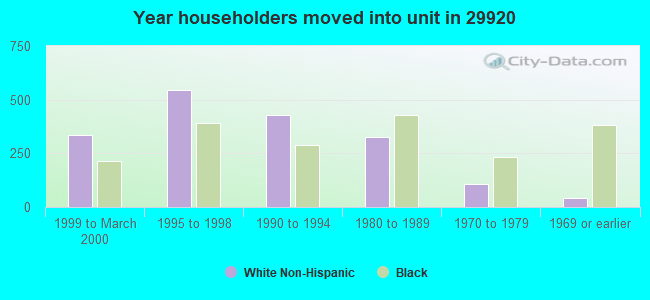
64% of the 29920 zip code residents lived in the same house 5 years ago. Out of people who lived in different houses, 39% lived in this county. Out of people who lived in different counties, 50% lived in South Carolina.
90% of the 29920 zip code residents lived in the same house 1 year ago. Out of people who lived in different houses, 38% moved from this county. Out of people who lived in different houses, 12% moved from different county within same state. Out of people who lived in different houses, 52% moved from different state.
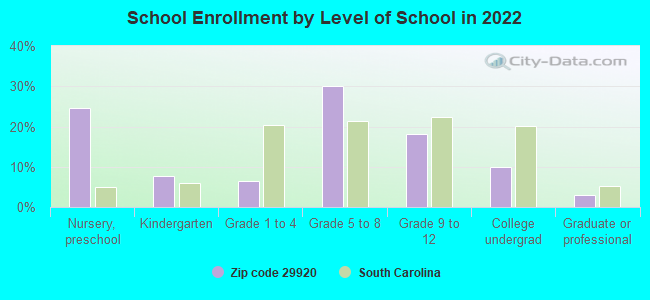
Private vs. public school enrollment:
Students in private schools in grades 1 to 8 (elementary and middle school): 9
Here:
1.5%
South Carolina:
14.4%
Students in private schools in grades 9 to 12 (high school):
Here:
0.0%
South Carolina:
11.1%
Students in private undergraduate colleges: 37
Here:
20.8%
South Carolina:
21.9%
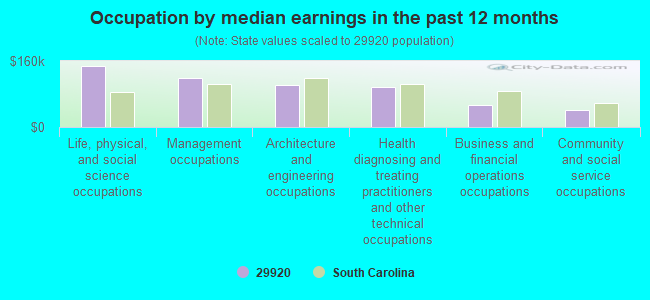
Occupation by median earnings in the past 12 months ($)
147,367Life, physical, and social science occupations
118,931Management occupations
102,045Architecture and engineering occupations
96,936Health diagnosing and treating practitioners and other technical occupations
53,049Business and financial operations occupations
41,582Community and social service occupations
Companies with federal contracts located in this zip code:
LAKE MOULTRIE WATER COMPANY, I (743 EDDINGS POINT ROAD in SAINT HELENA I, SC; small business) : $24,339,629 in 87 contractsfrom 2000 to 2006
Contracts for Maintenance, Repair or Alteration of Real Property -- Other Airfield Structures, Construction of Structures and Facilities -- Other Industrial Buildings, Maintenance, Repair or Alteration of Real Property -- Miscellaneous Buildings, Maintenance, Repair or Alteration of Real Property -- Laboratories and Clinics, and moreby Navy, U.S. Army Corps of Engineers - civil program financing only, Army Signed by year:2000: $157,679; 2001: $1,249,085; 2002: $1,153,302; 2003: $145,317; 2004: $7,662,595; 2005: $10,186,015; 2006: $3,785,636.
Biggest contracts:
$3,163,000 with Navy for Maintenance, Repair or Alteration of Real Property -- Other Airfield Structures. Signed on 2005-07-08. Completion date: 2007-01-15.
$2,774,500 with Navy for Construction of Structures and Facilities -- Other Industrial Buildings. Signed on 2004-09-28. Completion date: 2005-10-12.
$1,420,000 with Navy for Maintenance, Repair or Alteration of Real Property -- Miscellaneous Buildings. Signed on 2006-02-07. Completion date: 2007-02-22.
$1,248,085 with Navy for Maintenance, Repair or Alteration of Real Property -- Laboratories and Clinics. Signed on 2001-09-25. Completion date: 2002-09-19.
BRUCE HALL DR (6 PELICAN CV in SAINT HELENA I, SC; small business) : $474,382 in 7 contractsfrom 2000 to 2005
Contracts for Dentistry Services by Navy Signed by year:2000: $61,600; 2001: $94,266; 2002: $97,831; 2003: $0; 2004: $103,398; 2005: $117,287; 2006: $0.
Biggest contracts:
$103,398 with Navy for Dentistry Services. Signed on 2004-10-01. Completion date: 2005-09-30.
$97,468, same as above.Signed on 2002-10-01. Completion date: 2002-09-30.
$94,266, same as above.Signed on 2001-10-01. Completion date: 2002-09-30.
$82,600, same as above.Signed on 2005-11-10. Completion date: 2006-09-30.
LOW COST LOW COUNTRY CONSTRUCT (158 STORYTELLER RD in SAINT HELENA I, SC; small business) : $122,535 in 12 contractsfrom 2004 to 2005
Contracts for Construction of Structures and Facilities -- Maintenance Buildings, Maintenance, Repair or Alteration of Real Property -- Office Buildings, Maintenance, Repair or Alteration of Real Property -- Troop Housing Facilities, Maintenance, Repair or Alteration of Real Property -- Other Industrial Buildings by Navy Signed by year:2000: $0; 2001: $0; 2002: $0; 2003: $0; 2004: $5,432; 2005: $117,103; 2006: $0.
Biggest contracts:
$78,306 with Navy for Construction of Structures and Facilities -- Maintenance Buildings. Signed on 2004-08-25. Completion date: 2005-05-31.
$57,598 with Navy for Maintenance, Repair or Alteration of Real Property -- Office Buildings. Signed on 2005-01-05. Completion date: 2005-04-10.
$41,525, same as above.Signed on 2005-08-02. Completion date: 2005-10-03.
$5,134, same as above.Signed on 2004-08-19. Completion date: 2004-09-03.
ISAIAH DAISE (65 EPHRAIM RD in SAINT HELENA, SC; small business) : $13,200 in 2 contractsin 2002
$10,200 with Navy for Landscaping/Groundskeeping Services. Signed on 2002-03-13. Completion date: 2002-05-06.
$3,000, same as above.Signed on 2002-04-16. Completion date: 2002-05-06.
LANGFORD, O W , JR (14 LANGFORD in ST HELENA IS, SC; small business) : -$4,400 in 3 contractsfrom 2004 to 2005
$0 with Navy for Maintenance, Repair and Rebuilding of Equipment -- Furniture. Signed on 2004-07-13. Completion date: 2002-12-20.
-$55 with Navy for Miscellaneous Items. Signed on 2005-01-20. Completion date: 2002-08-13.
-$4,345 with Navy for Maintenance, Repair and Rebuilding of Equipment -- Furniture. Signed on 2004-07-13. Completion date: 2002-12-20.
Top industries in this zip code by the number of employees in 2005:
Arts, Entertainment, and Recreation: Golf Courses and Country Clubs (100-249 employees: 2 establishments)
Other Services (except Public Administration): Other Similar Organizations (except Business, Professional, Labor, and Political Organizations) (20-49: 1, 1-4: 3)
Construction: New Single-Family Housing Construction (except Operative Builders) (10-19: 1, 5-9: 1, 1-4: 8)
Construction: Other Heavy and Civil Engineering Construction (20-49: 1, 1-4: 2)
Health Care and Social Assistance: Offices of Physical, Occupational and Speech Therapists, and Audiologists (20-49: 1)
Administrative and Support and Waste Management and Remediation Services: Landscaping Services (5-9: 2, 1-4: 8)
Other Services (except Public Administration): Religious Organizations (5-9: 3, 1-4: 4)
People in group quarters in 2010:
22 people in workers' group living quarters and job corps centers
People in group quarters in 2000:
75 people in agriculture workers' dormitories on farms
9 people in homes for the physically handicapped
2 people in other nonhousehold living situations
Fatal accident statistics in 2014:
Fatal accident count: 1
Vehicles involved in fatal accidents: 2
Fatal accidents caused by drunken drivers: 0
Fatalities: 1
Persons involved in fatal accidents: 3
Pedestrians involved in fatal accidents: 0
Fatal accident statistics in 2012:
Fatal accident count: 3
Vehicles involved in fatal accidents: 3
Fatal accidents caused by drunken drivers: 2
Fatalities: 4
Persons involved in fatal accidents: 5
Pedestrians involved in fatal accidents: 0
2004 - 2018 National Fire Incident Reporting System (NFIRS) incidents
Based on the data from the years 2004 - 2018 the average number of fire incidents per year is 45. The highest number of reported fires - 103 took place in 2004, and the least - 0 in 2011. The data has a decreasing trend.
When looking into fire subcategories, the most reports belonged to: Outside Fires (64.9%), and Structure Fires (23.3%).
Fire incident types reported to NFIRS in Zip Code 29920

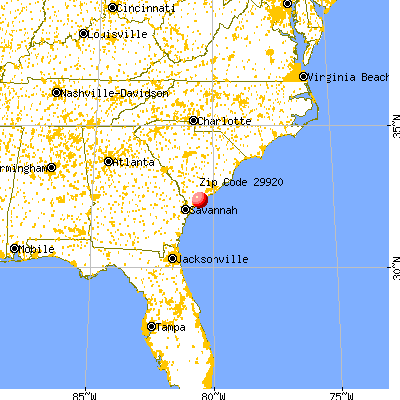


 Nearest zip codes: 29907, 29905, 29902, 29935, 29904, 29906.


 Based on the data from the years 2004 - 2018 the average number of fire incidents per year is 45. The highest number of reported fires - 103 took place in 2004, and the least - 0 in 2011. The data has a decreasing trend.
 When looking into fire subcategories, the most reports belonged to: Outside Fires (64.9%), and Structure Fires (23.3%).