Estimated zip code population in 2022: 1,205 Zip code population in 2010: 1,291 Zip code population in 2000: 1,344
Houses and condos: 599 Renter-occupied apartments: 62
% of renters here:
14%
State:
28%
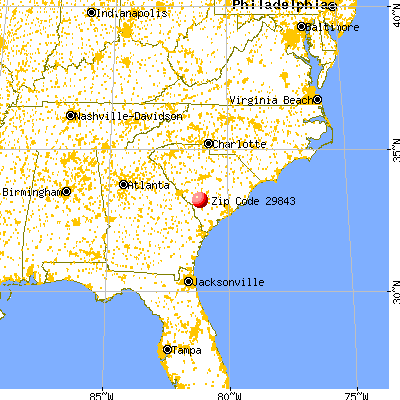
March 2022 cost of living index in zip code 29843: 79.2 (low, U.S. average is 100)
Land area: 63.8 sq. mi. Water area: 0.3 sq. mi.
Population density: 19 people per square mile
(very low).
OSM Map
General Map
Google Map
MSN Map
OSM Map
General Map
Google Map
MSN Map
OSM Map
General Map
Google Map
MSN Map
OSM Map
General Map
Google Map
MSN Map
Please wait while loading the map...
Real estate property taxes paid for housing units in 2022:
This zip code:
0.7% ($678)
South Carolina:
0.5% ($1,185)
Median real estate property taxes paid for housing units with mortgages in 2022: $983 (0.7%) Median real estate property taxes paid for housing units with no mortgage in 2022: $387 (0.6%)
Business Search- 14 Million verified businesses
Males: 701
(58.2%)
Females: 503
(41.8%)
For population 25 years and over in 29843:
High school or higher: 73.4%
Bachelor's degree or higher: 10.7%
Graduate or professional degree: 3.1%
Unemployed: 11.4%
Mean travel time to work (commute): 34.8 minutes
For population 15 years and over in 29843:
Never married: 26.1%
Now married: 52.0%
Separated: 3.2%
Widowed: 9.2%
Divorced: 9.4%
Zip code 29843 compared to state average:
Median house value significantly below state average.
Unemployed percentage above state average.
Black race population percentage above state average.
Hispanic race population percentage significantly below state average.
Foreign-born population percentage significantly below state average.
Renting percentage below state average.
Length of stay since moving in significantly above state average.
Number of college students significantly below state average.
Percentage of population with a bachelor's degree or higher significantly below state average.
Estimated median house/condo value in 2022: $100,097
29843:
$100,097
South Carolina:
$254,600
According to our research of South Carolina and other state lists, there was 1 registered sex offender living in 29843 zip code as of June 03, 2024. The ratio of all residents to sex offenders in zip code 29843 is 1,194 to 1. The ratio of registered sex offenders to all residents in this zip code is near the state average.
Median resident age:
This zip code:
42.2 years
South Carolina median age:
40.5 years
Average household size:
This zip code:
2.8 people
South Carolina:
2.4 people
Averages for the 2020 tax year for zip code 29843, filed in 2021:
Average Adjusted Gross Income (AGI) in 2020: $42,944 (Individual Income Tax Returns)
Here:
$42,944
State:
$65,754
Salary/wage: $36,022 (reported on 86.0% of returns)
Here:
$36,022
State:
$52,566
(% of AGI for various income ranges: 1450.0% for AGIs below $25k, 4226.7% for AGIs $25k-50k, 6415.0% for AGIs $50k-75k, 5085.0% for AGIs $75k-100k)
Taxable interest for individuals: $1,244 (reported on 20.9% of returns)
This zip code:
$1,244
South Carolina:
$1,749
(% of AGI for various income ranges: 13.6% for AGIs below $25k, 55.0% for AGIs $50k-75k, 177.5% for AGIs $75k-100k)
Ordinary dividends: $2,500 (reported on 7.0% of returns)
Here:
$2,500
State:
$8,783
(% of AGI for various income ranges: 187.5% for AGIs $50k-75k)
Net capital gain/loss in AGI: +$12,225 (reported on 9.3% of returns)
Here:
+$12,225
State:
+$24,194
(% of AGI for various income ranges: 1222.5% for AGIs $50k-75k)
Profit/loss from business: +$1,014 (reported on 16.3% of returns)
Here:
+$1,014
State:
+$11,253
(% of AGI for various income ranges: 107.1% for AGIs below $25k)
Taxable individual retirement arrangement distribution: $7,367 (reported on 7.0% of returns)
29843:
$7,367
South Carolina:
$21,604
(% of AGI for various income ranges: 157.9% for AGIs below $25k)
Earned income credit: $2,500 (reported on 25.6% of returns)
Here:
$2,500
State:
$2,397
(% of AGI for various income ranges: 142.9% for AGIs below $25k, 83.3% for AGIs $25k-50k)
Percentage of individuals using paid preparers for their 2020 taxes: 97.7%
Here:
98%
State:
93%
(% for various income ranges: 100.0% for AGIs below $25k, 91.7% for AGIs $25k-50k, 100.0% for AGIs $50k-75k, 100.0% for AGIs $75k-100k, 100.0% for AGIs $100k-200k)
Averages for the 2012 tax year for zip code 29843, filed in 2013:
Average Adjusted Gross Income (AGI) in 2012: $36,339 (Individual Income Tax Returns)
Here:
$36,339
State:
$51,133
Salary/wage: $31,857 (reported on 85.4% of returns)
Here:
$31,857
State:
$42,173
(% of AGI for various income ranges: 77.5% for AGIs below $25k, 85.5% for AGIs $25k-50k, 74.3% for AGIs $50k-75k, 170.6% for AGIs $75k-100k)
Taxable interest for individuals: $710 (reported on 24.4% of returns)
This zip code:
$710
South Carolina:
$1,468
(% of AGI for various income ranges: 0.1% for AGIs below $25k, 0.3% for AGIs $25k-50k, 1.2% for AGIs $50k-75k, 0.7% for AGIs $75k-100k)
Ordinary dividends: $1,100 (reported on 7.3% of returns)
Here:
$1,100
State:
$6,511
Net capital gain/loss in AGI: +$5,850 (reported on 9.8% of returns)
Here:
+$5,850
State:
+$13,061
Profit/loss from business: +$2,738 (reported on 19.5% of returns)
Here:
+$2,738
State:
+$10,167
Taxable individual retirement arrangement distribution: $7,733 (reported on 7.3% of returns)
29843:
$7,733
South Carolina:
$17,019
Total itemized deductions: $18,671 (25% of AGI, reported on 17.1% of returns)
Here:
$18,671
State:
$22,890
Here:
24.7% of AGI
State:
21.4% of AGI
(% of AGI for various income ranges: 14.0% for AGIs below $25k, 11.4% for AGIs $50k-75k, 29.6% for AGIs $75k-100k)
Charity contributions: $6,833 (reported on 14.6% of returns)
Here:
$6,833
State:
$5,169
(% of AGI for various income ranges: 3.8% for AGIs below $25k, 4.7% for AGIs $50k-75k, 8.3% for AGIs $75k-100k)
Taxes paid: $5,257 (reported on 17.1% of returns)
29843:
$5,257
State:
$7,644
(% of AGI for various income ranges: 2.1% for AGIs below $25k, 2.9% for AGIs $50k-75k, 11.6% for AGIs $75k-100k)
Earned income credit: $2,436 (reported on 34.1% of returns)
Here:
$2,436
State:
$2,418
(% of AGI for various income ranges: 10.2% for AGIs below $25k, 1.5% for AGIs $25k-50k)
Percentage of individuals using paid preparers for their 2012 taxes: 78.0%
Here:
78%
State:
57%
(% for various income ranges: 76.2% for AGIs below $25k, 72.7% for AGIs $25k-50k, 80.0% for AGIs $50k-75k, 200.0% for AGIs $75k-100k)
Averages for the 2004 tax year for zip code 29843, filed in 2005:
Average Adjusted Gross Income (AGI) in 2004: $28,689 (Individual Income Tax Returns)
Here:
$28,689
State:
$41,965
Salary/wage: $28,213 (reported on 85.5% of returns)
Here:
$28,213
State:
$35,695
(% of AGI for various income ranges: 116.8% for AGIs below $10k, 80.7% for AGIs $10k-25k, 86.4% for AGIs $25k-50k, 82.8% for AGIs $50k-75k, 81.2% for AGIs $75k-100k)
Taxable interest for individuals: $755 (reported on 31.3% of returns)
This zip code:
$755
South Carolina:
$1,623
(% of AGI for various income ranges: 4.0% for AGIs below $10k, 0.7% for AGIs $10k-25k, 0.6% for AGIs $25k-50k, 1.2% for AGIs $50k-75k, 0.7% for AGIs $75k-100k)
Taxable dividends: $911 (reported on 9.1% of returns)
Here:
$911
State:
$3,999
Net capital gain/loss: +$1,971 (reported on 7.1% of returns)
Here:
+$1,971
State:
+$13,100
Profit/loss from business: +$3,174 (reported on 13.9% of returns)
Here:
+$3,174
State:
+$9,144
Total itemized deductions: $15,000 (25% of AGI, reported on 17.2% of returns)
Here:
$15,000
State:
$19,039
Here:
25.0% of AGI
State:
22.8% of AGI
(% of AGI for various income ranges: 4.9% for AGIs $10k-25k, 7.9% for AGIs $25k-50k, 13.3% for AGIs $50k-75k, 11.3% for AGIs $75k-100k)
Charity contributions deductions: $5,160 (8% of AGI, reported on 15.2% of returns)
Here:
$5,160
State:
$4,305
Here:
8.5% of AGI
State:
5.0% of AGI
(% of AGI for various income ranges: 1.1% for AGIs $10k-25k, 2.3% for AGIs $25k-50k, 6.1% for AGIs $50k-75k, 2.4% for AGIs $75k-100k)
Total tax: $3,403 (reported on 61.2% of returns)
29843:
$3,403
State:
$6,497
(% of AGI for various income ranges: 4.4% for AGIs below $10k, 2.9% for AGIs $10k-25k, 5.7% for AGIs $25k-50k, 8.2% for AGIs $50k-75k, 11.9% for AGIs $75k-100k)
Earned income credit: $1,913 (reported on 34.9% of returns)
Here:
$1,913
State:
$1,882
Percentage of individuals using paid preparers for their 2004 taxes: 73.7%
Here:
74%
State:
66%
(% for various income ranges: 66.7% for AGIs below $10k, 70.9% for AGIs $10k-25k, 80.0% for AGIs $25k-50k, 78.6% for AGIs $50k-75k, 80.0% for AGIs $75k-100k)
Household received Food Stamps/SNAP in the past 12 months: 113 Household did not receive Food Stamps/SNAP in the past 12 months: 329
Women who had a birth in the past 12 months: 3 (3 now married, 0 unmarried) Women who did not have a birth in the past 12 months: 189 (170 now married, 23 unmarried)
Housing units in zip code 29843 with a mortgage: 110 Median monthly owner costs for units with a mortgage: $1,046 Median monthly owner costs for units without a mortgage: $303
Residents with income below the poverty level in 2022:
This zip code:
30.5%
Whole state:
14.0%
Residents with income below 50% of the poverty level in 2022:
This zip code:
20.7%
Whole state:
7.3%
Median number of rooms in houses and condos:
Here:
5.5
State:
6.4
Median number of rooms in apartments:
Here:
5.6
State:
4.5
Notable locations in this zip code not listed on our city pages
Churches in zip code 29843 include: Georges Creek Baptist Church (A), Bethel Church (B), Bethlehem Baptist Church (C), Ebenezer Baptist Church (D), First Baptist Church (E), Govan Baptist Church (F), Holiness Church (G), Memorial Baptist Church (H), Mizpah Church (I). Display/hide their locations on the map
Size of family households: 157 2-persons, 28 3-persons, 46 4-persons, 23 5-persons, 6 6-persons, 23 7-or-more-persons
Size of nonfamily households: 138 1-person, 18 2-persons
181 married couples with children.
96 single-parent households (12 men, 84 women).
99.7% of residents of 29843 zip code speak English at home.
0.2% of residents speak Spanish at home (100% very well).
Foreign born population: 2 (0.2%) (0.0% of them are naturalized citizens)
:
0.2%
Whole state:
5.2%
67%Japan
45%American
3%German
2%English
2%Irish
1%Italian
1%Swiss
0%Welsh
Year of entry for the foreign-born population
42010 or later
02000 to 2009
01990 to 1999
2Before 1990
Facilities with environmental interests located in this zip code:
EDISTO WOOD PRESERVING CO (RT 1 BOX 44A in OLAR, SC)
National Pollutant Discharge Elimination System NON-MAJOR (Tracking pollutant discharge elimination systems) - permit Small Quantity Generators, between 100 kg and 1000 kg of hazardous waste/month (Resource Conservation and Recovery Act (tracking hazardous waste)) - notification STATE MASTER (South Carolina database) - HAZARDOUS WASTE PROGRAM Business SIC classification: WOOD PRESERVING Organizations: OPERNAME (CONTACT/OPERATOR)
, DONALD BRANDT (CONTACT/OWNER)
Housing units lacking complete plumbing facilities: 13.3% Housing units lacking complete kitchen facilities: 8.9%
77.7%Electricity
17.8%Bottled, tank, or LP gas
3.1%Utility gas
1.7%Fuel oil, kerosene, etc.
Population in 1990: 1,503.
Place of birth for U.S.-born residents:
This state: 928
Northeast: 82
Midwest: 56
South: 113
77% of the 29843 zip code residents lived in the same house 5 years ago. Out of people who lived in different houses, 56% lived in this county. Out of people who lived in different counties, 50% lived in South Carolina.
83% of the 29843 zip code residents lived in the same house 1 year ago. Out of people who lived in different houses, 1% moved from this county. Out of people who lived in different houses, 63% moved from different county within same state. Out of people who lived in different houses, 43% moved from different state. Out of people who lived in different houses, 2% moved from abroad.
Private vs. public school enrollment:
Students in private schools in grades 1 to 8 (elementary and middle school): 62
Here:
48.4%
South Carolina:
14.4%
Students in private schools in grades 9 to 12 (high school):
Here:
0.0%
South Carolina:
11.1%
Students in private undergraduate colleges:
Here:
0.0%
South Carolina:
21.9%
Occupation by median earnings in the past 12 months ($)
75,877Farming, fishing, and forestry occupations
67,536Management occupations
60,147Office and administrative support occupations
32,184Installation, maintenance, and repair occupations
31,681Material moving occupations
28,570Production occupations
Top industries in this zip code by the number of employees in 2005:
Other Services (except Public Administration): Religious Organizations (1-4 employees: 3 establishments)
Other Services (except Public Administration): Other Automotive Mechanical and Electrical Repair and Maintenance (1-4: 1)
Other Services (except Public Administration): Automotive Body, Paint, and Interior Repair and Maintenance (1-4: 1)
Construction: Electrical Contractors (1-4: 1)
Wholesale Trade: Women's, Children's, and Infants' Clothing and Accessories Merchant Wholesalers (1-4: 1)
Health Care and Social Assistance: Offices of Chiropractors (1-4: 1)
Fatal accident statistics in 2013:
Fatal accident count: 1
Vehicles involved in fatal accidents: 1
Fatal accidents caused by drunken drivers: 1
Fatalities: 2
Persons involved in fatal accidents: 2
Pedestrians involved in fatal accidents: 0
2006 - 2018 National Fire Incident Reporting System (NFIRS) incidents
According to the data from the years 2006 - 2018 the average number of fires per year is 30. The highest number of reported fire incidents - 51 took place in 2008, and the least - 3 in 2006. The data has a rising trend.
When looking into fire subcategories, the most incidents belonged to: Outside Fires (49.1%), and Structure Fires (32.8%).
Fire incident types reported to NFIRS in Zip Code 29843


 Nearest zip codes: 29849, 29042, 29081, 29003, 29817, 29827.


 According to the data from the years 2006 - 2018 the average number of fires per year is 30. The highest number of reported fire incidents - 51 took place in 2008, and the least - 3 in 2006. The data has a rising trend.
 When looking into fire subcategories, the most incidents belonged to: Outside Fires (49.1%), and Structure Fires (32.8%).