Estimated zip code population in 2022: 2,825 Zip code population in 2010: 2,408 Zip code population in 2000: 2,301
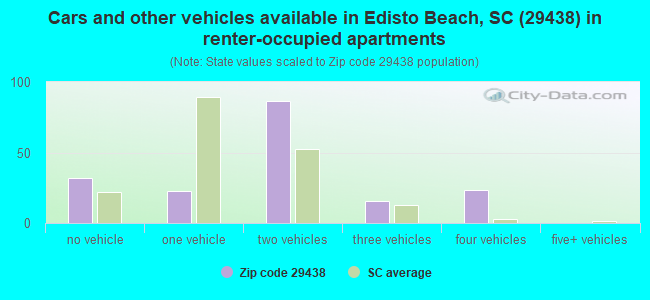
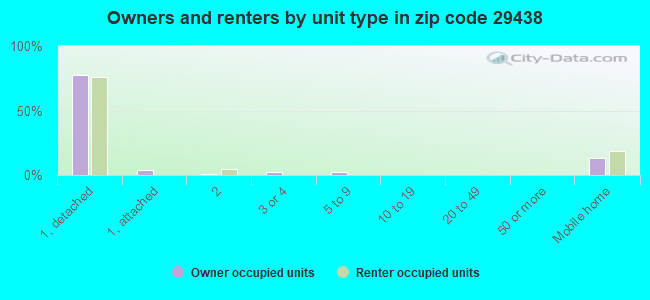
Houses and condos: 3,609 Renter-occupied apartments: 187
% of renters here:
13%
State:
28%
March 2022 cost of living index in zip code 29438: 86.1 (less than average, U.S. average is 100)
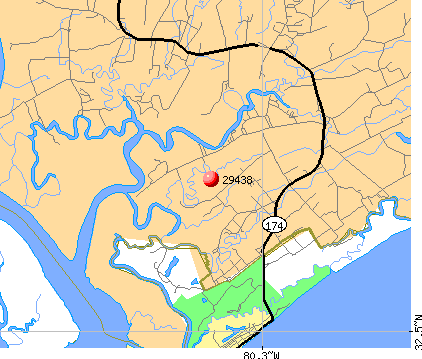
Land area: 74.7 sq. mi. Water area: 18.4 sq. mi.
Population density: 38 people per square mile
(very low).
OSM Map
General Map
Google Map
MSN Map
OSM Map
General Map
Google Map
MSN Map
OSM Map
General Map
Google Map
MSN Map
OSM Map
General Map
Google Map
MSN Map
Please wait while loading the map...
Real estate property taxes paid for housing units in 2022:
This zip code:
0.6% ($3,024)
South Carolina:
0.5% ($1,185)
Median real estate property taxes paid for housing units with mortgages in 2022: $3,292 (0.6%) Median real estate property taxes paid for housing units with no mortgage in 2022: $2,584 (0.5%)
Business Search- 14 Million verified businesses
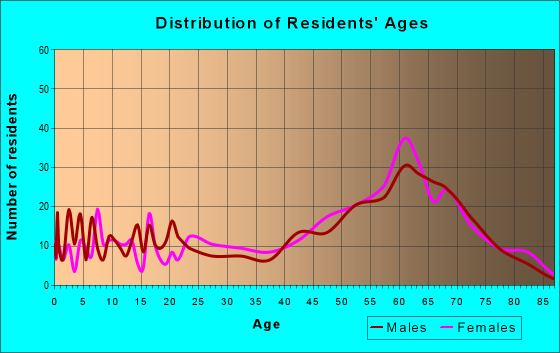
Males: 1,264
(44.7%)
Females: 1,562
(55.3%)
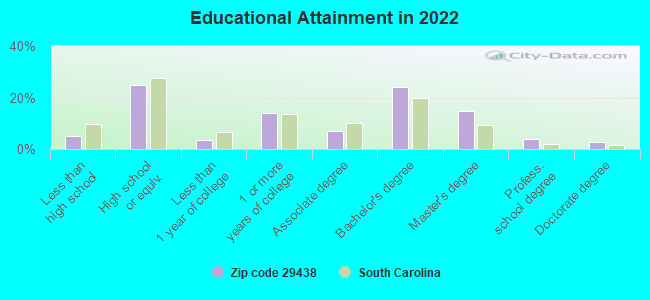
For population 25 years and over in 29438:
High school or higher: 96.1%
Bachelor's degree or higher: 46.0%
Graduate or professional degree: 21.6%
Unemployed: 6.0%
Mean travel time to work (commute): 26.9 minutes
For population 15 years and over in 29438:
Never married: 15.0%
Now married: 66.7%
Separated: 0.5%
Widowed: 8.9%
Divorced: 9.0%
Zip code 29438 compared to state average:
Median house value above state average.
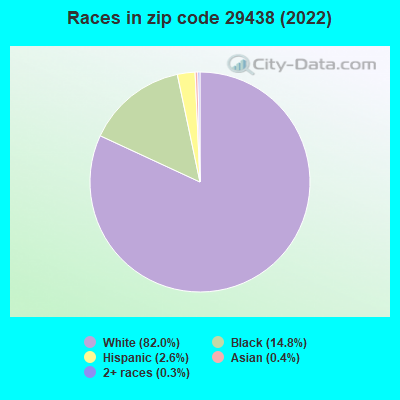
Black race population percentage below state average.
Hispanic race population percentage below state average.
Median age significantly above state average.
Foreign-born population percentage below state average.
Renting percentage below state average.
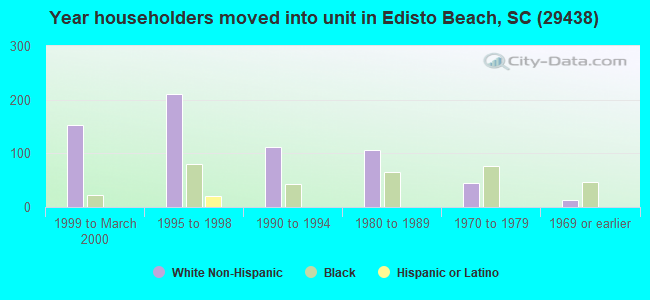
Length of stay since moving in above state average.
Number of college students below state average.
Percentage of population with a bachelor's degree or higher above state average.
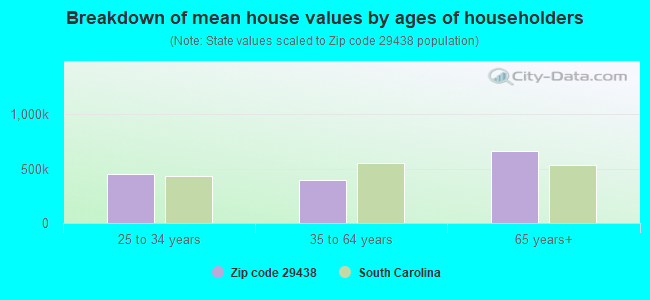
Estimated median house/condo value in 2022: $534,283
29438:
$534,283
South Carolina:
$254,600
Median resident age:
This zip code:
62.9 years
South Carolina median age:
40.5 years
Average household size:
This zip code:
2.0 people
South Carolina:
2.4 people
Averages for the 2020 tax year for zip code 29438, filed in 2021:
Average Adjusted Gross Income (AGI) in 2020: $102,726 (Individual Income Tax Returns)
Here:
$102,726
State:
$65,754
Salary/wage: $66,910 (reported on 65.2% of returns)
Here:
$66,910
State:
$52,566
(% of AGI for various income ranges: 1263.9% for AGIs below $25k, 3772.9% for AGIs $25k-50k, 6665.6% for AGIs $50k-75k, 9248.0% for AGIs $75k-100k, 13739.2% for AGIs $100k-200k, 76290.0% for AGIs over 200k)
Taxable interest for individuals: $3,123 (reported on 45.2% of returns)
This zip code:
$3,123
South Carolina:
$1,749
(% of AGI for various income ranges: 25.7% for AGIs below $25k, 75.3% for AGIs $25k-50k, 115.6% for AGIs $50k-75k, 380.0% for AGIs $75k-100k, 339.2% for AGIs $100k-200k, 3212.5% for AGIs over 200k)
Ordinary dividends: $13,214 (reported on 36.8% of returns)
Here:
$13,214
State:
$8,783
(% of AGI for various income ranges: 89.3% for AGIs below $25k, 180.0% for AGIs $25k-50k, 472.2% for AGIs $50k-75k, 986.0% for AGIs $75k-100k, 1717.5% for AGIs $100k-200k, 9992.5% for AGIs over 200k)
Net capital gain/loss in AGI: +$30,325 (reported on 32.9% of returns)
Here:
+$30,325
State:
+$24,194
(% of AGI for various income ranges: 21.4% for AGIs below $25k, 216.5% for AGIs $25k-50k, 204.4% for AGIs $50k-75k, 1006.0% for AGIs $75k-100k, 1965.0% for AGIs $100k-200k, 29982.5% for AGIs over 200k)
Profit/loss from business: +$25,112 (reported on 21.9% of returns)
Here:
+$25,112
State:
+$11,253
(% of AGI for various income ranges: 217.1% for AGIs below $25k, 328.8% for AGIs $25k-50k, 738.9% for AGIs $50k-75k, 368.0% for AGIs $75k-100k, 845.8% for AGIs $100k-200k, 13767.5% for AGIs over 200k)
Taxable individual retirement arrangement distribution: $31,667 (reported on 19.4% of returns)
29438:
$31,667
South Carolina:
$21,604
(% of AGI for various income ranges: 80.0% for AGIs below $25k, 261.2% for AGIs $25k-50k, 625.6% for AGIs $50k-75k, 2080.0% for AGIs $75k-100k, 3392.5% for AGIs $100k-200k, 7895.0% for AGIs over 200k)
Total itemized deductions: $38,520 (reported on 16.1% of returns)
Here:
$38,520
State:
$35,199
(% of AGI for various income ranges: 573.5% for AGIs $25k-50k, 981.1% for AGIs $50k-75k, 1332.0% for AGIs $75k-100k, 2458.3% for AGIs $100k-200k, 10390.0% for AGIs over 200k)
Charity contributions: $12,486 (reported on 14.2% of returns)
Here:
$12,486
State:
$14,319
(% of AGI for various income ranges: 38.9% for AGIs below $25k, 352.2% for AGIs $50k-75k, 586.7% for AGIs $100k-200k, 4042.5% for AGIs over 200k)
Taxes paid: $8,556 (reported on 16.1% of returns)
29438:
$8,556
State:
$7,486
(% of AGI for various income ranges: 66.4% for AGIs below $25k, 164.4% for AGIs $50k-75k, 318.0% for AGIs $75k-100k, 634.2% for AGIs $100k-200k, 2212.5% for AGIs over 200k)
Earned income credit: $1,933 (reported on 11.6% of returns)
Here:
$1,933
State:
$2,397
(% of AGI for various income ranges: 91.1% for AGIs below $25k, 54.7% for AGIs $25k-50k)
Percentage of individuals using paid preparers for their 2020 taxes: 91.6%
Here:
92%
State:
93%
(% for various income ranges: 91.5% for AGIs below $25k, 90.3% for AGIs $25k-50k, 89.5% for AGIs $50k-75k, 92.3% for AGIs $75k-100k, 92.9% for AGIs $100k-200k, 94.1% for AGIs over 200k)
Averages for the 2012 tax year for zip code 29438, filed in 2013:
Average Adjusted Gross Income (AGI) in 2012: $69,036 (Individual Income Tax Returns)
Here:
$69,036
State:
$51,133
Salary/wage: $40,633 (reported on 69.9% of returns)
Here:
$40,633
State:
$42,173
(% of AGI for various income ranges: 69.9% for AGIs below $25k, 61.0% for AGIs $25k-50k, 46.6% for AGIs $50k-75k, 37.1% for AGIs $75k-100k, 35.2% for AGIs $100k-200k, 32.7% for AGIs over 200k)
Taxable interest for individuals: $2,541 (reported on 43.9% of returns)
This zip code:
$2,541
South Carolina:
$1,468
(% of AGI for various income ranges: 1.0% for AGIs below $25k, 1.7% for AGIs $25k-50k, 1.0% for AGIs $50k-75k, 0.7% for AGIs $75k-100k, 1.9% for AGIs $100k-200k, 2.0% for AGIs over 200k)
Ordinary dividends: $11,438 (reported on 34.1% of returns)
Here:
$11,438
State:
$6,511
(% of AGI for various income ranges: 3.3% for AGIs below $25k, 3.6% for AGIs $25k-50k, 4.8% for AGIs $50k-75k, 3.9% for AGIs $75k-100k, 8.0% for AGIs $100k-200k, 6.0% for AGIs over 200k)
Net capital gain/loss in AGI: +$16,108 (reported on 30.1% of returns)
Here:
+$16,108
State:
+$13,061
(% of AGI for various income ranges: 1.5% for AGIs $25k-50k, 1.0% for AGIs $50k-75k, 2.0% for AGIs $75k-100k, 6.5% for AGIs $100k-200k, 13.5% for AGIs over 200k)
Profit/loss from business: +$8,931 (reported on 21.1% of returns)
Here:
+$8,931
State:
+$10,167
(% of AGI for various income ranges: 8.8% for AGIs below $25k, 3.5% for AGIs $25k-50k, 2.1% for AGIs $50k-75k, 5.3% for AGIs $75k-100k, 3.9% for AGIs $100k-200k)
Taxable individual retirement arrangement distribution: $22,145 (reported on 17.9% of returns)
29438:
$22,145
South Carolina:
$17,019
(% of AGI for various income ranges: 3.5% for AGIs below $25k, 4.8% for AGIs $25k-50k, 6.5% for AGIs $50k-75k, 9.3% for AGIs $75k-100k, 8.6% for AGIs $100k-200k, 3.5% for AGIs over 200k)
Total itemized deductions: $30,217 (24% of AGI, reported on 42.3% of returns)
Here:
$30,217
State:
$22,890
Here:
24.1% of AGI
State:
21.4% of AGI
(% of AGI for various income ranges: 21.2% for AGIs below $25k, 16.2% for AGIs $25k-50k, 23.3% for AGIs $50k-75k, 21.1% for AGIs $75k-100k, 22.9% for AGIs $100k-200k, 14.0% for AGIs over 200k)
Charity contributions: $6,366 (reported on 35.8% of returns)
Here:
$6,366
State:
$5,169
(% of AGI for various income ranges: 1.4% for AGIs below $25k, 2.4% for AGIs $25k-50k, 2.7% for AGIs $50k-75k, 3.2% for AGIs $75k-100k, 5.0% for AGIs $100k-200k, 3.0% for AGIs over 200k)
Taxes paid: $10,604 (reported on 42.3% of returns)
29438:
$10,604
State:
$7,644
(% of AGI for various income ranges: 4.0% for AGIs below $25k, 3.7% for AGIs $25k-50k, 5.8% for AGIs $50k-75k, 8.1% for AGIs $75k-100k, 8.4% for AGIs $100k-200k, 6.4% for AGIs over 200k)
Earned income credit: $2,165 (reported on 18.7% of returns)
Here:
$2,165
State:
$2,418
(% of AGI for various income ranges: 7.0% for AGIs below $25k, 0.6% for AGIs $25k-50k)
Percentage of individuals using paid preparers for their 2012 taxes: 66.7%
Here:
67%
State:
57%
(% for various income ranges: 59.6% for AGIs below $25k, 66.7% for AGIs $25k-50k, 69.2% for AGIs $50k-75k, 70.0% for AGIs $75k-100k, 78.6% for AGIs $100k-200k, 85.7% for AGIs over 200k)
Averages for the 2004 tax year for zip code 29438, filed in 2005:
Average Adjusted Gross Income (AGI) in 2004: $52,030 (Individual Income Tax Returns)
Here:
$52,030
State:
$41,965
Salary/wage: $33,195 (reported on 74.3% of returns)
Here:
$33,195
State:
$35,695
(% of AGI for various income ranges: 152.3% for AGIs below $10k, 76.3% for AGIs $10k-25k, 65.3% for AGIs $25k-50k, 44.4% for AGIs $50k-75k, 41.0% for AGIs $75k-100k, 37.7% for AGIs over 100k)
Taxable interest for individuals: $3,020 (reported on 45.7% of returns)
This zip code:
$3,020
South Carolina:
$1,623
(% of AGI for various income ranges: 9.2% for AGIs below $10k, 1.1% for AGIs $10k-25k, 2.4% for AGIs $25k-50k, 2.7% for AGIs $50k-75k, 2.1% for AGIs $75k-100k, 2.9% for AGIs over 100k)
Taxable dividends: $6,534 (reported on 31.3% of returns)
Here:
$6,534
State:
$3,999
(% of AGI for various income ranges: 10.1% for AGIs below $10k, 3.0% for AGIs $10k-25k, 3.1% for AGIs $25k-50k, 3.3% for AGIs $50k-75k, 3.9% for AGIs $75k-100k, 4.3% for AGIs over 100k)
Net capital gain/loss: +$21,732 (reported on 25.7% of returns)
Here:
+$21,732
State:
+$13,100
(% of AGI for various income ranges: -5.8% for AGIs below $10k, -0.5% for AGIs $10k-25k, 0.6% for AGIs $25k-50k, 5.5% for AGIs $50k-75k, 9.8% for AGIs $75k-100k, 16.7% for AGIs over 100k)
Profit/loss from business: +$12,645 (reported on 21.7% of returns)
Here:
+$12,645
State:
+$9,144
(% of AGI for various income ranges: 17.2% for AGIs below $10k, 5.7% for AGIs $10k-25k, 5.9% for AGIs $25k-50k, 7.2% for AGIs $50k-75k, 8.4% for AGIs $75k-100k, 3.9% for AGIs over 100k)
IRA payment deduction: $3,727 (reported on 3.0% of returns)
29438:
$3,727
South Carolina:
$2,972
(% of AGI for various income ranges: 0.5% for AGIs $10k-25k, 0.8% for AGIs $50k-75k, 0.1% for AGIs over 100k)
Total itemized deductions: $24,432 (25% of AGI, reported on 36.4% of returns)
Here:
$24,432
State:
$19,039
Here:
25.1% of AGI
State:
22.8% of AGI
(% of AGI for various income ranges: 37.0% for AGIs below $10k, 12.3% for AGIs $10k-25k, 20.9% for AGIs $25k-50k, 22.8% for AGIs $50k-75k, 21.8% for AGIs $75k-100k, 14.7% for AGIs over 100k)
Charity contributions deductions: $5,601 (5% of AGI, reported on 33.4% of returns)
Here:
$5,601
State:
$4,305
Here:
5.4% of AGI
State:
5.0% of AGI
(% of AGI for various income ranges: 1.5% for AGIs $10k-25k, 3.5% for AGIs $25k-50k, 4.2% for AGIs $50k-75k, 3.9% for AGIs $75k-100k, 3.9% for AGIs over 100k)
Total tax: $9,680 (reported on 69.3% of returns)
29438:
$9,680
State:
$6,497
(% of AGI for various income ranges: 8.2% for AGIs below $10k, 3.4% for AGIs $10k-25k, 6.8% for AGIs $25k-50k, 9.3% for AGIs $50k-75k, 10.0% for AGIs $75k-100k, 17.3% for AGIs over 100k)
Earned income credit: $1,833 (reported on 21.4% of returns)
Here:
$1,833
State:
$1,882
Percentage of individuals using paid preparers for their 2004 taxes: 73.4%
Here:
73%
State:
66%
(% for various income ranges: 66.7% for AGIs below $10k, 74.2% for AGIs $10k-25k, 74.7% for AGIs $25k-50k, 77.4% for AGIs $50k-75k, 69.4% for AGIs $75k-100k, 81.6% for AGIs over 100k)
Likely homosexual households (counted as self-reported same-sex unmarried-partner households)
Lesbian couples: 0.3% of all households
Gay men: 0.0% of all households
Household received Food Stamps/SNAP in the past 12 months: 55 Household did not receive Food Stamps/SNAP in the past 12 months: 1,348
Women who had a birth in the past 12 months: 18 (19 now married, 0 unmarried) Women who did not have a birth in the past 12 months: 265 (131 now married, 134 unmarried)
Housing units in zip code 29438 with a mortgage: 604 (57 second mortgage, 3 home equity loan, 54 both second mortgage and home equity loan) Houses without a mortgage: 32
Median monthly owner costs for units with a mortgage: $2,138 Median monthly owner costs for units without a mortgage: $679
Residents with income below the poverty level in 2022:
This zip code:
7.5%
Whole state:
14.0%
Residents with income below 50% of the poverty level in 2022:
This zip code:
3.1%
Whole state:
7.3%
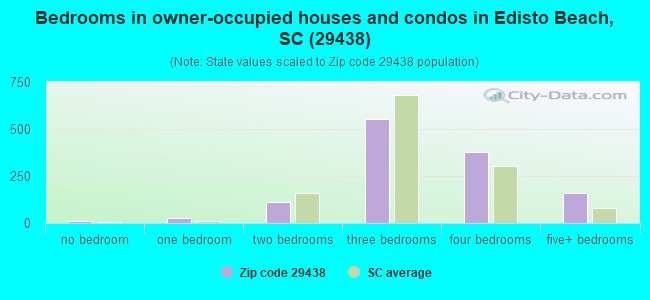
Median number of rooms in houses and condos:
Here:
6.2
State:
6.4
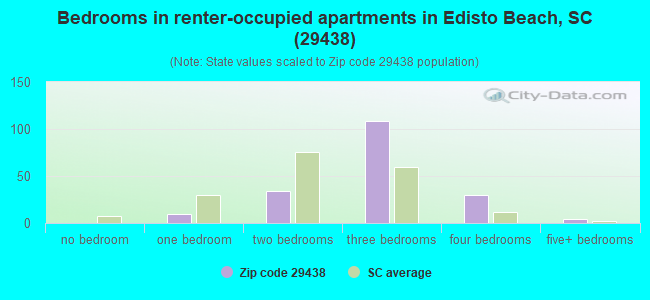
Median number of rooms in apartments:
Here:
5.1
State:
4.5
Notable locations in this zip code not listed on our city pages
Notable locations in zip code 29438: Peters Point Plantation (A), Dodge Plantation (B), Brookland Plantation (C), Edisto Island Library (D), Edisto Island Summary Court (E), The Edisto Island Museum (F), Colleton County Fire - Rescue Edisto Island (G), Colleton County Fire - Rescue Edisto Beach (H), Saint Paul's Fire Department Edisto Island (I), Edisto Beach Police Department (J), Charleston County Sheriff's Office (K). Display/hide their locations on the map
Churches in zip code 29438 include: Allen Church (A), Trinity Church (B), Ashley Church (C), Bethlehem Church (D), Zion Church (E), Galilee Church (F), Greater Calvary Church (G), Edisto Island Church (H), Edisto Church (I). Display/hide their locations on the map
Rivers and creeks: Whooping Island Creek (A), Store Creek (B), Steamboat Creek (C), Westbank Creek (D), Shingle Creek (E), Scott Creek (F), Sand Creek (G), Saint Pierre Creek (H), Russel Creek (I). Display/hide their locations on the map
Parks in zip code 29438 include: Ernest F. Hollings ACE Basin National Wildlife Refuge (1), Edisto Beach State Park (2). Display/hide their locations on the map
Tourist attractions (not listed on the city page) : Edisto Island Historic Preservation Society Museum (8123 Chisolm Plantation R) (1), Edisto Island Serpentarium & Gift Shop (Museums; 1374 Highway 174) (2), Edisto Chamber of Commerce (430 Highway 174) (3), Island Bikes and Outfitters Inc (Tours & Charters; 140 Jungle Road) (4), Edisto Watersports & Tackle Inc (Tours & Charters; 3731 Docksite Road) (5). Display/hide their approximate locations on the map
Size of family households: 827 2-persons, 98 3-persons, 45 4-persons, 36 5-persons, 2 6-persons
Size of nonfamily households: 370 1-person, 46 2-persons
166 married couples with children.
0 single-parent households ().
97.5% of residents of 29438 zip code speak English at home.
1.5% of residents speak Spanish at home (40% very well, 60% not well).
1.6% of residents speak other Indo-European language at home (100% very well).
0.4% of residents speak Asian or Pacific Island language at home (100% very well).
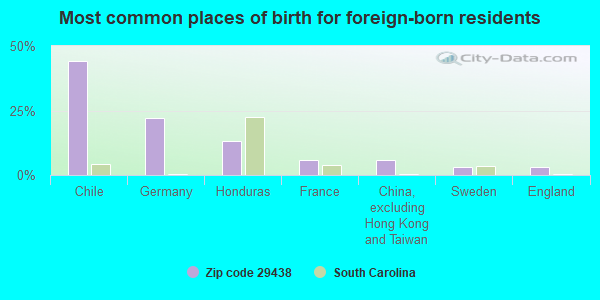
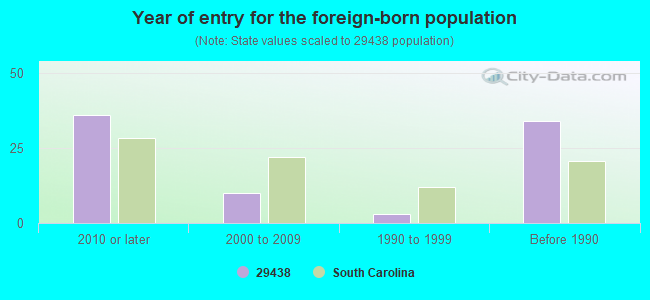
Foreign born population: 71 (2.5%) (69.5% of them are naturalized citizens)
This zip code:
2.5%
Whole state:
5.2%
44%Chile
22%Germany
13%Honduras
6%France
6%China, excluding Hong Kong and Taiwan
3%Sweden
3%England
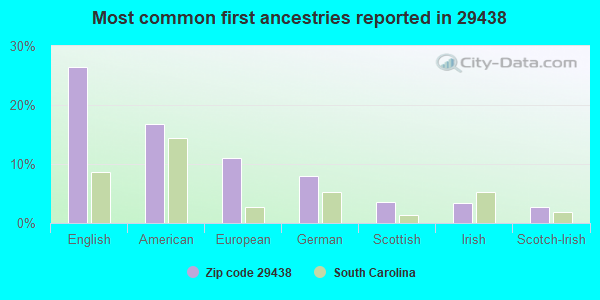
26%English
17%American
11%European
8%German
4%Scottish
3%Irish
3%Scotch-Irish
Year of entry for the foreign-born population
362010 or later
102000 to 2009
31990 to 1999
34Before 1990
Facilities with environmental interests located in this zip code:
FLOWERS OYSTER COMPANY (426 HWY 174 in EDISTO ISLAND, SC) . Federal Facility
AIR MINOR (AIRS/AFS) STATE MASTER (South Carolina database) - DRINKING WATER SYSTEM Business SIC classification: PREPARED FRESH OR FROZEN FISH AND SEAFOODS Alternative names: FLOWERS OYSTER - CLOSED
EDISTO BEACH ELEMENTARY (3002 LEE STREET in EDISTO BEACH, SC)
(National Center for Education Statistics) - STATE ID-1501019 Organizations: COLLETON COUNTY SCHOOL DISTRICT (SCHOOL DISTRICT)
EDISTO BEACH TOWN OF GOLF CLUB (2414 MURRAY ST in EDISTO BEACH, SC)
CRITERIA AND HAZARDOUS AIR POLLUTANT INVENTORY (Inventory of air pollution sources) STATE MASTER (South Carolina database) - National Pollutant Discharge Elimination System Permit Business SIC classification: SEWERAGE SYSTEMS
EDDINGS SAND/EDINGSVILLE ONE M (EDINGSVILLE BEACH RD in EDISTO ISLAND, SC)
National Pollutant Discharge Elimination System NON-MAJOR (Tracking pollutant discharge elimination systems) - permit Business SIC classification: MISCELLANEOUS NONMETALLIC MINERALS, EXCEPT FUELS
Housing units lacking complete plumbing facilities: 0.7% Housing units lacking complete kitchen facilities: 0.5%
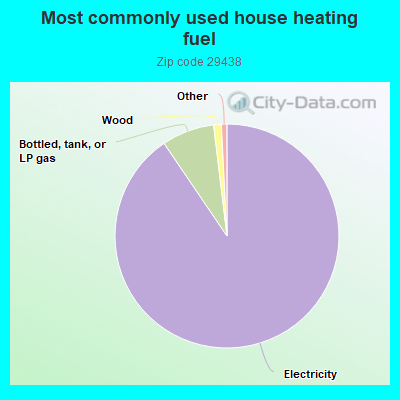
90.6%Electricity
7.6%Bottled, tank, or LP gas
1.1%Wood
Population in 1990: 1,669. Population change in the 1990s: +632 (+37.9%).
Place of birth for U.S.-born residents:
This state: 1,582
Northeast: 285
Midwest: 231
South: 600
West: 34
57% of the 29438 zip code residents lived in the same house 5 years ago. Out of people who lived in different houses, 45% lived in this county. Out of people who lived in different counties, 50% lived in South Carolina.
92% of the 29438 zip code residents lived in the same house 1 year ago. Out of people who lived in different houses, 17% moved from this county. Out of people who lived in different houses, 48% moved from different county within same state. Out of people who lived in different houses, 39% moved from different state.
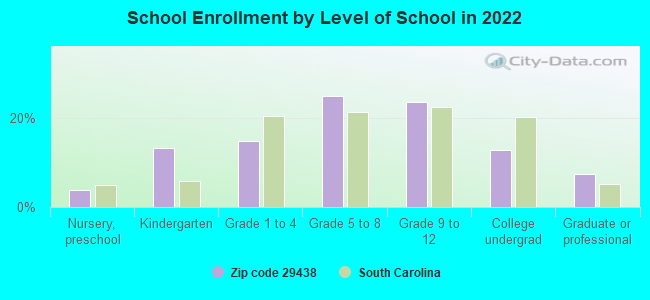
Private vs. public school enrollment:
Students in private schools in grades 1 to 8 (elementary and middle school): 23
Here:
22.3%
South Carolina:
14.4%
Students in private schools in grades 9 to 12 (high school):
Here:
0.0%
South Carolina:
11.1%
Students in private undergraduate colleges:
Here:
0.0%
South Carolina:
21.9%
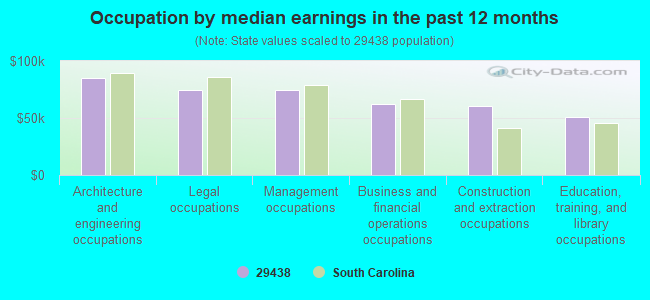
Occupation by median earnings in the past 12 months ($)
85,154Architecture and engineering occupations
74,565Legal occupations
74,247Management occupations
62,374Business and financial operations occupations
60,824Construction and extraction occupations
50,703Education, training, and library occupations
Top industries in this zip code by the number of employees in 2005:
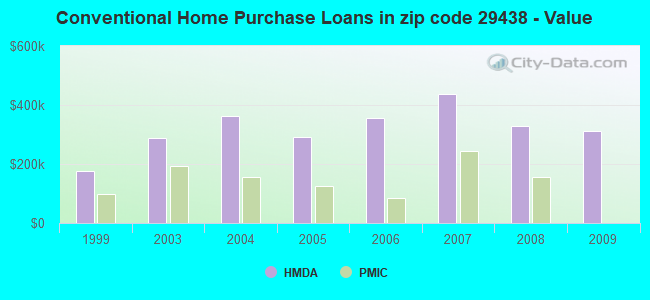
Detailed PMIC statistics for the following Tracts:0023.00
2002 - 2018 National Fire Incident Reporting System (NFIRS) incidents
Based on the data from the years 2002 - 2018 the average number of fires per year is 27. The highest number of reported fire incidents - 46 took place in 2010, and the least - 14 in 2003. The data has an increasing trend.
When looking into fire subcategories, the most incidents belonged to: Outside Fires (58.5%), and Structure Fires (25.8%).
Fire incident types reported to NFIRS in Zip Code 29438
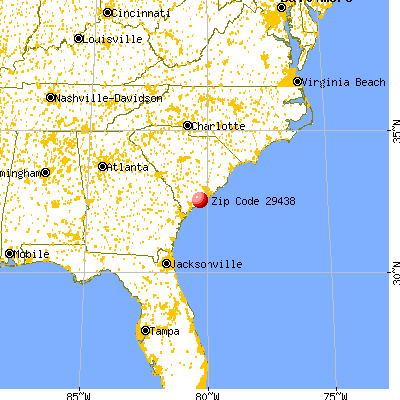


 Nearest zip codes: 29449, 29487, 29452, 29426, 29446, 29470.
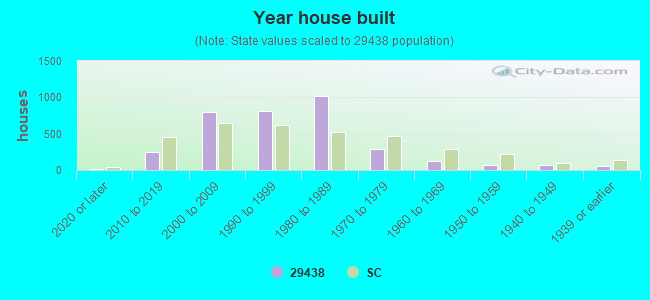


 . Federal Facility


 Based on the data from the years 2002 - 2018 the average number of fires per year is 27. The highest number of reported fire incidents - 46 took place in 2010, and the least - 14 in 2003. The data has an increasing trend.
 When looking into fire subcategories, the most incidents belonged to: Outside Fires (58.5%), and Structure Fires (25.8%).