Estimated zip code population in 2022: 20,454
Zip code population in 2010: 17,620
Zip code population in 2000: 15,715
Houses and condos: 10,884
Renter-occupied apartments: 3,257
% of renters here:
36%State:
33%
March 2022 cost of living index in zip code 28805: 92.9
(less than average, U.S. average is 100)
Land area: 26.0
sq. mi.
Water area: 0.0
sq. mi.
Population density: 788 people per square mile (low).
OSM Map
General Map
Google Map
MSN Map
OSM Map
General Map
Google Map
MSN Map
OSM Map
General Map
Google Map
MSN Map
OSM Map
General Map
Google Map
MSN Map
Please wait while loading the map...
Real estate property taxes paid for housing units in 2022:
This zip code:
0.5% ($2,127)North Carolina:
0.6% ($1,769)
Median real estate property taxes paid for housing units with mortgages in 2022: $2,301 (0.5%)
Median real estate property taxes paid for housing units with no mortgage in 2022: $1,897 (0.5%)
Profiles of local businesses
Business Search - 14 Million verified businesses
Males: 9,721 Females: 10,733
For population 25 years and over in 28805:
High school or higher: 97.9%Bachelor's degree or higher: 48.9%Graduate or professional degree: 19.7%Unemployed: 1.9%Mean travel time to work (commute): 18.2 minutes
For population 15 years and over in 28805:
Never married: 34.6%Now married: 43.5%Separated: 0.9%Widowed: 7.7%Divorced: 13.2%
Zip code 28805 compared to state average:
Unemployed percentage below state average. Black race population percentage below state average. Hispanic race population percentage below state average. Median age above state average. Length of stay since moving in significantly above state average. Percentage of population with a bachelor's degree or higher above state average. 16,560 81.0% White 1,989 9.7% Black 1,112 5.4% Hispanic or Latino 609 3.0% Two or more races 115 0.6% Asian 52 0.3% American Indian 15 0.07% Some other race
Data:
Median household income ($)
Median household income (% change since 2000)
Household income diversity
Ratio of average income to average house value (%)
Ratio of average income to average rent
Median household income ($) - White
Median household income ($) - Black or African American
Median household income ($) - Asian
Median household income ($) - Hispanic or Latino
Median household income ($) - American Indian and Alaska Native
Median household income ($) - Multirace
Median household income ($) - Other Race
Median household income for houses/condos with a mortgage ($)
Median household income for apartments without a mortgage ($)
Races - White alone (%)
Races - White alone (% change since 2000)
Races - Black alone (%)
Races - Black alone (% change since 2000)
Races - American Indian alone (%)
Races - American Indian alone (% change since 2000)
Races - Asian alone (%)
Races - Asian alone (% change since 2000)
Races - Hispanic (%)
Races - Hispanic (% change since 2000)
Races - Native Hawaiian and Other Pacific Islander alone (%)
Races - Native Hawaiian and Other Pacific Islander alone (% change since 2000)
Races - Two or more races (%)
Races - Two or more races (% change since 2000)
Races - Other race alone (%)
Races - Other race alone (% change since 2000)
Racial diversity
Unemployment (%)
Unemployment (% change since 2000)
Unemployment (%) - White
Unemployment (%) - Black or African American
Unemployment (%) - Asian
Unemployment (%) - Hispanic or Latino
Unemployment (%) - American Indian and Alaska Native
Unemployment (%) - Multirace
Unemployment (%) - Other Race
Population density (people per square mile)
Population - Males (%)
Population - Females (%)
Population - Males (%) - White
Population - Males (%) - Black or African American
Population - Males (%) - Asian
Population - Males (%) - Hispanic or Latino
Population - Males (%) - American Indian and Alaska Native
Population - Males (%) - Multirace
Population - Males (%) - Other Race
Population - Females (%) - White
Population - Females (%) - Black or African American
Population - Females (%) - Asian
Population - Females (%) - Hispanic or Latino
Population - Females (%) - American Indian and Alaska Native
Population - Females (%) - Multirace
Population - Females (%) - Other Race
Coronavirus confirmed cases (May 23, 2024)
Deaths caused by coronavirus (May 23, 2024)
Coronavirus confirmed cases (per 100k population) (May 23, 2024)
Deaths caused by coronavirus (per 100k population) (May 23, 2024)
Daily increase in number of cases (May 23, 2024)
Weekly increase in number of cases (May 23, 2024)
Cases doubled (in days) (May 23, 2024)
Hospitalized patients (Apr 18, 2022)
Negative test results (Apr 18, 2022)
Total test results (Apr 18, 2022)
COVID Vaccine doses distributed (per 100k population) (Sep 19, 2023)
COVID Vaccine doses administered (per 100k population) (Sep 19, 2023)
COVID Vaccine doses distributed (Sep 19, 2023)
COVID Vaccine doses administered (Sep 19, 2023)
Likely homosexual households (%)
Likely homosexual households (% change since 2000)
Likely homosexual households - Lesbian couples (%)
Likely homosexual households - Lesbian couples (% change since 2000)
Likely homosexual households - Gay men (%)
Likely homosexual households - Gay men (% change since 2000)
Cost of living index
Median gross rent ($)
Median contract rent ($)
Median monthly housing costs ($)
Median house or condo value ($)
Median house or condo value ($ change since 2000)
Mean house or condo value by units in structure - 1, detached ($)
Mean house or condo value by units in structure - 1, attached ($)
Mean house or condo value by units in structure - 2 ($)
Mean house or condo value by units in structure by units in structure - 3 or 4 ($)
Mean house or condo value by units in structure - 5 or more ($)
Mean house or condo value by units in structure - Boat, RV, van, etc. ($)
Mean house or condo value by units in structure - Mobile home ($)
Median house or condo value ($) - White
Median house or condo value ($) - Black or African American
Median house or condo value ($) - Asian
Median house or condo value ($) - Hispanic or Latino
Median house or condo value ($) - American Indian and Alaska Native
Median house or condo value ($) - Multirace
Median house or condo value ($) - Other Race
Median resident age
Resident age diversity
Median resident age - Males
Median resident age - Females
Median resident age - White
Median resident age - Black or African American
Median resident age - Asian
Median resident age - Hispanic or Latino
Median resident age - American Indian and Alaska Native
Median resident age - Multirace
Median resident age - Other Race
Median resident age - Males - White
Median resident age - Males - Black or African American
Median resident age - Males - Asian
Median resident age - Males - Hispanic or Latino
Median resident age - Males - American Indian and Alaska Native
Median resident age - Males - Multirace
Median resident age - Males - Other Race
Median resident age - Females - White
Median resident age - Females - Black or African American
Median resident age - Females - Asian
Median resident age - Females - Hispanic or Latino
Median resident age - Females - American Indian and Alaska Native
Median resident age - Females - Multirace
Median resident age - Females - Other Race
Commute - mean travel time to work (minutes)
Travel time to work - Less than 5 minutes (%)
Travel time to work - Less than 5 minutes (% change since 2000)
Travel time to work - 5 to 9 minutes (%)
Travel time to work - 5 to 9 minutes (% change since 2000)
Travel time to work - 10 to 19 minutes (%)
Travel time to work - 10 to 19 minutes (% change since 2000)
Travel time to work - 20 to 29 minutes (%)
Travel time to work - 20 to 29 minutes (% change since 2000)
Travel time to work - 30 to 39 minutes (%)
Travel time to work - 30 to 39 minutes (% change since 2000)
Travel time to work - 40 to 59 minutes (%)
Travel time to work - 40 to 59 minutes (% change since 2000)
Travel time to work - 60 to 89 minutes (%)
Travel time to work - 60 to 89 minutes (% change since 2000)
Travel time to work - 90 or more minutes (%)
Travel time to work - 90 or more minutes (% change since 2000)
Marital status - Never married (%)
Marital status - Now married (%)
Marital status - Separated (%)
Marital status - Widowed (%)
Marital status - Divorced (%)
Median family income ($)
Median family income (% change since 2000)
Median non-family income ($)
Median non-family income (% change since 2000)
Median per capita income ($)
Median per capita income (% change since 2000)
Median family income ($) - White
Median family income ($) - Black or African American
Median family income ($) - Asian
Median family income ($) - Hispanic or Latino
Median family income ($) - American Indian and Alaska Native
Median family income ($) - Multirace
Median family income ($) - Other Race
Median year house/condo built
Median year apartment built
Year house built - Built 2005 or later (%)
Year house built - Built 2000 to 2004 (%)
Year house built - Built 1990 to 1999 (%)
Year house built - Built 1980 to 1989 (%)
Year house built - Built 1970 to 1979 (%)
Year house built - Built 1960 to 1969 (%)
Year house built - Built 1950 to 1959 (%)
Year house built - Built 1940 to 1949 (%)
Year house built - Built 1939 or earlier (%)
Average household size
Household density (households per square mile)
Average household size - White
Average household size - Black or African American
Average household size - Asian
Average household size - Hispanic or Latino
Average household size - American Indian and Alaska Native
Average household size - Multirace
Average household size - Other Race
Occupied housing units (%)
Vacant housing units (%)
Owner occupied housing units (%)
Renter occupied housing units (%)
Vacancy status - For rent (%)
Vacancy status - For sale only (%)
Vacancy status - Rented or sold, not occupied (%)
Vacancy status - For seasonal, recreational, or occasional use (%)
Vacancy status - For migrant workers (%)
Vacancy status - Other vacant (%)
Residents with income below the poverty level (%)
Residents with income below 50% of the poverty level (%)
Children below poverty level (%)
Poor families by family type - Married-couple family (%)
Poor families by family type - Male, no wife present (%)
Poor families by family type - Female, no husband present (%)
Poverty status for native-born residents (%)
Poverty status for foreign-born residents (%)
Poverty among high school graduates not in families (%)
Poverty among people who did not graduate high school not in families (%)
Residents with income below the poverty level (%) - White
Residents with income below the poverty level (%) - Black or African American
Residents with income below the poverty level (%) - Asian
Residents with income below the poverty level (%) - Hispanic or Latino
Residents with income below the poverty level (%) - American Indian and Alaska Native
Residents with income below the poverty level (%) - Multirace
Residents with income below the poverty level (%) - Other Race
Air pollution - Air Quality Index (AQI)
Air pollution - CO
Air pollution - NO2
Air pollution - SO2
Air pollution - Ozone
Air pollution - PM10
Air pollution - PM25
Air pollution - Pb
Crime - Murders per 100,000 population
Crime - Rapes per 100,000 population
Crime - Robberies per 100,000 population
Crime - Assaults per 100,000 population
Crime - Burglaries per 100,000 population
Crime - Thefts per 100,000 population
Crime - Auto thefts per 100,000 population
Crime - Arson per 100,000 population
Crime - City-data.com crime index
Crime - Violent crime index
Crime - Property crime index
Crime - Murders per 100,000 population (5 year average)
Crime - Rapes per 100,000 population (5 year average)
Crime - Robberies per 100,000 population (5 year average)
Crime - Assaults per 100,000 population (5 year average)
Crime - Burglaries per 100,000 population (5 year average)
Crime - Thefts per 100,000 population (5 year average)
Crime - Auto thefts per 100,000 population (5 year average)
Crime - Arson per 100,000 population (5 year average)
Crime - City-data.com crime index (5 year average)
Crime - Violent crime index (5 year average)
Crime - Property crime index (5 year average)
1996 Presidential Elections Results (%) - Democratic Party (Clinton)
1996 Presidential Elections Results (%) - Republican Party (Dole)
1996 Presidential Elections Results (%) - Other
2000 Presidential Elections Results (%) - Democratic Party (Gore)
2000 Presidential Elections Results (%) - Republican Party (Bush)
2000 Presidential Elections Results (%) - Other
2004 Presidential Elections Results (%) - Democratic Party (Kerry)
2004 Presidential Elections Results (%) - Republican Party (Bush)
2004 Presidential Elections Results (%) - Other
2008 Presidential Elections Results (%) - Democratic Party (Obama)
2008 Presidential Elections Results (%) - Republican Party (McCain)
2008 Presidential Elections Results (%) - Other
2012 Presidential Elections Results (%) - Democratic Party (Obama)
2012 Presidential Elections Results (%) - Republican Party (Romney)
2012 Presidential Elections Results (%) - Other
2016 Presidential Elections Results (%) - Democratic Party (Clinton)
2016 Presidential Elections Results (%) - Republican Party (Trump)
2016 Presidential Elections Results (%) - Other
2020 Presidential Elections Results (%) - Democratic Party (Biden)
2020 Presidential Elections Results (%) - Republican Party (Trump)
2020 Presidential Elections Results (%) - Other
Ancestries Reported - Arab (%)
Ancestries Reported - Czech (%)
Ancestries Reported - Danish (%)
Ancestries Reported - Dutch (%)
Ancestries Reported - English (%)
Ancestries Reported - French (%)
Ancestries Reported - French Canadian (%)
Ancestries Reported - German (%)
Ancestries Reported - Greek (%)
Ancestries Reported - Hungarian (%)
Ancestries Reported - Irish (%)
Ancestries Reported - Italian (%)
Ancestries Reported - Lithuanian (%)
Ancestries Reported - Norwegian (%)
Ancestries Reported - Polish (%)
Ancestries Reported - Portuguese (%)
Ancestries Reported - Russian (%)
Ancestries Reported - Scotch-Irish (%)
Ancestries Reported - Scottish (%)
Ancestries Reported - Slovak (%)
Ancestries Reported - Subsaharan African (%)
Ancestries Reported - Swedish (%)
Ancestries Reported - Swiss (%)
Ancestries Reported - Ukrainian (%)
Ancestries Reported - United States (%)
Ancestries Reported - Welsh (%)
Ancestries Reported - West Indian (%)
Ancestries Reported - Other (%)
Educational Attainment - No schooling completed (%)
Educational Attainment - Less than high school (%)
Educational Attainment - High school or equivalent (%)
Educational Attainment - Less than 1 year of college (%)
Educational Attainment - 1 or more years of college (%)
Educational Attainment - Associate degree (%)
Educational Attainment - Bachelor's degree (%)
Educational Attainment - Master's degree (%)
Educational Attainment - Professional school degree (%)
Educational Attainment - Doctorate degree (%)
School Enrollment - Nursery, preschool (%)
School Enrollment - Kindergarten (%)
School Enrollment - Grade 1 to 4 (%)
School Enrollment - Grade 5 to 8 (%)
School Enrollment - Grade 9 to 12 (%)
School Enrollment - College undergrad (%)
School Enrollment - Graduate or professional (%)
School Enrollment - Not enrolled in school (%)
School enrollment - Public schools (%)
School enrollment - Private schools (%)
School enrollment - Not enrolled (%)
Median number of rooms in houses and condos
Median number of rooms in apartments
Housing units lacking complete plumbing facilities (%)
Housing units lacking complete kitchen facilities (%)
Density of houses
Urban houses (%)
Rural houses (%)
Households with people 60 years and over (%)
Households with people 65 years and over (%)
Households with people 75 years and over (%)
Households with one or more nonrelatives (%)
Households with no nonrelatives (%)
Population in households (%)
Family households (%)
Nonfamily households (%)
Population in families (%)
Family households with own children (%)
Median number of bedrooms in owner occupied houses
Mean number of bedrooms in owner occupied houses
Median number of bedrooms in renter occupied houses
Mean number of bedrooms in renter occupied houses
Median number of vehichles in owner occupied houses
Mean number of vehichles in owner occupied houses
Median number of vehichles in renter occupied houses
Mean number of vehichles in renter occupied houses
Mortgage status - with mortgage (%)
Mortgage status - with second mortgage (%)
Mortgage status - with home equity loan (%)
Mortgage status - with both second mortgage and home equity loan (%)
Mortgage status - without a mortgage (%)
Average family size
Average family size - White
Average family size - Black or African American
Average family size - Asian
Average family size - Hispanic or Latino
Average family size - American Indian and Alaska Native
Average family size - Multirace
Average family size - Other Race
Geographical mobility - Same house 1 year ago (%)
Geographical mobility - Moved within same county (%)
Geographical mobility - Moved from different county within same state (%)
Geographical mobility - Moved from different state (%)
Geographical mobility - Moved from abroad (%)
Place of birth - Born in state of residence (%)
Place of birth - Born in other state (%)
Place of birth - Native, outside of US (%)
Place of birth - Foreign born (%)
Housing units in structures - 1, detached (%)
Housing units in structures - 1, attached (%)
Housing units in structures - 2 (%)
Housing units in structures - 3 or 4 (%)
Housing units in structures - 5 to 9 (%)
Housing units in structures - 10 to 19 (%)
Housing units in structures - 20 to 49 (%)
Housing units in structures - 50 or more (%)
Housing units in structures - Mobile home (%)
Housing units in structures - Boat, RV, van, etc. (%)
House/condo owner moved in on average (years ago)
Renter moved in on average (years ago)
Year householder moved into unit - Moved in 1999 to March 2000 (%)
Year householder moved into unit - Moved in 1995 to 1998 (%)
Year householder moved into unit - Moved in 1990 to 1994 (%)
Year householder moved into unit - Moved in 1980 to 1989 (%)
Year householder moved into unit - Moved in 1970 to 1979 (%)
Year householder moved into unit - Moved in 1969 or earlier (%)
Means of transportation to work - Drove car alone (%)
Means of transportation to work - Carpooled (%)
Means of transportation to work - Public transportation (%)
Means of transportation to work - Bus or trolley bus (%)
Means of transportation to work - Streetcar or trolley car (%)
Means of transportation to work - Subway or elevated (%)
Means of transportation to work - Railroad (%)
Means of transportation to work - Ferryboat (%)
Means of transportation to work - Taxicab (%)
Means of transportation to work - Motorcycle (%)
Means of transportation to work - Bicycle (%)
Means of transportation to work - Walked (%)
Means of transportation to work - Other means (%)
Working at home (%)
Industry diversity
Most Common Industries - Agriculture, forestry, fishing and hunting, and mining (%)
Most Common Industries - Agriculture, forestry, fishing and hunting (%)
Most Common Industries - Mining, quarrying, and oil and gas extraction (%)
Most Common Industries - Construction (%)
Most Common Industries - Manufacturing (%)
Most Common Industries - Wholesale trade (%)
Most Common Industries - Retail trade (%)
Most Common Industries - Transportation and warehousing, and utilities (%)
Most Common Industries - Transportation and warehousing (%)
Most Common Industries - Utilities (%)
Most Common Industries - Information (%)
Most Common Industries - Finance and insurance, and real estate and rental and leasing (%)
Most Common Industries - Finance and insurance (%)
Most Common Industries - Real estate and rental and leasing (%)
Most Common Industries - Professional, scientific, and management, and administrative and waste management services (%)
Most Common Industries - Professional, scientific, and technical services (%)
Most Common Industries - Management of companies and enterprises (%)
Most Common Industries - Administrative and support and waste management services (%)
Most Common Industries - Educational services, and health care and social assistance (%)
Most Common Industries - Educational services (%)
Most Common Industries - Health care and social assistance (%)
Most Common Industries - Arts, entertainment, and recreation, and accommodation and food services (%)
Most Common Industries - Arts, entertainment, and recreation (%)
Most Common Industries - Accommodation and food services (%)
Most Common Industries - Other services, except public administration (%)
Most Common Industries - Public administration (%)
Occupation diversity
Most Common Occupations - Management, business, science, and arts occupations (%)
Most Common Occupations - Management, business, and financial occupations (%)
Most Common Occupations - Management occupations (%)
Most Common Occupations - Business and financial operations occupations (%)
Most Common Occupations - Computer, engineering, and science occupations (%)
Most Common Occupations - Computer and mathematical occupations (%)
Most Common Occupations - Architecture and engineering occupations (%)
Most Common Occupations - Life, physical, and social science occupations (%)
Most Common Occupations - Education, legal, community service, arts, and media occupations (%)
Most Common Occupations - Community and social service occupations (%)
Most Common Occupations - Legal occupations (%)
Most Common Occupations - Education, training, and library occupations (%)
Most Common Occupations - Arts, design, entertainment, sports, and media occupations (%)
Most Common Occupations - Healthcare practitioners and technical occupations (%)
Most Common Occupations - Health diagnosing and treating practitioners and other technical occupations (%)
Most Common Occupations - Health technologists and technicians (%)
Most Common Occupations - Service occupations (%)
Most Common Occupations - Healthcare support occupations (%)
Most Common Occupations - Protective service occupations (%)
Most Common Occupations - Fire fighting and prevention, and other protective service workers including supervisors (%)
Most Common Occupations - Law enforcement workers including supervisors (%)
Most Common Occupations - Food preparation and serving related occupations (%)
Most Common Occupations - Building and grounds cleaning and maintenance occupations (%)
Most Common Occupations - Personal care and service occupations (%)
Most Common Occupations - Sales and office occupations (%)
Most Common Occupations - Sales and related occupations (%)
Most Common Occupations - Office and administrative support occupations (%)
Most Common Occupations - Natural resources, construction, and maintenance occupations (%)
Most Common Occupations - Farming, fishing, and forestry occupations (%)
Most Common Occupations - Construction and extraction occupations (%)
Most Common Occupations - Installation, maintenance, and repair occupations (%)
Most Common Occupations - Production, transportation, and material moving occupations (%)
Most Common Occupations - Production occupations (%)
Most Common Occupations - Transportation occupations (%)
Most Common Occupations - Material moving occupations (%)
People in Group quarters - Institutionalized population (%)
People in Group quarters - Correctional institutions (%)
People in Group quarters - Federal prisons and detention centers (%)
People in Group quarters - Halfway houses (%)
People in Group quarters - Local jails and other confinement facilities (including police lockups) (%)
People in Group quarters - Military disciplinary barracks (%)
People in Group quarters - State prisons (%)
People in Group quarters - Other types of correctional institutions (%)
People in Group quarters - Nursing homes (%)
People in Group quarters - Hospitals/wards, hospices, and schools for the handicapped (%)
People in Group quarters - Hospitals/wards and hospices for chronically ill (%)
People in Group quarters - Hospices or homes for chronically ill (%)
People in Group quarters - Military hospitals or wards for chronically ill (%)
People in Group quarters - Other hospitals or wards for chronically ill (%)
People in Group quarters - Hospitals or wards for drug/alcohol abuse (%)
People in Group quarters - Mental (Psychiatric) hospitals or wards (%)
People in Group quarters - Schools, hospitals, or wards for the mentally retarded (%)
People in Group quarters - Schools, hospitals, or wards for the physically handicapped (%)
People in Group quarters - Institutions for the deaf (%)
People in Group quarters - Institutions for the blind (%)
People in Group quarters - Orthopedic wards and institutions for the physically handicapped (%)
People in Group quarters - Wards in general hospitals for patients who have no usual home elsewhere (%)
People in Group quarters - Wards in military hospitals for patients who have no usual home elsewhere (%)
People in Group quarters - Juvenile institutions (%)
People in Group quarters - Long-term care (%)
People in Group quarters - Homes for abused, dependent, and neglected children (%)
People in Group quarters - Residential treatment centers for emotionally disturbed children (%)
People in Group quarters - Training schools for juvenile delinquents (%)
People in Group quarters - Short-term care, detention or diagnostic centers for delinquent children (%)
People in Group quarters - Type of juvenile institution unknown (%)
People in Group quarters - Noninstitutionalized population (%)
People in Group quarters - College dormitories (includes college quarters off campus) (%)
People in Group quarters - Military quarters (%)
People in Group quarters - On base (%)
People in Group quarters - Barracks, unaccompanied personnel housing (UPH), (Enlisted/Officer), ;and similar group living quarters for military personnel (%)
People in Group quarters - Transient quarters for temporary residents (%)
People in Group quarters - Military ships (%)
People in Group quarters - Group homes (%)
People in Group quarters - Homes or halfway houses for drug/alcohol abuse (%)
People in Group quarters - Homes for the mentally ill (%)
People in Group quarters - Homes for the mentally retarded (%)
People in Group quarters - Homes for the physically handicapped (%)
People in Group quarters - Other group homes (%)
People in Group quarters - Religious group quarters (%)
People in Group quarters - Dormitories (%)
People in Group quarters - Agriculture workers' dormitories on farms (%)
People in Group quarters - Job Corps and vocational training facilities (%)
People in Group quarters - Other workers' dormitories (%)
People in Group quarters - Crews of maritime vessels (%)
People in Group quarters - Other nonhousehold living situations (%)
People in Group quarters - Other noninstitutional group quarters (%)
Residents speaking English at home (%)
Residents speaking English at home - Born in the United States (%)
Residents speaking English at home - Native, born elsewhere (%)
Residents speaking English at home - Foreign born (%)
Residents speaking Spanish at home (%)
Residents speaking Spanish at home - Born in the United States (%)
Residents speaking Spanish at home - Native, born elsewhere (%)
Residents speaking Spanish at home - Foreign born (%)
Residents speaking other language at home (%)
Residents speaking other language at home - Born in the United States (%)
Residents speaking other language at home - Native, born elsewhere (%)
Residents speaking other language at home - Foreign born (%)
Class of Workers - Employee of private company (%)
Class of Workers - Self-employed in own incorporated business (%)
Class of Workers - Private not-for-profit wage and salary workers (%)
Class of Workers - Local government workers (%)
Class of Workers - State government workers (%)
Class of Workers - Federal government workers (%)
Class of Workers - Self-employed workers in own not incorporated business and Unpaid family workers (%)
House heating fuel used in houses and condos - Utility gas (%)
House heating fuel used in houses and condos - Bottled, tank, or LP gas (%)
House heating fuel used in houses and condos - Electricity (%)
House heating fuel used in houses and condos - Fuel oil, kerosene, etc. (%)
House heating fuel used in houses and condos - Coal or coke (%)
House heating fuel used in houses and condos - Wood (%)
House heating fuel used in houses and condos - Solar energy (%)
House heating fuel used in houses and condos - Other fuel (%)
House heating fuel used in houses and condos - No fuel used (%)
House heating fuel used in apartments - Utility gas (%)
House heating fuel used in apartments - Bottled, tank, or LP gas (%)
House heating fuel used in apartments - Electricity (%)
House heating fuel used in apartments - Fuel oil, kerosene, etc. (%)
House heating fuel used in apartments - Coal or coke (%)
House heating fuel used in apartments - Wood (%)
House heating fuel used in apartments - Solar energy (%)
House heating fuel used in apartments - Other fuel (%)
House heating fuel used in apartments - No fuel used (%)
Armed forces status - In Armed Forces (%)
Armed forces status - Civilian (%)
Armed forces status - Civilian - Veteran (%)
Armed forces status - Civilian - Nonveteran (%)
Fatal accidents locations in years 2005-2021
Fatal accidents locations in 2005
Fatal accidents locations in 2006
Fatal accidents locations in 2007
Fatal accidents locations in 2008
Fatal accidents locations in 2009
Fatal accidents locations in 2010
Fatal accidents locations in 2011
Fatal accidents locations in 2012
Fatal accidents locations in 2013
Fatal accidents locations in 2014
Fatal accidents locations in 2015
Fatal accidents locations in 2016
Fatal accidents locations in 2017
Fatal accidents locations in 2018
Fatal accidents locations in 2019
Fatal accidents locations in 2020
Fatal accidents locations in 2021
Alcohol use - People drinking some alcohol every month (%)
Alcohol use - People not drinking at all (%)
Alcohol use - Average days/month drinking alcohol
Alcohol use - Average drinks/week
Alcohol use - Average days/year people drink much
Audiometry - Average condition of hearing (%)
Audiometry - People that can hear a whisper from across a quiet room (%)
Audiometry - People that can hear normal voice from across a quiet room (%)
Audiometry - Ears ringing, roaring, buzzing (%)
Audiometry - Had a job exposure to loud noise (%)
Audiometry - Had off-work exposure to loud noise (%)
Blood Pressure & Cholesterol - Has high blood pressure (%)
Blood Pressure & Cholesterol - Checking blood pressure at home (%)
Blood Pressure & Cholesterol - Frequently checking blood cholesterol (%)
Blood Pressure & Cholesterol - Has high cholesterol level (%)
Consumer Behavior - Money monthly spent on food at supermarket/grocery store
Consumer Behavior - Money monthly spent on food at other stores
Consumer Behavior - Money monthly spent on eating out
Consumer Behavior - Money monthly spent on carryout/delivered foods
Consumer Behavior - Income spent on food at supermarket/grocery store (%)
Consumer Behavior - Income spent on food at other stores (%)
Consumer Behavior - Income spent on eating out (%)
Consumer Behavior - Income spent on carryout/delivered foods (%)
Current Health Status - General health condition (%)
Current Health Status - Blood donors (%)
Current Health Status - Has blood ever tested for HIV virus (%)
Current Health Status - Left-handed people (%)
Dermatology - People using sunscreen (%)
Diabetes - Diabetics (%)
Diabetes - Had a blood test for high blood sugar (%)
Diabetes - People taking insulin (%)
Diet Behavior & Nutrition - Diet health (%)
Diet Behavior & Nutrition - Milk product consumption (# of products/month)
Diet Behavior & Nutrition - Meals not home prepared (#/week)
Diet Behavior & Nutrition - Meals from fast food or pizza place (#/week)
Diet Behavior & Nutrition - Ready-to-eat foods (#/month)
Diet Behavior & Nutrition - Frozen meals/pizza (#/month)
Drug Use - People that ever used marijuana or hashish (%)
Drug Use - Ever used hard drugs (%)
Drug Use - Ever used any form of cocaine (%)
Drug Use - Ever used heroin (%)
Drug Use - Ever used methamphetamine (%)
Health Insurance - People covered by health insurance (%)
Kidney Conditions-Urology - Avg. # of times urinating at night
Medical Conditions - People with asthma (%)
Medical Conditions - People with anemia (%)
Medical Conditions - People with psoriasis (%)
Medical Conditions - People with overweight (%)
Medical Conditions - Elderly people having difficulties in thinking or remembering (%)
Medical Conditions - People who ever received blood transfusion (%)
Medical Conditions - People having trouble seeing even with glass/contacts (%)
Medical Conditions - People with arthritis (%)
Medical Conditions - People with gout (%)
Medical Conditions - People with congestive heart failure (%)
Medical Conditions - People with coronary heart disease (%)
Medical Conditions - People with angina pectoris (%)
Medical Conditions - People who ever had heart attack (%)
Medical Conditions - People who ever had stroke (%)
Medical Conditions - People with emphysema (%)
Medical Conditions - People with thyroid problem (%)
Medical Conditions - People with chronic bronchitis (%)
Medical Conditions - People with any liver condition (%)
Medical Conditions - People who ever had cancer or malignancy (%)
Mental Health - People who have little interest in doing things (%)
Mental Health - People feeling down, depressed, or hopeless (%)
Mental Health - People who have trouble sleeping or sleeping too much (%)
Mental Health - People feeling tired or having little energy (%)
Mental Health - People with poor appetite or overeating (%)
Mental Health - People feeling bad about themself (%)
Mental Health - People who have trouble concentrating on things (%)
Mental Health - People moving or speaking slowly or too fast (%)
Mental Health - People having thoughts they would be better off dead (%)
Oral Health - Average years since last visit a dentist
Oral Health - People embarrassed because of mouth (%)
Oral Health - People with gum disease (%)
Oral Health - General health of teeth and gums (%)
Oral Health - Average days a week using dental floss/device
Oral Health - Average days a week using mouthwash for dental problem
Oral Health - Average number of teeth
Pesticide Use - Households using pesticides to control insects (%)
Pesticide Use - Households using pesticides to kill weeds (%)
Physical Activity - People doing vigorous-intensity work activities (%)
Physical Activity - People doing moderate-intensity work activities (%)
Physical Activity - People walking or bicycling (%)
Physical Activity - People doing vigorous-intensity recreational activities (%)
Physical Activity - People doing moderate-intensity recreational activities (%)
Physical Activity - Average hours a day doing sedentary activities
Physical Activity - Average hours a day watching TV or videos
Physical Activity - Average hours a day using computer
Physical Functioning - People having limitations keeping them from working (%)
Physical Functioning - People limited in amount of work they can do (%)
Physical Functioning - People that need special equipment to walk (%)
Physical Functioning - People experiencing confusion/memory problems (%)
Physical Functioning - People requiring special healthcare equipment (%)
Prescription Medications - Average number of prescription medicines taking
Preventive Aspirin Use - Adults 40+ taking low-dose aspirin (%)
Reproductive Health - Vaginal deliveries (%)
Reproductive Health - Cesarean deliveries (%)
Reproductive Health - Deliveries resulted in a live birth (%)
Reproductive Health - Pregnancies resulted in a delivery (%)
Reproductive Health - Women breastfeeding newborns (%)
Reproductive Health - Women that had a hysterectomy (%)
Reproductive Health - Women that had both ovaries removed (%)
Reproductive Health - Women that have ever taken birth control pills (%)
Reproductive Health - Women taking birth control pills (%)
Reproductive Health - Women that have ever used Depo-Provera or injectables (%)
Reproductive Health - Women that have ever used female hormones (%)
Sexual Behavior - People 18+ that ever had sex (vaginal, anal, or oral) (%)
Sexual Behavior - Males 18+ that ever had vaginal sex with a woman (%)
Sexual Behavior - Males 18+ that ever performed oral sex on a woman (%)
Sexual Behavior - Males 18+ that ever had anal sex with a woman (%)
Sexual Behavior - Males 18+ that ever had any sex with a man (%)
Sexual Behavior - Females 18+ that ever had vaginal sex with a man (%)
Sexual Behavior - Females 18+ that ever performed oral sex on a man (%)
Sexual Behavior - Females 18+ that ever had anal sex with a man (%)
Sexual Behavior - Females 18+ that ever had any kind of sex with a woman (%)
Sexual Behavior - Average age people first had sex
Sexual Behavior - Average number of female sex partners in lifetime (males 18+)
Sexual Behavior - Average number of female vaginal sex partners in lifetime (males 18+)
Sexual Behavior - Average age people first performed oral sex on a woman (18+)
Sexual Behavior - Average number of woman performed oral sex on in lifetime (18+)
Sexual Behavior - Average number of male sex partners in lifetime (males 18+)
Sexual Behavior - Average number of male anal sex partners in lifetime (males 18+)
Sexual Behavior - Average age people first performed oral sex on a man (18+)
Sexual Behavior - Average number of male oral sex partners in lifetime (18+)
Sexual Behavior - People using protection when performing oral sex (%)
Sexual Behavior - Average number of times people have vaginal or anal sex a year
Sexual Behavior - People having sex without condom (%)
Sexual Behavior - Average number of male sex partners in lifetime (females 18+)
Sexual Behavior - Average number of male vaginal sex partners in lifetime (females 18+)
Sexual Behavior - Average number of female sex partners in lifetime (females 18+)
Sexual Behavior - Circumcised males 18+ (%)
Sleep Disorders - Average hours sleeping at night
Sleep Disorders - People that has trouble sleeping (%)
Smoking-Cigarette Use - People smoking cigarettes (%)
Taste & Smell - People 40+ having problems with smell (%)
Taste & Smell - People 40+ having problems with taste (%)
Taste & Smell - People 40+ that ever had wisdom teeth removed (%)
Taste & Smell - People 40+ that ever had tonsils teeth removed (%)
Taste & Smell - People 40+ that ever had a loss of consciousness because of a head injury (%)
Taste & Smell - People 40+ that ever had a broken nose or other serious injury to face or skull (%)
Taste & Smell - People 40+ that ever had two or more sinus infections (%)
Weight - Average height (inches)
Weight - Average weight (pounds)
Weight - Average BMI
Weight - People that are obese (%)
Weight - People that ever were obese (%)
Weight - People trying to lose weight (%)
Urban population: 16,874
Rural population: 3,579
Estimated median house/condo value in 2022: $397,308
28805:
$397,308North Carolina:
$280,600
Median resident age: This zip code:
46.5 yearsNorth Carolina median age:
39.2 years
Average household size: This zip code:
2.2 peopleNorth Carolina:
2.4 people
Averages for the 2020 tax year for zip code 28805, filed in 2021:
Average Adjusted Gross Income (AGI) in 2020: $68,346 (Individual Income Tax Returns) Here:
$68,346State:
$70,020
Salary/wage: $52,461 (reported on 73.8% of returns )Here:
$52,461State:
$58,387
(% of AGI for various income ranges: 1125.4% for AGIs below $25k , 3392.4% for AGIs $25k-50k , 6258.7% for AGIs $50k-75k , 9187.8% for AGIs $75k-100k , 17662.9% for AGIs $100k-200k , 59630.7% for AGIs over 200k ) Taxable interest for individuals: $1,690 (reported on 39.7% of returns )This zip code:
$1,690North Carolina:
$1,479
(% of AGI for various income ranges: 23.3% for AGIs below $25k , 36.1% for AGIs $25k-50k , 76.6% for AGIs $50k-75k , 131.6% for AGIs $75k-100k , 231.1% for AGIs $100k-200k , 1796.7% for AGIs over 200k ) Ordinary dividends: $8,391 (reported on 26.6% of returns )(% of AGI for various income ranges: 51.6% for AGIs below $25k , 92.4% for AGIs $25k-50k , 251.7% for AGIs $50k-75k , 464.2% for AGIs $75k-100k , 1113.0% for AGIs $100k-200k , 5360.0% for AGIs over 200k ) Net capital gain/loss in AGI: +$16,097 (reported on 24.7% of returns )Here:
+$16,097State:
+$23,652
(% of AGI for various income ranges: 10.3% for AGIs below $25k , 76.7% for AGIs $25k-50k , 178.8% for AGIs $50k-75k , 519.3% for AGIs $75k-100k , 1875.2% for AGIs $100k-200k , 14587.3% for AGIs over 200k ) Profit/loss from business: +$14,202 (reported on 19.8% of returns )Here:
+$14,202State:
+$11,710
(% of AGI for various income ranges: 183.0% for AGIs below $25k , 266.7% for AGIs $25k-50k , 379.4% for AGIs $50k-75k , 550.2% for AGIs $75k-100k , 1220.9% for AGIs $100k-200k , 3647.3% for AGIs over 200k ) Taxable individual retirement arrangement distribution: $19,998 (reported on 12.9% of returns )28805:
$19,998North Carolina:
$20,247
(% of AGI for various income ranges: 77.8% for AGIs below $25k , 148.8% for AGIs $25k-50k , 392.3% for AGIs $50k-75k , 696.9% for AGIs $75k-100k , 1406.2% for AGIs $100k-200k , 3978.7% for AGIs over 200k ) Self-employed (Keogh) retirement plans: $16,586 (reported on 0.7% of returns )28805:
$16,586North Carolina:
$26,749
(% of AGI for various income ranges: 109.1% for AGIs $100k-200k , 366.7% for AGIs over 200k ) Total itemized deductions: $31,080 (reported on 9.5% of returns )Here:
$31,080State:
$34,549
(% of AGI for various income ranges: 66.7% for AGIs below $25k , 147.8% for AGIs $25k-50k , 376.8% for AGIs $50k-75k , 596.0% for AGIs $75k-100k , 1405.2% for AGIs $100k-200k , 6787.3% for AGIs over 200k ) Charity contributions: $11,443 (reported on 7.6% of returns )Here:
$11,443State:
$13,360
(% of AGI for various income ranges: 4.9% for AGIs below $25k , 15.8% for AGIs $25k-50k , 62.1% for AGIs $50k-75k , 114.4% for AGIs $75k-100k , 364.5% for AGIs $100k-200k , 3186.0% for AGIs over 200k ) Taxes paid: $7,321 (reported on 9.1% of returns )(% of AGI for various income ranges: 8.3% for AGIs below $25k , 24.7% for AGIs $25k-50k , 92.3% for AGIs $50k-75k , 154.0% for AGIs $75k-100k , 386.4% for AGIs $100k-200k , 1365.3% for AGIs over 200k ) Earned income credit: $1,786 (reported on 13.2% of returns )(% of AGI for various income ranges: 67.3% for AGIs below $25k , 44.0% for AGIs $25k-50k ) Percentage of individuals using paid preparers for their 2020 taxes: 92.0%(% for various income ranges: 91.0% for AGIs below $25k , 92.5% for AGIs $25k-50k , 91.7% for AGIs $50k-75k , 90.2% for AGIs $75k-100k , 93.6% for AGIs $100k-200k , 95.6% for AGIs over 200k )
Averages for the 2012 tax year for zip code 28805, filed in 2013:
Average Adjusted Gross Income (AGI) in 2012: $50,406 (Individual Income Tax Returns) Here:
$50,406State:
$54,937
Salary/wage: $40,171 (reported on 77.6% of returns )Here:
$40,171State:
$46,336
(% of AGI for various income ranges: 71.3% for AGIs below $25k , 72.5% for AGIs $25k-50k , 67.5% for AGIs $50k-75k , 65.9% for AGIs $75k-100k , 59.3% for AGIs $100k-200k , 40.6% for AGIs over 200k ) Taxable interest for individuals: $1,316 (reported on 40.4% of returns )This zip code:
$1,316North Carolina:
$1,298
(% of AGI for various income ranges: 1.3% for AGIs below $25k , 1.2% for AGIs $25k-50k , 0.9% for AGIs $50k-75k , 1.2% for AGIs $75k-100k , 0.9% for AGIs $100k-200k , 1.0% for AGIs over 200k ) Ordinary dividends: $6,000 (reported on 24.6% of returns )(% of AGI for various income ranges: 2.5% for AGIs below $25k , 2.4% for AGIs $25k-50k , 2.7% for AGIs $50k-75k , 2.6% for AGIs $75k-100k , 3.5% for AGIs $100k-200k , 3.5% for AGIs over 200k ) Net capital gain/loss in AGI: +$17,953 (reported on 20.4% of returns )Here:
+$17,953State:
+$12,740
(% of AGI for various income ranges: 0.5% for AGIs $25k-50k , 1.3% for AGIs $50k-75k , 1.5% for AGIs $75k-100k , 3.6% for AGIs $100k-200k , 32.1% for AGIs over 200k ) Profit/loss from business: +$11,622 (reported on 18.3% of returns )Here:
+$11,622State:
+$10,311
(% of AGI for various income ranges: 8.7% for AGIs below $25k , 4.7% for AGIs $25k-50k , 3.2% for AGIs $50k-75k , 2.4% for AGIs $75k-100k , 4.9% for AGIs $100k-200k , 2.9% for AGIs over 200k ) Taxable individual retirement arrangement distribution: $14,109 (reported on 13.8% of returns )28805:
$14,109North Carolina:
$15,575
(% of AGI for various income ranges: 4.7% for AGIs below $25k , 3.3% for AGIs $25k-50k , 4.1% for AGIs $50k-75k , 3.9% for AGIs $75k-100k , 4.7% for AGIs $100k-200k , 2.8% for AGIs over 200k ) Self-employment retirement plans: $23,180 (reported on 0.6% of returns )28805:
$23,180North Carolina:
$21,078
Total itemized deductions: $21,306 (23% of AGI, reported on 33.4% of returns )Here:
$21,306State:
$23,438
Here:
22.8% of AGIState:
21.5% of AGI
(% of AGI for various income ranges: 12.0% for AGIs below $25k , 12.1% for AGIs $25k-50k , 14.9% for AGIs $50k-75k , 14.9% for AGIs $75k-100k , 16.5% for AGIs $100k-200k , 13.1% for AGIs over 200k ) Charity contributions: $4,402 (reported on 28.5% of returns )(% of AGI for various income ranges: 1.1% for AGIs below $25k , 1.6% for AGIs $25k-50k , 2.1% for AGIs $50k-75k , 2.3% for AGIs $75k-100k , 3.1% for AGIs $100k-200k , 3.9% for AGIs over 200k ) Taxes paid: $7,003 (reported on 33.3% of returns )(% of AGI for various income ranges: 1.9% for AGIs below $25k , 2.7% for AGIs $25k-50k , 4.6% for AGIs $50k-75k , 4.9% for AGIs $75k-100k , 6.4% for AGIs $100k-200k , 5.8% for AGIs over 200k ) Earned income credit: $1,775 (reported on 16.9% of returns )(% of AGI for various income ranges: 4.4% for AGIs below $25k , 0.7% for AGIs $25k-50k ) Percentage of individuals using paid preparers for their 2012 taxes: 47.8%(% for various income ranges: 42.9% for AGIs below $25k , 45.4% for AGIs $25k-50k , 53.4% for AGIs $50k-75k , 53.3% for AGIs $75k-100k , 58.9% for AGIs $100k-200k , 73.7% for AGIs over 200k )
Averages for the 2004 tax year for zip code 28805, filed in 2005:
Average Adjusted Gross Income (AGI) in 2004: $40,691 (Individual Income Tax Returns) Here:
$40,691State:
$45,376
Salary/wage: $35,210 (reported on 78.8% of returns )Here:
$35,210State:
$39,442
(% of AGI for various income ranges: 109.6% for AGIs below $10k , 71.9% for AGIs $10k-25k , 71.4% for AGIs $25k-50k , 73.2% for AGIs $50k-75k , 68.9% for AGIs $75k-100k , 58.1% for AGIs over 100k ) Taxable interest for individuals: $1,514 (reported on 49.4% of returns )This zip code:
$1,514North Carolina:
$1,515
(% of AGI for various income ranges: 9.0% for AGIs below $10k , 2.8% for AGIs $10k-25k , 2.1% for AGIs $25k-50k , 1.4% for AGIs $50k-75k , 1.7% for AGIs $75k-100k , 1.3% for AGIs over 100k ) Taxable dividends: $3,360 (reported on 28.7% of returns )(% of AGI for various income ranges: 7.4% for AGIs below $10k , 2.2% for AGIs $10k-25k , 2.1% for AGIs $25k-50k , 1.8% for AGIs $50k-75k , 2.5% for AGIs $75k-100k , 2.6% for AGIs over 100k ) Net capital gain/loss: +$7,658 (reported on 23.4% of returns )Here:
+$7,658State:
+$11,152
(% of AGI for various income ranges: -4.6% for AGIs below $10k , 0.0% for AGIs $10k-25k , 1.0% for AGIs $25k-50k , 1.8% for AGIs $50k-75k , 2.2% for AGIs $75k-100k , 12.0% for AGIs over 100k ) Profit/loss from business: +$9,746 (reported on 18.3% of returns )Here:
+$9,746State:
+$9,490
(% of AGI for various income ranges: 10.6% for AGIs below $10k , 6.8% for AGIs $10k-25k , 4.4% for AGIs $25k-50k , 3.1% for AGIs $50k-75k , 2.8% for AGIs $75k-100k , 4.8% for AGIs over 100k ) IRA payment deduction: $3,078 (reported on 3.6% of returns )28805:
$3,078North Carolina:
$2,967
(% of AGI for various income ranges: 0.3% for AGIs $10k-25k , 0.4% for AGIs $25k-50k , 0.3% for AGIs $50k-75k , 0.3% for AGIs $75k-100k , 0.1% for AGIs over 100k ) Self-employed pension: $10,217 (reported on 0.9% of returns )Here:
$10,217North Carolina:
$14,754
(% of AGI for various income ranges: 0.2% for AGIs $25k-50k , 0.1% for AGIs $50k-75k , 0.2% for AGIs $75k-100k , 0.5% for AGIs over 100k ) Total itemized deductions: $17,908 (25% of AGI, reported on 37.1% of returns )Here:
$17,908State:
$19,464
Here:
25.0% of AGIState:
22.7% of AGI
(% of AGI for various income ranges: 21.7% for AGIs below $10k , 12.9% for AGIs $10k-25k , 14.6% for AGIs $25k-50k , 17.3% for AGIs $50k-75k , 18.2% for AGIs $75k-100k , 17.0% for AGIs over 100k ) Charity contributions deductions: $3,703 (5% of AGI, reported on 32.7% of returns )Here:
5.0% of AGIState:
4.5% of AGI
(% of AGI for various income ranges: 1.6% for AGIs below $10k , 1.5% for AGIs $10k-25k , 2.3% for AGIs $25k-50k , 2.9% for AGIs $50k-75k , 3.3% for AGIs $75k-100k , 4.1% for AGIs over 100k ) Total tax: $5,450 (reported on 77.1% of returns )(% of AGI for various income ranges: 4.3% for AGIs below $10k , 4.6% for AGIs $10k-25k , 7.3% for AGIs $25k-50k , 9.1% for AGIs $50k-75k , 10.2% for AGIs $75k-100k , 15.9% for AGIs over 100k ) Earned income credit: $1,503 (reported on 13.7% of returns )Percentage of individuals using paid preparers for their 2004 taxes: 54.1%(% for various income ranges: 44.6% for AGIs below $10k , 55.0% for AGIs $10k-25k , 56.2% for AGIs $25k-50k , 57.0% for AGIs $50k-75k , 52.3% for AGIs $75k-100k , 66.8% for AGIs over 100k )
Estimated median household income in 2022: This zip code:
$62,605North Carolina:
$67,481
Nearest zip codes: 28778 ,
28801 ,
28804 ,
28803 ,
28787 ,
28806 .
Asheville Zip Code Map
Percentage of family households: This zip code:
32.8%North Carolina:
46.1%
Percentage of households with unmarried partners: This zip code:
7.5%North Carolina:
47.9%
Likely homosexual households (counted as self-reported same-sex unmarried-partner households)
Lesbian couples: 0.8% of all households Gay men: 0.0% of all households
Household received Food Stamps/SNAP in the past 12 months: 757Household did not receive Food Stamps/SNAP in the past 12 months: 8,245
Women who had a birth in the past 12 months: 167 (152 now married , 17 unmarried) Women who did not have a birth in the past 12 months: 3,734 (1,531 now married , 2,202 unmarried)
Housing units in zip code 28805 with a mortgage: 2,960 (290
second mortgage , 305
both second mortgage and home equity loan )
Houses without a mortgage: 89
Median monthly owner costs for units with a mortgage: $1,567
Median monthly owner costs for units without a mortgage: $428
Residents with income below the poverty level in 2022:
This zip code:
11.6%Whole state:
12.8%
Residents with income below 50% of the poverty level in 2022:
This zip code:
7.0%Whole state:
6.8%
Median number of rooms in houses and condos: Median number of rooms in apartments: Notable locations in this zip code not listed on our city pages
Click to draw/clear zip code borders Notable locations in zip code 28805: (A) , Biltmore Square (B) , Municipal Golf Course (C) . Display/hide their locations on the map
Shopping Centers: (1) , Eastvale Shopping Center (2) , Asheville Mall (3) . Display/hide their locations on the map
Churches in zip code 28805 include: (A) , Azalea Church (B) , Midway Church (C) , Berea Church (D) , Bethel Church (E) , Grace Church (F) , Carmel Monastery (G) , Bethesda Church (H) , Bethany Church (I) . Display/hide their locations on the map
Cemetery: (1) . Display/hide its location on the map
Reservoir: (A) . Display/hide its location on the map
Streams, rivers, and creeks: (A) , Bull Creek (B) , Shope Creek (C) , Keasler Branch (D) , Ross Creek (E) , Wolf Branch (F) . Display/hide their locations on the map
Park in zip code 28805: (1) . Display/hide its location on the map
Tourist attraction (not listed on the city page) : (1) . Display/hide its approximate location on the map
Year house built (houses)
175 2020 or later1,482 2010 to 20191,333 2000 to 20091,716 1990 to 19991,340 1980 to 1989929 1970 to 19791,353 1960 to 1969754 1950 to 1959580 1940 to 1949925 1939 or earlier
Zip code 28805 household income distribution in 2022 367 Less than $10,000503 $10,000 to $14,999849 $15,000 to $19,999168 $20,000 to $24,999453 $25,000 to $29,999484 $30,000 to $34,999299 $35,000 to $39,999186 $40,000 to $44,999349 $45,000 to $49,999620 $50,000 to $59,9991,063 $60,000 to $74,9991,140 $75,000 to $99,999645 $100,000 to $124,999448 $125,000 to $149,999757 $150,000 to $199,999664 $200,000 or moreEstimate of home value of owner-occupied houses/condos in 2022 in zip code 28805 32 Less than $10,0008 $10,000 to $14,9999 $20,000 to $24,99927 $25,000 to $29,99924 $30,000 to $34,99934 $40,000 to $49,99910 $50,000 to $59,99925 $60,000 to $69,999311 $70,000 to $79,99933 $80,000 to $89,99987 $90,000 to $99,999116 $100,000 to $124,999122 $125,000 to $149,999175 $150,000 to $174,99986 $175,000 to $199,999440 $200,000 to $249,999566 $250,000 to $299,9991,734 $300,000 to $399,9991,043 $400,000 to $499,9991,055 $500,000 to $749,999276 $750,000 to $999,99966 $1,000,000 to $1,499,99915 $1,500,000 to $1,999,99948 $2,000,000 or moreRent paid by renters in 2022 in zip code 28805 82 $100 to $14925 $150 to $19915 $200 to $24985 $250 to $29934 $300 to $34947 $350 to $39937 $400 to $44923 $450 to $4991 $500 to $5498 $550 to $599153 $600 to $64995 $650 to $69964 $700 to $749193 $750 to $799430 $800 to $899127 $900 to $999560 $1,000 to $1,249539 $1,250 to $1,499491 $1,500 to $1,999194 $2,000 to $2,49922 $2,500 to $2,9997 $3,000 to $3,4998 $3,500 or more93 No cash rent
Median gross rent in 2022: $1,189.
Median price asked for vacant for-sale houses and condos in 2022: $372,807.
Estimated median house (or condo) value in 2022 for: White Non-Hispanic householders: $425,105Black or African American householders: $392,900Asian householders: $381,374Some other race householders: $381,374Two or more races householders: $305,099Hispanic or Latino householders: $458,327Estimated median house or condo value in 2022: $397,308
28805:
$397,308North Carolina:
$280,600
Lower value quartile - upper value quartile: $246,454 - $526,095
Mean price in 2022: Detached houses: $502,479Here:
$502,479State:
$375,326
Townhouses or other attached units: $283,510Here:
$283,510State:
$317,935
In 2-unit structures: $1,033,059Here:
$1,033,059State:
$250,488
In 3-to-4-unit structures: $273,580Here:
$273,580State:
$254,939
In 5-or-more-unit structures: $660,444Here:
$660,444State:
$329,290
Mobile homes: $51,057Here:
$51,057State:
$124,933
Housing units in structures:
One, detached: 6,836One, attached: 463Two: 2243 or 4: 6335 to 9: 51410 to 19: 26220 to 49: 41450 or more: 517Mobile homes: 1,040Unemployment : 1.9%
Means of transportation to work in zip code 28805 65.4% 6,701 Drove a car alone10.5% 1,079 Carpooled0.8% 85 Bus or trolley bus0.1% 14 Taxi2.9% 294 Walked0.4% 37 Other means20.9% 2,141 Worked at homeTravel time to work (commute) in zip code 28805 108 Less than 5 minutes772 5 to 9 minutes1,763 10 to 14 minutes2,009 15 to 19 minutes1,969 20 to 24 minutes403 25 to 29 minutes702 30 to 34 minutes74 35 to 39 minutes172 40 to 44 minutes106 45 to 59 minutes95 60 to 89 minutes46 90 or more minutes
Neighborhoods in zip code 28805: Percentage of zip code residents living and working in this county: 96.8%
Household type by relationship:
Households: 20,454
Male householders: 4,036 (1,115 living alone ), Female householders: 5,018 (2,469 living alone )3,484 spouses (3,352 opposite-sex spouses ), 574 unmarried partners , (509 opposite-sex unmarried partners ), 4,415 children (3,951 natural , 60 adopted , 411 stepchildren ), 121 grandchildren , 247 brothers or sisters , 194 parents , 41 foster children , 838 other relatives , 1,231 non-relatives In group quarters: 189 (-1 institutionalized population )
Size of family households: 2,306 2-persons , 948 3-persons , 916 4-persons , 252 5-persons , 12 6-persons , 12 7-or-more-persons
Size of nonfamily households: 3,579 1-person , 981 2-persons , 14 3-persons , 6 4-persons , 10 5-persons
1,646 married couples with children. single-parent households (207 men , 711 women ).
92.3% of residents of 28805 zip code speak English at home. of residents speak Spanish at home (57% very well, 34% well, 8% not well, 1% not at all ).of residents speak other Indo-European language at home (67% very well, 31% well, 2% not well ).of residents speak Asian or Pacific Island language at home (100% very well ).of residents speak other language at home (26% very well, 74% well ).
Foreign born population: 1,548 (7.6%)
(61.1%
of them are naturalized citizens )
This zip code:
7.6%Whole state:
8.6%
14% Haiti 8% Sri Lanka 8% Sweden 7% France 6% Czechoslovakia (includes Czech Republic and Slovakia) 6% Honduras 6% Jordan 35% English 9% American 7% German 5% Irish 3% Russian 3% Italian 3% Scotch-Irish
Year of entry for the foreign-born population
927 2010 or later 173 2000 to 2009 201 1990 to 1999 584 Before 1990
There are
402 Other Medical Specialists in Zip Code 28805.
Facilities with environmental interests located in this zip code:
CHARLES C BELL ELEMENTARY (90 MAPLE SPRINGS RD in ASHEVILLE, NC)
STATE MASTER (North Carolina facility info) - UNDERGROUND STORAGE TANK PROGRAM (National Center for Education Statistics) - STATE ID-332 Business SIC classification: NONCLASSIFIABLE ESTABLISHMENTSOrganizations: BUNCOMBE COUNTY SCHOOLS (SCHOOL DISTRICT)
Alternative names: CHARLES C. BELL SCHOOL
CHARLES BINKELMAN (8 RIVERBEND DRIVE in ASHEVILLE, NC)
STATE MASTER (North Carolina facility info) - -115DA4YG00M69W84AY3VRAY6H7, WASTEWATER FACILITY National Pollutant Discharge Elimination System NON-MAJOR (Tracking pollutant discharge elimination systems) - permit Business SIC classification: SEWERAGE SYSTEMSAlternative names: BINKELMAN, CHARLES R. (RES.), BINKELMAN RESIDENCE
CNF INCORPORATED (56 TRUCKERS PLACE in ASHEVILLE, NC)
STATE MASTER (North Carolina facility info) - -115DA4YG00SAAD84AY3WR9UT47, WASTEWATER FACILITY, -0-004746, UNDERGROUND STORAGE TANK PROGRAM National Pollutant Discharge Elimination System NON-MAJOR (Tracking pollutant discharge elimination systems) - permit Business SIC classification: TRUCKING, EXCEPT LOCAL; NONCLASSIFIABLE ESTABLISHMENTSAlternative names: CNF INC CON WAY S EXPRESS NAV, CNF TRANSPORTATION, INC., CON WAY FREIGHT NAV
DOTSON METAL FINISHING, INCORPORATED (16 OLD CHARLOTTE HIGHWAY in ASHEVILLE, NC)
HAZARDOUS WASTE BIENNIAL REPORTER (Resource Conservation and Recovery Act (tracking hazardous waste)) (Resource Conservation and Recovery Act (tracking hazardous waste)) Organizations: DOTSON METAL FINISHING INC (CONTACT/OPERATOR)
, THOMAS LEE FINGER (CONTACT/OWNER)
CAROL`S CABINET CENTER CO (171 NEW HAW CREEK RD in ASHEVILLE, NC)
(Resource Conservation and Recovery Act (tracking hazardous waste)) Alternative names: CAROL'S CABINET CENTER CO
Housing units lacking complete plumbing facilities: 1.7%
Housing units lacking complete kitchen facilities: 4.4%
67.4% Electricity 19.4% Utility gas 5.7% Bottled, tank, or LP gas 5.1% Fuel oil, kerosene, etc. 2.2% Wood
Population in 1990: 15,335. Population change in the 1990s: +380 (+2.5%).
Place of birth for U.S.-born residents:
This state: 9,155Northeast: 2,682Midwest: 1,463South: 4,528West: 885
52% of the 28805 zip code residents lived in the same house 5 years ago.
Out of people who lived in different houses, 52% lived in this county.
Out of people who lived in different counties, 50% lived in North Carolina.
91% of the 28805 zip code residents lived in the same house 1 year ago.
Out of people who lived in different houses, 40% moved from this county.
Out of people who lived in different houses, 21% moved from different county within same state.
Out of people who lived in different houses, 40% moved from different state.
Out of people who lived in different houses, 2% moved from abroad.
Private vs. public school enrollment:
Students in private schools in grades 1 to 8 (elementary and middle school): 159
Here:
12.1%North Carolina:
13.8%
Students in private schools in grades 9 to 12 (high school): 88
Here:
10.5%North Carolina:
11.9%
Students in private undergraduate colleges: 56
Here:
5.7%North Carolina:
19.3%
Occupation by median earnings in the past 12 months ($)
100,672 Health diagnosing and treating practitioners and other technical occupations 100,584 Life, physical, and social science occupations 100,449 Legal occupations 66,367 Computer and mathematical occupations 60,834 Architecture and engineering occupations 59,334 Sales and related occupations
Companies with federal contracts located in this zip code:
NORTH CAROLINA OUTWARD BOUND S (2582 RICEVILLE ROAD in ASHEVILLE, NC) in 2 contracts from 2002 to 2004
$14,750 with Army for Other Education and Training Services. Taking place in KY. Signed on 2004-02-23. Completion date: 2004-03-04.
, same as above. Signed on 2002-10-25. Completion date: 2002-11-01.
Top industries in this zip code by the number of employees in 2005:
Accommodation and Food Services: Full-Service Restaurants (100-249 employees: 5 establishments, 50-99 employees: 7 establishments, 20-49 employees: 9 establishments, 10-19 employees: 6 establishments, 5-9 employees: 5 establishments, 1-4 employees: 7 establishments)Health Care and Social Assistance: General Medical and Surgical Hospitals (over 1000: 1)Accommodation and Food Services: Limited-Service Restaurants (50-99: 1, 20-49: 12, 10-19: 10, 5-9: 3, 1-4: 2)Accommodation and Food Services: Hotels (except Casino Hotels) and Motels (20-49: 4, 10-19: 5, 5-9: 5, 1-4: 5)Educational Services: Elementary and Secondary Schools (100-249: 1, 50-99: 1)
People in group quarters in 2010:
204 people in group homes intended for adults
171 people in nursing facilities/skilled-nursing facilities
5 people in workers' group living quarters and job corps centers
People in group quarters in 2000:
114 people in other noninstitutional group quarters
100 people in nursing homes
99 people in hospitals/wards and hospices for chronically ill
99 people in other hospitals or wards for chronically ill
12 people in other nonhousehold living situations
6 people in homes for the mentally retarded
5 people in homes or halfway houses for drug/alcohol abuse
Fatal accident statistics in 2014:
Fatal accident count: 1Vehicles involved in fatal accidents: 2Fatal accidents caused by drunken drivers: 0Fatalities: 1Persons involved in fatal accidents: 2Pedestrians involved in fatal accidents: 0
Fatal accident statistics in 2013:
Fatal accident count: 2Vehicles involved in fatal accidents: 5Fatal accidents caused by drunken drivers: 0Fatalities: 2Persons involved in fatal accidents: 6Pedestrians involved in fatal accidents: 1
Home Mortgage Disclosure Act Aggregated Statistics For Year 2009(Based on 2 full and 6 partial tracts) A) FHA, FSA/RHS & VA B) Conventional C) Refinancings D) Home Improvement Loans E) Loans on Dwellings For 5+ Families F) Non-occupant Loans on G) Loans On Manufactured Number Average Value Number Average Value Number Average Value Number Average Value Number Average Value Number Average Value Number Average Value
LOANS ORIGINATED 44 $163,780 216 $198,857 812 $183,570 29 $153,727 0 $0 109 $178,099 5 $86,756 APPLICATIONS APPROVED, NOT ACCEPTED 2 $189,990 17 $149,813 46 $196,772 3 $29,697 0 $0 6 $187,913 4 $21,608 APPLICATIONS DENIED 12 $159,997 26 $183,545 207 $172,929 13 $69,058 1 $816,500 39 $144,892 8 $96,462 APPLICATIONS WITHDRAWN 7 $163,094 38 $179,806 169 $193,964 1 $56,950 1 $29,820,000 25 $157,652 6 $116,435 FILES CLOSED FOR INCOMPLETENESS 6 $151,355 15 $196,929 40 $203,340 0 $0 0 $0 6 $164,793 0 $0
Aggregated Statistics For Year 2008(Based on 2 full and 6 partial tracts) A) FHA, FSA/RHS & VA B) Conventional C) Refinancings D) Home Improvement Loans E) Loans on Dwellings For 5+ Families F) Non-occupant Loans on G) Loans On Manufactured Number Average Value Number Average Value Number Average Value Number Average Value Number Average Value Number Average Value Number Average Value
LOANS ORIGINATED 41 $167,689 283 $206,842 547 $193,438 40 $99,710 6 $571,018 130 $189,427 12 $92,448 APPLICATIONS APPROVED, NOT ACCEPTED 2 $175,065 25 $164,288 80 $181,562 1 $85,430 0 $0 20 $172,540 0 $0 APPLICATIONS DENIED 8 $179,109 36 $160,661 221 $176,982 17 $124,752 1 $710,000 38 $149,288 8 $87,920 APPLICATIONS WITHDRAWN 6 $193,353 46 $176,838 93 $190,214 2 $165,500 0 $0 25 $153,094 1 $140,480 FILES CLOSED FOR INCOMPLETENESS 1 $107,260 15 $156,291 26 $209,727 0 $0 0 $0 6 $160,192 0 $0
Aggregated Statistics For Year 2007(Based on 2 full and 6 partial tracts) A) FHA, FSA/RHS & VA B) Conventional C) Refinancings D) Home Improvement Loans E) Loans on Dwellings For 5+ Families F) Non-occupant Loans on G) Loans On Manufactured Number Average Value Number Average Value Number Average Value Number Average Value Number Average Value Number Average Value Number Average Value
LOANS ORIGINATED 10 $166,550 437 $192,557 510 $177,649 52 $92,695 8 $3,753,764 201 $177,999 15 $66,104 APPLICATIONS APPROVED, NOT ACCEPTED 1 $84,480 46 $192,921 112 $159,366 10 $66,267 1 $289,170 19 $140,951 6 $56,608 APPLICATIONS DENIED 3 $206,530 73 $190,252 244 $186,387 42 $60,043 0 $0 33 $125,673 19 $56,336 APPLICATIONS WITHDRAWN 0 $0 42 $204,589 105 $154,300 14 $111,521 0 $0 7 $153,316 1 $76,890 FILES CLOSED FOR INCOMPLETENESS 0 $0 7 $184,747 51 $178,821 2 $32,825 0 $0 3 $121,720 0 $0
Aggregated Statistics For Year 2006(Based on 2 full and 6 partial tracts) A) FHA, FSA/RHS & VA B) Conventional C) Refinancings D) Home Improvement Loans E) Loans on Dwellings For 5+ Families F) Non-occupant Loans on G) Loans On Manufactured Number Average Value Number Average Value Number Average Value Number Average Value Number Average Value Number Average Value Number Average Value
LOANS ORIGINATED 18 $176,907 705 $167,579 559 $151,817 55 $42,390 2 $199,880 228 $176,403 30 $80,899 APPLICATIONS APPROVED, NOT ACCEPTED 1 $33,220 85 $163,057 94 $167,272 10 $22,081 0 $0 19 $205,476 22 $77,590 APPLICATIONS DENIED 6 $109,823 126 $137,247 230 $155,734 30 $67,180 0 $0 46 $179,042 50 $71,063 APPLICATIONS WITHDRAWN 2 $273,730 78 $188,384 128 $162,373 8 $44,099 0 $0 27 $232,978 2 $89,225 FILES CLOSED FOR INCOMPLETENESS 0 $0 10 $219,745 48 $138,979 7 $65,321 0 $0 3 $179,130 0 $0
Aggregated Statistics For Year 2005(Based on 2 full and 6 partial tracts) A) FHA, FSA/RHS & VA B) Conventional C) Refinancings D) Home Improvement Loans E) Loans on Dwellings For 5+ Families F) Non-occupant Loans on G) Loans On Manufactured Number Average Value Number Average Value Number Average Value Number Average Value Number Average Value Number Average Value Number Average Value
LOANS ORIGINATED 5 $115,352 614 $148,068 587 $148,194 57 $80,996 2 $9,051,770 191 $132,121 17 $67,186 APPLICATIONS APPROVED, NOT ACCEPTED 1 $164,210 86 $117,144 102 $110,175 7 $22,853 0 $0 17 $170,328 20 $43,206 APPLICATIONS DENIED 3 $70,757 138 $114,427 204 $135,933 38 $45,344 0 $0 30 $124,654 62 $68,233 APPLICATIONS WITHDRAWN 3 $63,907 95 $138,491 177 $135,569 15 $143,296 0 $0 17 $220,406 2 $116,750 FILES CLOSED FOR INCOMPLETENESS 0 $0 16 $93,411 35 $184,890 6 $53,845 0 $0 4 $191,360 0 $0
Aggregated Statistics For Year 2004(Based on 2 full and 6 partial tracts) A) FHA, FSA/RHS & VA B) Conventional C) Refinancings D) Home Improvement Loans E) Loans on Dwellings For 5+ Families F) Non-occupant Loans on G) Loans On Manufactured Number Average Value Number Average Value Number Average Value Number Average Value Number Average Value Number Average Value Number Average Value
LOANS ORIGINATED 6 $111,758 575 $150,313 604 $129,883 38 $74,827 5 $255,084 178 $119,703 24 $77,760 APPLICATIONS APPROVED, NOT ACCEPTED 1 $45,560 70 $129,323 83 $102,798 13 $86,294 0 $0 18 $140,609 21 $53,790 APPLICATIONS DENIED 4 $57,828 125 $106,711 229 $127,548 34 $56,974 0 $0 27 $99,450 51 $64,431 APPLICATIONS WITHDRAWN 1 $107,260 83 $155,745 161 $140,187 6 $64,570 0 $0 22 $111,677 5 $94,730 FILES CLOSED FOR INCOMPLETENESS 0 $0 5 $122,474 31 $152,979 3 $37,613 0 $0 4 $140,578 0 $0
Aggregated Statistics For Year 2003(Based on 2 full and 6 partial tracts) A) FHA, FSA/RHS & VA B) Conventional C) Refinancings D) Home Improvement Loans E) Loans on Dwellings For 5+ Families F) Non-occupant Loans on Number Average Value Number Average Value Number Average Value Number Average Value Number Average Value Number Average Value
LOANS ORIGINATED 5 $153,498 519 $131,350 1,443 $129,181 21 $33,650 4 $650,095 215 $115,129 APPLICATIONS APPROVED, NOT ACCEPTED 2 $188,000 44 $116,833 150 $125,770 2 $149,205 0 $0 10 $108,663 APPLICATIONS DENIED 1 $69,970 69 $98,633 261 $116,558 18 $47,789 0 $0 19 $121,279 APPLICATIONS WITHDRAWN 1 $170,400 58 $113,667 159 $122,913 2 $30,790 0 $0 24 $105,402 FILES CLOSED FOR INCOMPLETENESS 0 $0 7 $147,416 34 $162,388 1 $28,480 0 $0 1 $212,060
Aggregated Statistics For Year 2002(Based on 2 full and 6 partial tracts) A) FHA, FSA/RHS & VA B) Conventional C) Refinancings D) Home Improvement Loans E) Loans on Dwellings For 5+ Families F) Non-occupant Loans on Number Average Value Number Average Value Number Average Value Number Average Value Number Average Value Number Average Value
LOANS ORIGINATED 12 $117,727 480 $126,243 965 $124,912 30 $33,112 0 $0 172 $96,226 APPLICATIONS APPROVED, NOT ACCEPTED 0 $0 39 $68,993 125 $104,399 9 $43,624 0 $0 16 $70,718 APPLICATIONS DENIED 1 $149,100 91 $110,679 247 $102,626 23 $29,558 0 $0 11 $65,341 APPLICATIONS WITHDRAWN 6 $151,955 60 $130,896 119 $116,842 18 $47,153 2 $447,615 7 $77,361 FILES CLOSED FOR INCOMPLETENESS 0 $0 8 $128,536 21 $204,219 3 $6,737 0 $0 2 $116,765
Aggregated Statistics For Year 2001(Based on 2 full and 6 partial tracts) A) FHA, FSA/RHS & VA B) Conventional C) Refinancings D) Home Improvement Loans F) Non-occupant Loans on Number Average Value Number Average Value Number Average Value Number Average Value Number Average Value
LOANS ORIGINATED 13 $112,596 493 $116,139 708 $124,548 40 $44,497 106 $87,482 APPLICATIONS APPROVED, NOT ACCEPTED 2 $133,290 61 $94,562 68 $105,467 3 $8,903 6 $65,527 APPLICATIONS DENIED 6 $56,037 138 $59,919 159 $100,760 29 $22,770 19 $70,464 APPLICATIONS WITHDRAWN 1 $74,970 49 $124,762 102 $107,324 11 $47,372 7 $60,886 FILES CLOSED FOR INCOMPLETENESS 1 $72,140 15 $138,310 25 $94,799 0 $0 1 $9,490
Aggregated Statistics For Year 2000(Based on 2 full and 6 partial tracts) A) FHA, FSA/RHS & VA B) Conventional C) Refinancings D) Home Improvement Loans E) Loans on Dwellings For 5+ Families F) Non-occupant Loans on Number Average Value Number Average Value Number Average Value Number Average Value Number Average Value Number Average Value
LOANS ORIGINATED 27 $119,973 453 $103,314 230 $94,601 42 $63,975 4 $125,332 102 $86,346 APPLICATIONS APPROVED, NOT ACCEPTED 4 $37,645 68 $146,856 92 $94,668 22 $10,372 0 $0 11 $64,917 APPLICATIONS DENIED 12 $74,529 145 $51,636 137 $79,051 14 $27,442 0 $0 10 $44,961 APPLICATIONS WITHDRAWN 4 $129,545 44 $105,888 76 $77,211 2 $42,240 0 $0 7 $68,383 FILES CLOSED FOR INCOMPLETENESS 1 $57,900 7 $90,267 28 $115,333 0 $0 0 $0 0 $0
Aggregated Statistics For Year 1999(Based on 1 full and 3 partial tracts) A) FHA, FSA/RHS & VA B) Conventional C) Refinancings D) Home Improvement Loans E) Loans on Dwellings For 5+ Families F) Non-occupant Loans on Number Average Value Number Average Value Number Average Value Number Average Value Number Average Value Number Average Value
LOANS ORIGINATED 13 $110,047 271 $150,024 231 $96,179 18 $16,602 0 $0 48 $334,711 APPLICATIONS APPROVED, NOT ACCEPTED 0 $0 54 $69,163 63 $78,299 3 $5,190 1 $14,910 11 $44,373 APPLICATIONS DENIED 2 $53,965 114 $63,491 102 $88,155 6 $26,578 0 $0 12 $68,298 APPLICATIONS WITHDRAWN 1 $120,300 24 $98,409 53 $78,555 7 $55,689 0 $0 3 $62,173 FILES CLOSED FOR INCOMPLETENESS 0 $0 5 $80,586 12 $77,502 0 $0 0 $0 1 $36,790
Detailed HMDA statistics for the following Tracts:
0008.00
,
0018.00 ,
0019.00 ,
0030.01
Private Mortgage Insurance Companies Aggregated Statistics For Year 2009(Based on 2 full and 6 partial tracts) A) Conventional B) Refinancings C) Non-occupant Loans on Number Average Value Number Average Value Number Average Value
LOANS ORIGINATED 30 $201,319 6 $247,597 0 $0 APPLICATIONS APPROVED, NOT ACCEPTED 11 $288,496 14 $319,011 3 $528,830 APPLICATIONS DENIED 2 $115,385 1 $231,600 0 $0 APPLICATIONS WITHDRAWN 0 $0 1 $250,590 0 $0 FILES CLOSED FOR INCOMPLETENESS 0 $0 1 $231,340 0 $0
Aggregated Statistics For Year 2008(Based on 2 full and 6 partial tracts) A) Conventional B) Refinancings C) Non-occupant Loans on Number Average Value Number Average Value Number Average Value
LOANS ORIGINATED 45 $201,846 24 $199,766 8 $227,715 APPLICATIONS APPROVED, NOT ACCEPTED 24 $173,860 12 $228,813 3 $106,547 APPLICATIONS DENIED 6 $263,103 3 $197,683 4 $298,095 APPLICATIONS WITHDRAWN 1 $138,580 1 $109,160 0 $0 FILES CLOSED FOR INCOMPLETENESS 1 $717,600 0 $0 0 $0
Aggregated Statistics For Year 2007(Based on 2 full and 6 partial tracts) A) Conventional B) Refinancings C) Non-occupant Loans on D) Loans On Manufactured Number Average Value Number Average Value Number Average Value Number Average Value
LOANS ORIGINATED 65 $196,355 33 $193,441 8 $165,986 0 $0 APPLICATIONS APPROVED, NOT ACCEPTED 8 $277,170 2 $547,275 0 $0 0 $0 APPLICATIONS DENIED 0 $0 1 $89,220 0 $0 1 $89,220 APPLICATIONS WITHDRAWN 8 $136,769 5 $239,938 3 $141,053 0 $0 FILES CLOSED FOR INCOMPLETENESS 0 $0 0 $0 0 $0 0 $0
Aggregated Statistics For Year 2006(Based on 2 full and 6 partial tracts) A) Conventional B) Refinancings C) Non-occupant Loans on D) Loans On Manufactured Number Average Value Number Average Value Number Average Value Number Average Value
LOANS ORIGINATED 70 $192,956 17 $208,324 9 $183,093 2 $101,565 APPLICATIONS APPROVED, NOT ACCEPTED 9 $276,372 4 $209,128 0 $0 0 $0 APPLICATIONS DENIED 1 $47,460 0 $0 0 $0 1 $47,460 APPLICATIONS WITHDRAWN 4 $343,742 2 $123,715 0 $0 0 $0 FILES CLOSED FOR INCOMPLETENESS 1 $47,460 0 $0 0 $0 1 $47,460
Aggregated Statistics For Year 2005(Based on 2 full and 6 partial tracts) A) Conventional B) Refinancings C) Non-occupant Loans on Number Average Value Number Average Value Number Average Value
LOANS ORIGINATED 78 $156,418 27 $155,964 17 $138,595 APPLICATIONS APPROVED, NOT ACCEPTED 17 $209,851 6 $152,487 4 $103,640 APPLICATIONS DENIED 0 $0 1 $138,520 1 $138,520 APPLICATIONS WITHDRAWN 12 $172,188 4 $142,242 1 $99,960 FILES CLOSED FOR INCOMPLETENESS 0 $0 0 $0 0 $0
Aggregated Statistics For Year 2004(Based on 2 full and 6 partial tracts) A) Conventional B) Refinancings C) Non-occupant Loans on Number Average Value Number Average Value Number Average Value
LOANS ORIGINATED 81 $134,138 33 $154,049 10 $96,534 APPLICATIONS APPROVED, NOT ACCEPTED 15 $118,947 12 $164,222 5 $101,208 APPLICATIONS DENIED 1 $47,840 0 $0 0 $0 APPLICATIONS WITHDRAWN 4 $146,940 5 $118,386 0 $0 FILES CLOSED FOR INCOMPLETENESS 0 $0 0 $0 0 $0
Aggregated Statistics For Year 2003(Based on 2 full and 6 partial tracts) A) Conventional B) Refinancings C) Non-occupant Loans on Number Average Value Number Average Value Number Average Value
LOANS ORIGINATED 118 $133,619 110 $143,821 26 $110,482 APPLICATIONS APPROVED, NOT ACCEPTED 14 $101,605 21 $116,708 5 $91,812 APPLICATIONS DENIED 0 $0 2 $135,280 0 $0 APPLICATIONS WITHDRAWN 4 $211,168 2 $101,150 0 $0 FILES CLOSED FOR INCOMPLETENESS 2 $151,925 0 $0 1 $166,110
Aggregated Statistics For Year 2002(Based on 2 full and 6 partial tracts) A) Conventional B) Refinancings C) Non-occupant Loans on Number Average Value Number Average Value Number Average Value
LOANS ORIGINATED 126 $137,324 70 $134,599 15 $107,560 APPLICATIONS APPROVED, NOT ACCEPTED 14 $149,104 28 $127,475 2 $78,580 APPLICATIONS DENIED 3 $126,010 0 $0 0 $0 APPLICATIONS WITHDRAWN 5 $98,038 5 $113,688 2 $62,665 FILES CLOSED FOR INCOMPLETENESS 0 $0 1 $122,120 0 $0
Aggregated Statistics For Year 2001(Based on 2 full and 6 partial tracts) A) Conventional B) Refinancings C) Non-occupant Loans on Number Average Value Number Average Value Number Average Value
LOANS ORIGINATED 141 $118,170 56 $124,943 16 $102,062 APPLICATIONS APPROVED, NOT ACCEPTED 12 $182,308 13 $142,038 3 $75,167 APPLICATIONS DENIED 3 $139,813 2 $122,495 0 $0 APPLICATIONS WITHDRAWN 2 $99,665 0 $0 0 $0 FILES CLOSED FOR INCOMPLETENESS 1 $188,860 0 $0 0 $0
Aggregated Statistics For Year 2000(Based on 2 full and 6 partial tracts) A) Conventional B) Refinancings C) Non-occupant Loans on Number Average Value Number Average Value Number Average Value
LOANS ORIGINATED 102 $112,397 19 $124,223 10 $101,069 APPLICATIONS APPROVED, NOT ACCEPTED 11 $123,316 2 $113,505 0 $0 APPLICATIONS DENIED 3 $81,523 0 $0 0 $0 APPLICATIONS WITHDRAWN 1 $88,280 1 $104,410 0 $0 FILES CLOSED FOR INCOMPLETENESS 0 $0 0 $0 0 $0
Aggregated Statistics For Year 1999(Based on 1 full and 3 partial tracts) A) Conventional B) Refinancings C) Non-occupant Loans on Number Average Value Number Average Value Number Average Value
LOANS ORIGINATED 66 $120,178 8 $103,210 4 $119,180 APPLICATIONS APPROVED, NOT ACCEPTED 3 $145,073 3 $96,403 0 $0 APPLICATIONS DENIED 4 $83,480 4 $134,120 1 $41,760 APPLICATIONS WITHDRAWN 2 $104,085 1 $101,410 1 $67,610 FILES CLOSED FOR INCOMPLETENESS 0 $0 0 $0 0 $0
Detailed PMIC statistics for the following Tracts:
0008.00
,
0018.00 ,
0019.00 ,
0030.01
2002 - 2018 National Fire Incident Reporting System (NFIRS) incidents See full 2006 National Fire Incident Reporting System statistics for zip code 28805, North Carolina
Most common first names in zip code 28805 among deceased individuals Name Count Lived (average)
James 133 71.8 years William 133 74.8 years John 128 73.2 years Mary 118 80.1 years Robert 109 70.4 years Charles 75 73.5 years Margaret 65 81.7 years Helen 51 80.9 years Ruth 47 78.3 years Dorothy 46 77.6 years
Most common last names in zip code 28805 among deceased individuals Last name Count Lived (average)
Smith 51 77.0 years Brown 50 75.1 years Davis 45 78.5 years Jones 43 75.4 years Miller 38 75.5 years Johnson 36 74.5 years Williams 34 71.4 years Wilson 33 73.1 years Creasman 31 76.9 years Moore 24 70.2 years
Businesses in zip code 28805
Name Count Name Count
AMF Bowling 1 LensCrafters 1 AT&T 2 Lowe's 1 Abercrombie & Fitch 1 Marriott 2 Aeropostale 1 Maurices 1 American Eagle Outfitters 1 McDonald's 2 Applebee's 1 Men's Wearhouse 1 Arby's 1 Motel 6 1 Ashley Furniture 1 Motherhood Maternity 1 Banana Republic 1 New York & Co 1 Barnes & Noble 1 Nike 9 Bath & Body Works 1 Office Depot 1 Bed Bath & Beyond 1 OfficeMax 1 Best Western 1 Old Navy 1 Blockbuster 1 Olive Garden 1 Buffalo Wild Wings 1 Outback 1 Burger King 1 Outback Steakhouse 1 Casual Male XL 1 Pac Sun 1 Catherines 1 Panda Express 1 Charlotte Russe 1 Payless 1 Chick-Fil-A 2 PetSmart 1 Chuck E. Cheese's 1 Pier 1 Imports 1 Cold Stone Creamery 1 Pizza Hut 2 Cracker Barrel 1 Quality 1 Dairy Queen 2 RadioShack 1 Days Inn 2 Red Lobster 1 Domino's Pizza 1 Rite Aid 1 Eddie Bauer 1 Rue21 1 Extended Stay America 1 SONIC Drive-In 1 FedEx 5 Sears 2 Finish Line 1 Shoe Carnival 1 Firestone Complete Auto Care 1 Spencer Gifts 1 Foot Locker 1 Sprint Nextel 1 GNC 2 Starbucks 3 GameStop 2 Subaru 1 Gap 1 Subway 3 Gymboree 1 Super 8 1 H&R Block 2 T-Mobile 3 Havertys Furniture 1 T.J.Maxx 1 Hilton 2 Taco Bell 1 Holiday Inn 2 Target 1 Hollister Co. 1 U-Haul 2 Hot Topic 1 U.S. Cellular 2 Hyundai 1 UPS 4 IHOP 1 Vans 1 JCPenney 1 Verizon Wireless 1 Jones New York 3 Victoria's Secret 1 Journeys 1 Waffle House 2 Justice 1 Walgreens 1 Kmart 1 Walmart 1 Kohl's 1 Wet Seal 1 Lane Bryant 1
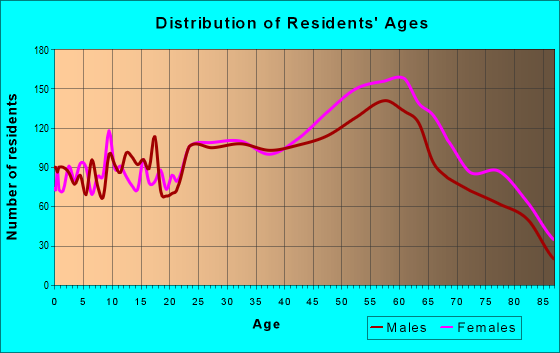
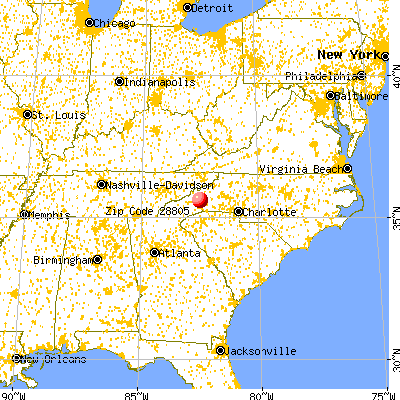


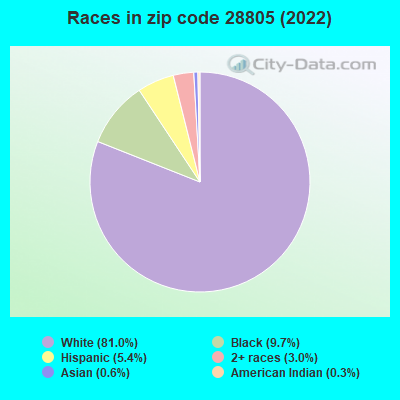


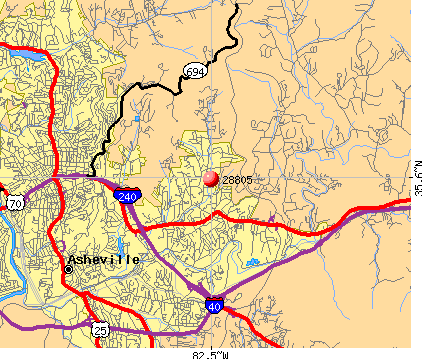 Nearest zip codes: 28778, 28801, 28804, 28803, 28787, 28806.
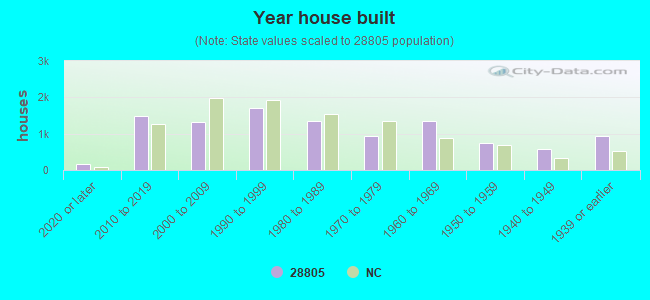
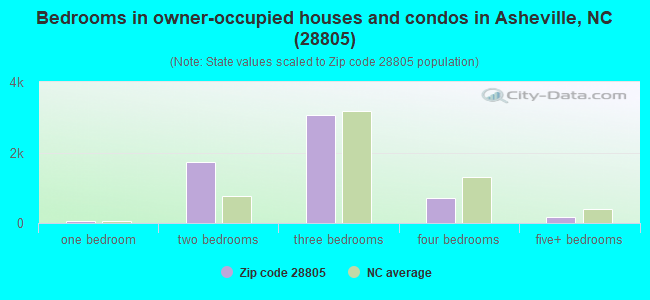
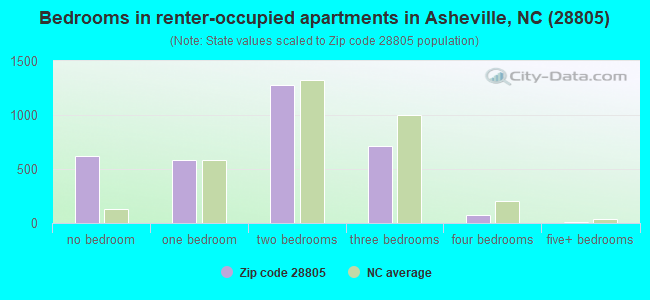


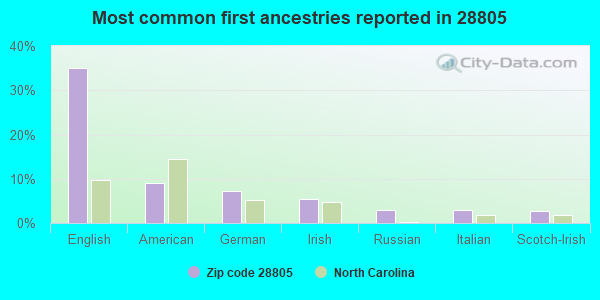
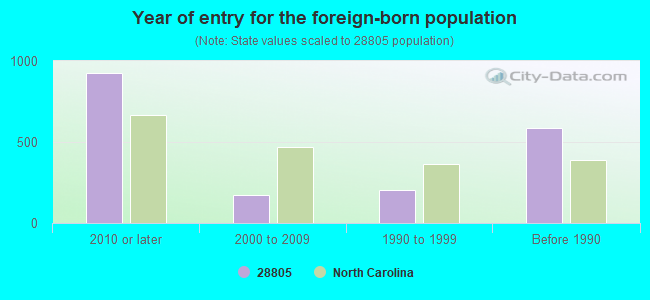
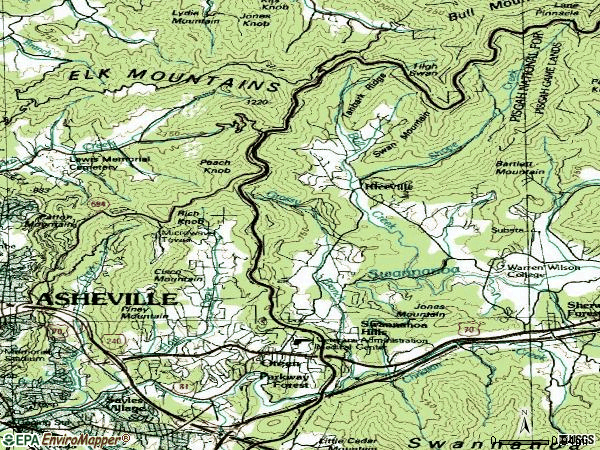

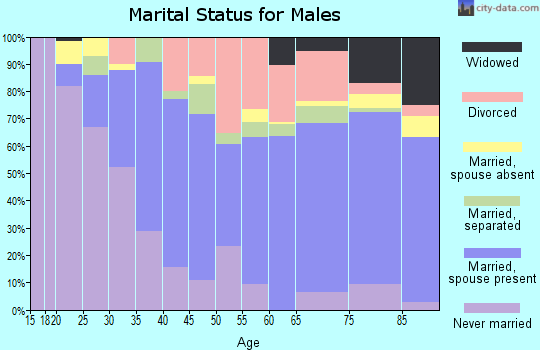
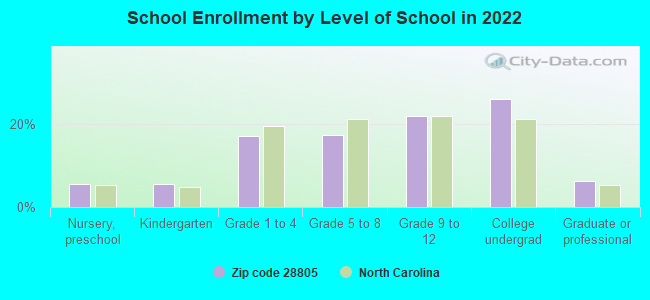
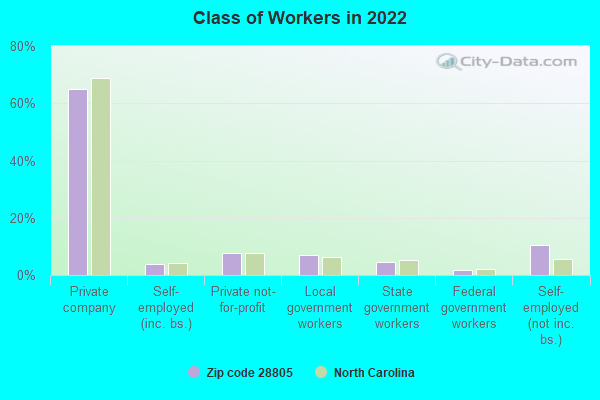
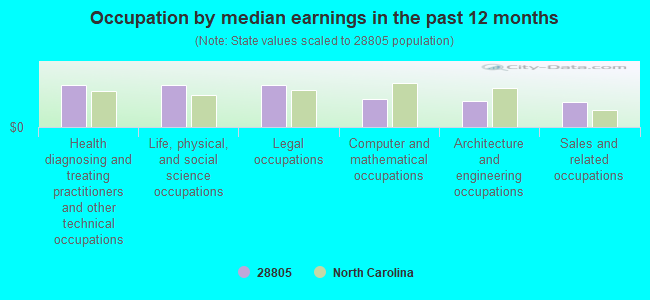
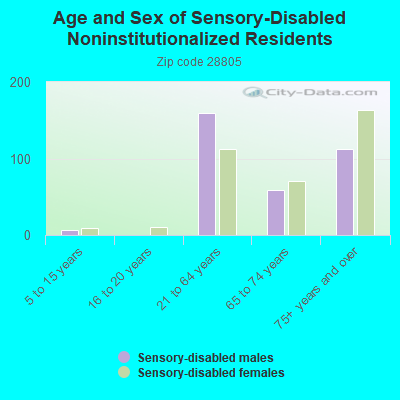
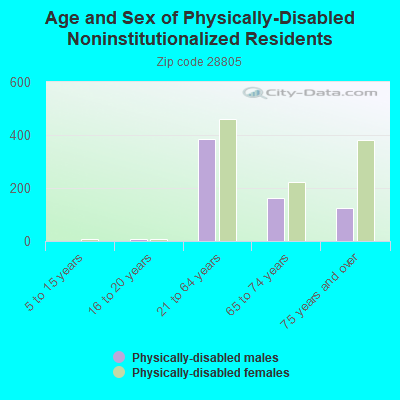
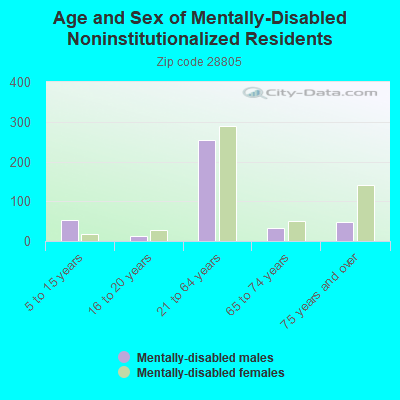
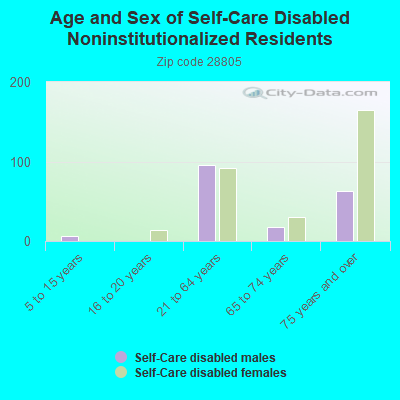
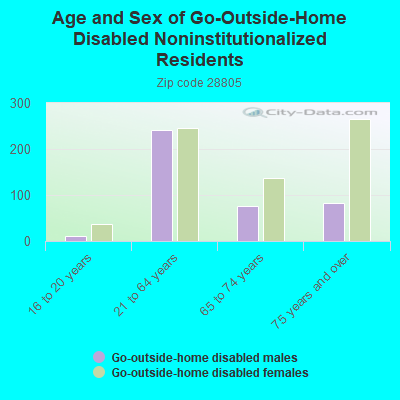
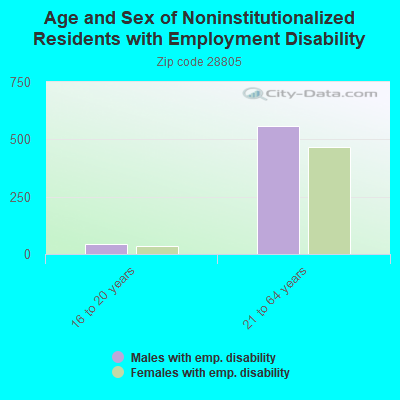
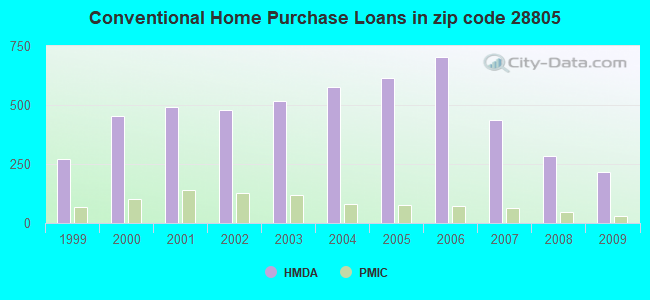
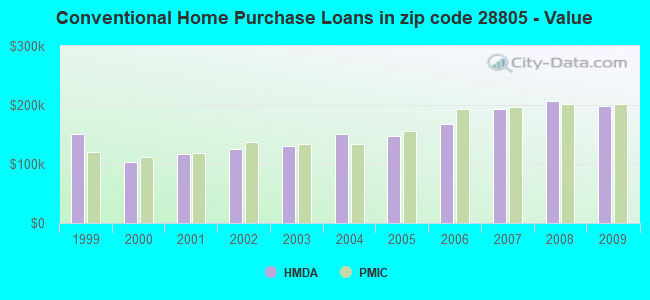
 According to the data from the years 2002 - 2018 the average number of fires per year is 63. The highest number of reported fire incidents - 93 took place in 2009, and the least - 12 in 2002. The data has an increasing trend.
 When looking into fire subcategories, the most reports belonged to: Structure Fires (47.5%), and Outside Fires (38.6%).