Estimated zip code population in 2022: 7,760 Zip code population in 2010: 7,816 Zip code population in 2000: 6,749
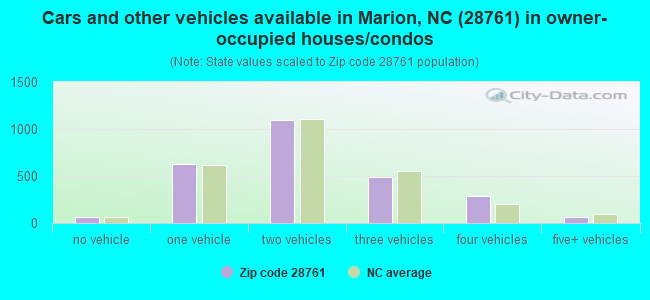
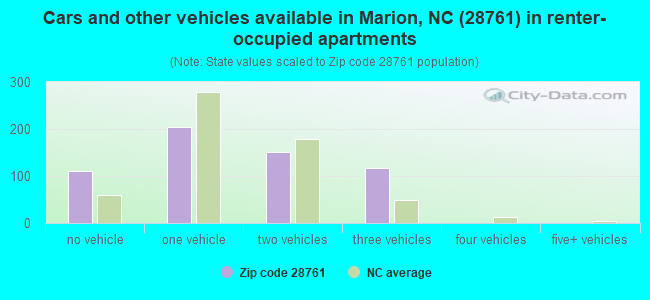
Houses and condos: 3,828 Renter-occupied apartments: 588
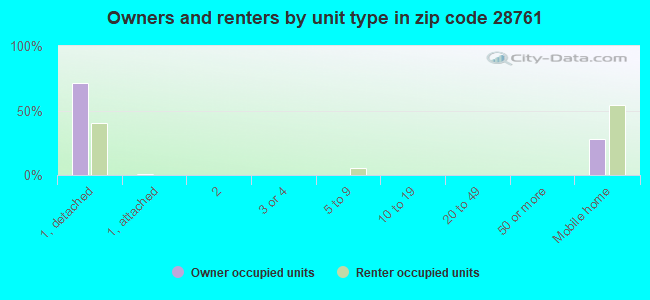
% of renters here:
18%
State:
33%
March 2022 cost of living index in zip code 28761: 79.7 (low, U.S. average is 100)
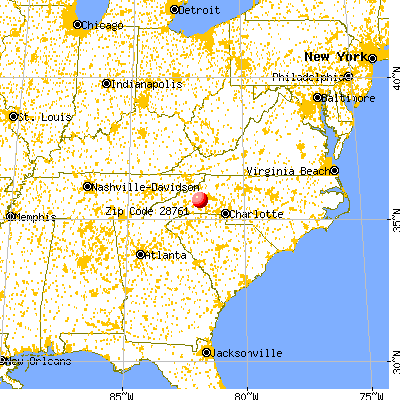
Land area: 108.2 sq. mi. Water area: 6.6 sq. mi.
Population density: 72 people per square mile
(very low).
OSM Map
General Map
Google Map
MSN Map
OSM Map
General Map
Google Map
MSN Map
OSM Map
General Map
Google Map
MSN Map
OSM Map
General Map
Google Map
MSN Map
Please wait while loading the map...
Real estate property taxes paid for housing units in 2022:
This zip code:
0.4% ($799)
North Carolina:
0.6% ($1,769)
Median real estate property taxes paid for housing units with mortgages in 2022: $908 (0.4%) Median real estate property taxes paid for housing units with no mortgage in 2022: $633 (0.4%)
Averages for the 2020 tax year for zip code 28761, filed in 2021:
Average Adjusted Gross Income (AGI) in 2020: $65,429 (Individual Income Tax Returns)
Here:
$65,429
State:
$70,020
Salary/wage: $51,831 (reported on 79.3% of returns)
Here:
$51,831
State:
$58,387
(% of AGI for various income ranges: 1063.3% for AGIs below $25k, 3623.8% for AGIs $25k-50k, 6534.1% for AGIs $50k-75k, 8612.3% for AGIs $75k-100k, 14669.1% for AGIs $100k-200k, 121446.7% for AGIs over 200k)
Taxable interest for individuals: $1,055 (reported on 31.7% of returns)
This zip code:
$1,055
North Carolina:
$1,479
(% of AGI for various income ranges: 13.1% for AGIs below $25k, 23.5% for AGIs $25k-50k, 23.0% for AGIs $50k-75k, 58.6% for AGIs $75k-100k, 106.1% for AGIs $100k-200k, 1573.3% for AGIs over 200k)
Ordinary dividends: $7,973 (reported on 13.7% of returns)
Here:
$7,973
State:
$7,888
(% of AGI for various income ranges: 22.7% for AGIs below $25k, 22.8% for AGIs $25k-50k, 101.4% for AGIs $50k-75k, 131.4% for AGIs $75k-100k, 317.0% for AGIs $100k-200k, 7583.3% for AGIs over 200k)
Net capital gain/loss in AGI: +$16,171 (reported on 13.7% of returns)
Here:
+$16,171
State:
+$23,652
(% of AGI for various income ranges: 11.3% for AGIs below $25k, 12.6% for AGIs $25k-50k, 83.8% for AGIs $50k-75k, 188.2% for AGIs $75k-100k, 463.5% for AGIs $100k-200k, 20830.0% for AGIs over 200k)
Profit/loss from business: +$11,143 (reported on 15.1% of returns)
Here:
+$11,143
State:
+$11,710
(% of AGI for various income ranges: 156.7% for AGIs below $25k, 58.3% for AGIs $25k-50k, 201.1% for AGIs $50k-75k, 187.7% for AGIs $75k-100k, 663.0% for AGIs $100k-200k, 5410.0% for AGIs over 200k)
Taxable individual retirement arrangement distribution: $26,326 (reported on 9.4% of returns)
28761:
$26,326
North Carolina:
$20,247
(% of AGI for various income ranges: 59.6% for AGIs below $25k, 80.9% for AGIs $25k-50k, 264.3% for AGIs $50k-75k, 481.8% for AGIs $75k-100k, 919.6% for AGIs $100k-200k, 12813.3% for AGIs over 200k)
Total itemized deductions: $38,362 (reported on 5.6% of returns)
Here:
$38,362
State:
$34,549
(% of AGI for various income ranges: 148.5% for AGIs $25k-50k, 308.6% for AGIs $75k-100k, 1311.3% for AGIs $100k-200k, 10476.7% for AGIs over 200k)
Charity contributions: $13,342 (reported on 5.1% of returns)
Here:
$13,342
State:
$13,360
(% of AGI for various income ranges: 22.0% for AGIs $25k-50k, 85.5% for AGIs $75k-100k, 321.7% for AGIs $100k-200k, 4756.7% for AGIs over 200k)
Taxes paid: $8,238 (reported on 5.6% of returns)
28761:
$8,238
State:
$7,586
(% of AGI for various income ranges: 21.1% for AGIs $25k-50k, 61.4% for AGIs $75k-100k, 309.1% for AGIs $100k-200k, 2370.0% for AGIs over 200k)
Earned income credit: $2,104 (reported on 19.6% of returns)
Here:
$2,104
State:
$2,337
(% of AGI for various income ranges: 92.5% for AGIs below $25k, 82.4% for AGIs $25k-50k)
Percentage of individuals using paid preparers for their 2020 taxes: 95.4%
Here:
95%
State:
93%
(% for various income ranges: 94.7% for AGIs below $25k, 96.0% for AGIs $25k-50k, 96.3% for AGIs $50k-75k, 96.9% for AGIs $75k-100k, 95.0% for AGIs $100k-200k, 93.3% for AGIs over 200k)
Averages for the 2012 tax year for zip code 28761, filed in 2013:
Average Adjusted Gross Income (AGI) in 2012: $43,479 (Individual Income Tax Returns)
Here:
$43,479
State:
$54,937
Salary/wage: $37,074 (reported on 83.0% of returns)
Here:
$37,074
State:
$46,336
(% of AGI for various income ranges: 71.2% for AGIs below $25k, 81.6% for AGIs $25k-50k, 77.2% for AGIs $50k-75k, 77.6% for AGIs $75k-100k, 63.2% for AGIs $100k-200k, 45.0% for AGIs over 200k)
Taxable interest for individuals: $714 (reported on 30.7% of returns)
This zip code:
$714
North Carolina:
$1,298
(% of AGI for various income ranges: 0.6% for AGIs below $25k, 0.5% for AGIs $25k-50k, 0.6% for AGIs $50k-75k, 0.3% for AGIs $75k-100k, 0.4% for AGIs $100k-200k, 0.6% for AGIs over 200k)
Ordinary dividends: $4,842 (reported on 10.8% of returns)
Here:
$4,842
State:
$6,213
(% of AGI for various income ranges: 0.7% for AGIs below $25k, 0.3% for AGIs $25k-50k, 0.7% for AGIs $50k-75k, 0.3% for AGIs $75k-100k, 1.8% for AGIs $100k-200k, 4.1% for AGIs over 200k)
Net capital gain/loss in AGI: +$4,424 (reported on 9.5% of returns)
Here:
+$4,424
State:
+$12,740
(% of AGI for various income ranges: 0.1% for AGIs $25k-50k, 0.7% for AGIs $50k-75k, 1.6% for AGIs $100k-200k, 4.4% for AGIs over 200k)
Profit/loss from business: +$9,007 (reported on 14.7% of returns)
Here:
+$9,007
State:
+$10,311
(% of AGI for various income ranges: 6.9% for AGIs below $25k, 2.6% for AGIs $25k-50k, 2.1% for AGIs $50k-75k, 1.3% for AGIs $75k-100k, 5.5% for AGIs $100k-200k)
Taxable individual retirement arrangement distribution: $16,717 (reported on 9.8% of returns)
28761:
$16,717
North Carolina:
$15,575
(% of AGI for various income ranges: 3.9% for AGIs below $25k, 1.8% for AGIs $25k-50k, 2.8% for AGIs $50k-75k, 4.5% for AGIs $75k-100k, 9.6% for AGIs $100k-200k)
Total itemized deductions: $21,542 (23% of AGI, reported on 21.6% of returns)
Here:
$21,542
State:
$23,438
Here:
22.9% of AGI
State:
21.5% of AGI
(% of AGI for various income ranges: 5.6% for AGIs below $25k, 6.8% for AGIs $25k-50k, 10.3% for AGIs $50k-75k, 13.0% for AGIs $75k-100k, 16.2% for AGIs $100k-200k, 13.5% for AGIs over 200k)
Charity contributions: $4,413 (reported on 17.0% of returns)
Here:
$4,413
State:
$4,687
(% of AGI for various income ranges: 0.5% for AGIs below $25k, 0.9% for AGIs $25k-50k, 1.6% for AGIs $50k-75k, 2.2% for AGIs $75k-100k, 3.3% for AGIs $100k-200k, 2.0% for AGIs over 200k)
Taxes paid: $6,855 (reported on 21.6% of returns)
28761:
$6,855
State:
$8,823
(% of AGI for various income ranges: 0.6% for AGIs below $25k, 1.3% for AGIs $25k-50k, 2.5% for AGIs $50k-75k, 4.2% for AGIs $75k-100k, 6.0% for AGIs $100k-200k, 6.8% for AGIs over 200k)
Earned income credit: $2,279 (reported on 25.5% of returns)
Here:
$2,279
State:
$2,376
(% of AGI for various income ranges: 7.6% for AGIs below $25k, 1.6% for AGIs $25k-50k)
Percentage of individuals using paid preparers for their 2012 taxes: 60.5%
Here:
60%
State:
53%
(% for various income ranges: 56.0% for AGIs below $25k, 60.7% for AGIs $25k-50k, 66.7% for AGIs $50k-75k, 65.0% for AGIs $75k-100k, 66.7% for AGIs $100k-200k, 80.0% for AGIs over 200k)
Averages for the 2004 tax year for zip code 28761, filed in 2005:
Average Adjusted Gross Income (AGI) in 2004: $34,192 (Individual Income Tax Returns)
Here:
$34,192
State:
$45,376
Salary/wage: $30,898 (reported on 88.5% of returns)
Here:
$30,898
State:
$39,442
(% of AGI for various income ranges: 134.7% for AGIs below $10k, 79.8% for AGIs $10k-25k, 86.8% for AGIs $25k-50k, 85.9% for AGIs $50k-75k, 79.1% for AGIs $75k-100k, 52.7% for AGIs over 100k)
Taxable interest for individuals: $778 (reported on 34.4% of returns)
This zip code:
$778
North Carolina:
$1,515
(% of AGI for various income ranges: 1.9% for AGIs below $10k, 0.7% for AGIs $10k-25k, 0.5% for AGIs $25k-50k, 0.6% for AGIs $50k-75k, 0.7% for AGIs $75k-100k, 1.5% for AGIs over 100k)
Taxable dividends: $1,592 (reported on 10.6% of returns)
Here:
$1,592
State:
$4,016
(% of AGI for various income ranges: 1.5% for AGIs below $10k, 0.4% for AGIs $10k-25k, 0.2% for AGIs $25k-50k, 0.2% for AGIs $50k-75k, 0.3% for AGIs $75k-100k, 1.6% for AGIs over 100k)
Net capital gain/loss: +$10,027 (reported on 7.8% of returns)
Here:
+$10,027
State:
+$11,152
(% of AGI for various income ranges: 0.9% for AGIs below $10k, 0.3% for AGIs $10k-25k, -0.2% for AGIs $25k-50k, 1.9% for AGIs $50k-75k, 0.9% for AGIs $75k-100k, 10.5% for AGIs over 100k)
Profit/loss from business: +$9,142 (reported on 15.1% of returns)
Here:
+$9,142
State:
+$9,490
(% of AGI for various income ranges: 15.9% for AGIs below $10k, 7.2% for AGIs $10k-25k, 2.0% for AGIs $25k-50k, 1.8% for AGIs $50k-75k, 0.1% for AGIs $75k-100k, 9.0% for AGIs over 100k)
IRA payment deduction: $2,490 (reported on 1.7% of returns)
28761:
$2,490
North Carolina:
$2,967
Total itemized deductions: $16,995 (25% of AGI, reported on 22.4% of returns)
Here:
$16,995
State:
$19,464
Here:
25.1% of AGI
State:
22.7% of AGI
(% of AGI for various income ranges: 7.4% for AGIs $10k-25k, 9.4% for AGIs $25k-50k, 12.0% for AGIs $50k-75k, 15.8% for AGIs $75k-100k, 14.6% for AGIs over 100k)
Charity contributions deductions: $3,627 (5% of AGI, reported on 19.1% of returns)
Here:
$3,627
State:
$4,035
Here:
5.1% of AGI
State:
4.5% of AGI
(% of AGI for various income ranges: 1.0% for AGIs $10k-25k, 1.2% for AGIs $25k-50k, 2.4% for AGIs $50k-75k, 3.5% for AGIs $75k-100k, 3.1% for AGIs over 100k)
Total tax: $4,047 (reported on 70.4% of returns)
28761:
$4,047
State:
$7,257
(% of AGI for various income ranges: 3.9% for AGIs below $10k, 3.5% for AGIs $10k-25k, 5.7% for AGIs $25k-50k, 8.1% for AGIs $50k-75k, 9.8% for AGIs $75k-100k, 17.7% for AGIs over 100k)
Earned income credit: $1,757 (reported on 25.5% of returns)
Here:
$1,757
State:
$1,851
Percentage of individuals using paid preparers for their 2004 taxes: 68.5%
Here:
68%
State:
62%
(% for various income ranges: 61.0% for AGIs below $10k, 72.4% for AGIs $10k-25k, 70.6% for AGIs $25k-50k, 63.3% for AGIs $50k-75k, 67.4% for AGIs $75k-100k, 75.3% for AGIs over 100k)
Household received Food Stamps/SNAP in the past 12 months: 581 Household did not receive Food Stamps/SNAP in the past 12 months: 2,650
Women who had a birth in the past 12 months: 104 (93 now married, 12 unmarried) Women who did not have a birth in the past 12 months: 1,370 (710 now married, 661 unmarried)
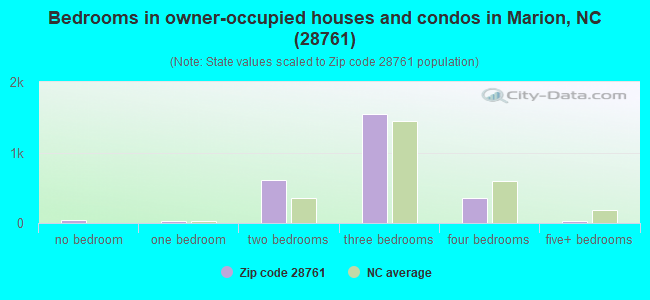
Housing units in zip code 28761 with a mortgage: 1,286 (96 second mortgage, 101 both second mortgage and home equity loan) Houses without a mortgage: 36
Median monthly owner costs for units with a mortgage: $1,029 Median monthly owner costs for units without a mortgage: $307
Residents with income below the poverty level in 2022:
This zip code:
12.2%
Whole state:
12.8%
Residents with income below 50% of the poverty level in 2022:
This zip code:
7.0%
Whole state:
6.8%
Median number of rooms in houses and condos:
Here:
5.8
State:
6.4
Median number of rooms in apartments:
Here:
5.0
State:
4.4
Notable locations in this zip code not listed on our city pages
Churches in zip code 28761 include: Laurel Hill Church (A), Macedonia Church (B), Harmony Grove Church (C), Dysartsville Church (D), Drusilla Church (E), Mount Moriah Church (F), Oak Grove Church (G), Rock Hill Church (H), Sunny Grove Church (I). Display/hide their locations on the map
Cemeteries: Brackettown Cemetery (1), Obeth Cemetery (2), Nebo Cemetery (3), Dixon Cemetery (4), Rocky Pass Cemetery (5). Display/hide their locations on the map
Reservoirs: Structure Number Fifteen Lake (A), Structure Number Six B Lake (B), Muddy Creek B S A Lake (C), Structure Number Nineteen Lake (D), Structure Number Eight Lake (E), Lake David (F). Display/hide their locations on the map
Streams, rivers, and creeks: Huckleberry Branch (A), Hoppers Creek (B), Hemphill Creek (C), Cove Branch (D), Ferguson Branch (E), Paddy Creek (F), Black Fork (G), Caleb Branch (H), Barnes Branch (I). Display/hide their locations on the map
In group quarters: 230 (-1 institutionalized population)
Size of family households: 1,215 2-persons, 339 3-persons, 459 4-persons, 130 5-persons, 35 6-persons, 22 7-or-more-persons
Size of nonfamily households: 708 1-person, 308 2-persons
1,004 married couples with children.
162 single-parent households (33 men, 129 women).
99.2% of residents of 28761 zip code speak English at home.
0.5% of residents speak Spanish at home (84% very well, 16% not at all).
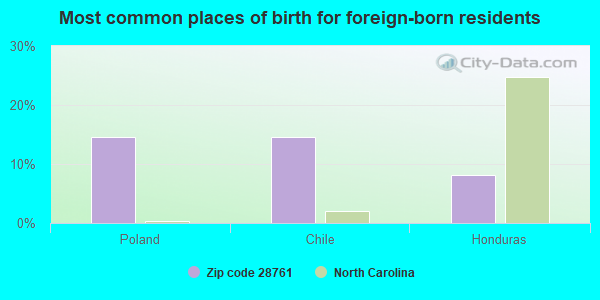
Foreign born population: 64 (0.8%) (90.5% of them are naturalized citizens)
This zip code:
0.8%
Whole state:
8.6%
15%Poland
15%Chile
8%Honduras
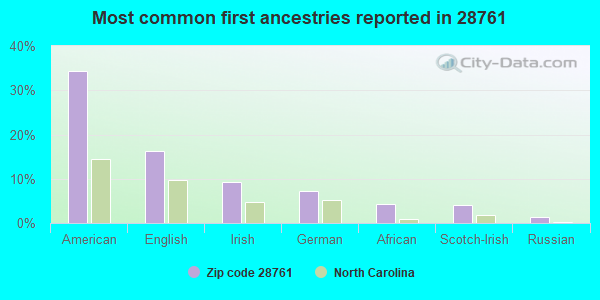
34%American
16%English
9%Irish
7%German
4%African
4%Scotch-Irish
1%Russian
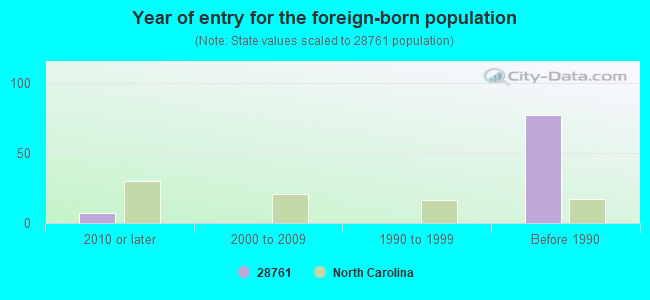
Year of entry for the foreign-born population
72010 or later
02000 to 2009
01990 to 1999
77Before 1990
Public elementary/middle school in in zip code 28761 not listed on the city page:
NEBO ELEMENTARY(Location: 254 NEBO SCHOOL ROAD, Grades: PK-5)
Facilities with environmental interests located in this zip code:
CEDARBROOK RESIDENTIAL CENTER (NCSR 1763 in NEBO, NC)
National Pollutant Discharge Elimination System NON-MAJOR (Tracking pollutant discharge elimination systems) - permit Business SIC classification: NURSING AND PERSONAL CARE FACILITIES Alternative names: MCDOWELL CO ADULT CARE LLC CED, PINNACLE REST HOME
Housing units lacking complete plumbing facilities: 4.0% Housing units lacking complete kitchen facilities: 3.1%
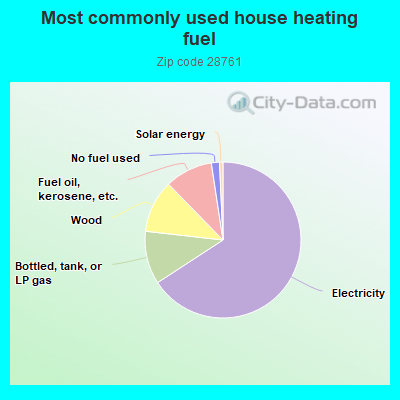
65.8%Electricity
11.0%Bottled, tank, or LP gas
10.9%Wood
9.9%Fuel oil, kerosene, etc.
1.7%No fuel used
0.7%Solar energy
Population in 1990: 5,018. Population change in the 1990s: +1,731 (+34.5%).
Place of birth for U.S.-born residents:
This state: 5,514
Northeast: 705
Midwest: 367
South: 822
West: 189
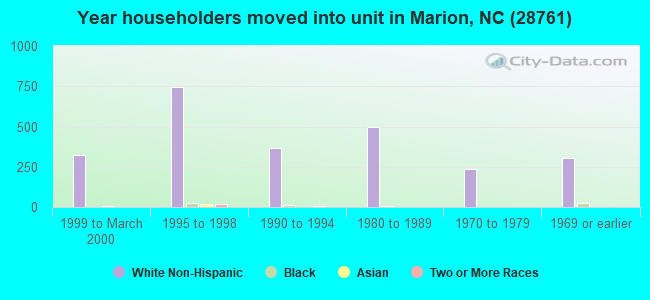
58% of the 28761 zip code residents lived in the same house 5 years ago. Out of people who lived in different houses, 68% lived in this county. Out of people who lived in different counties, 50% lived in North Carolina.
89% of the 28761 zip code residents lived in the same house 1 year ago. Out of people who lived in different houses, 32% moved from this county. Out of people who lived in different houses, 20% moved from different county within same state. Out of people who lived in different houses, 50% moved from different state. Out of people who lived in different houses, 1% moved from abroad.
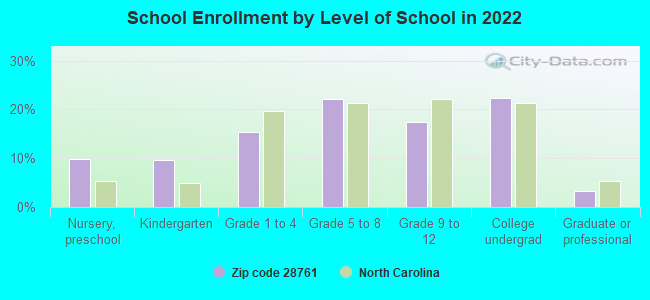
Private vs. public school enrollment:
Students in private schools in grades 1 to 8 (elementary and middle school): 100
Here:
21.2%
North Carolina:
13.8%
Students in private schools in grades 9 to 12 (high school): 29
Here:
13.6%
North Carolina:
11.9%
Students in private undergraduate colleges: 35
Here:
12.5%
North Carolina:
19.3%
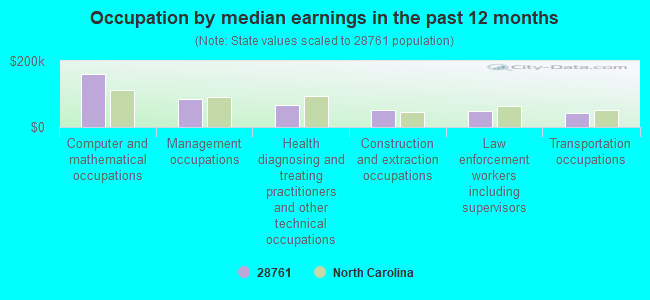
Occupation by median earnings in the past 12 months ($)
161,013Computer and mathematical occupations
84,925Management occupations
67,198Health diagnosing and treating practitioners and other technical occupations
52,855Construction and extraction occupations
48,828Law enforcement workers including supervisors
43,481Transportation occupations
Top industries in this zip code by the number of employees in 2005:
Health Care and Social Assistance: Nursing Care Facilities (100-249 employees: 2 establishments)
Construction: Poured Concrete Foundation and Structure Contractors (20-49: 1, 10-19: 1)
Construction: Structural Steel and Precast Concrete Contractors (20-49: 1)
Accommodation and Food Services: Full-Service Restaurants (10-19: 1)
Health Care and Social Assistance: Other Residential Care Facilities (10-19: 1)
Health Care and Social Assistance: Continuing Care Retirement Communities (10-19: 1)
Other Services (except Public Administration): Religious Organizations (5-9: 1, 1-4: 4)
People in group quarters in 2010:
126 people in group homes intended for adults
102 people in nursing facilities/skilled-nursing facilities
46 people in group homes for juveniles (non-correctional)
18 people in workers' group living quarters and job corps centers
People in group quarters in 2000:
162 people in nursing homes
58 people in other noninstitutional group quarters
Fatal accident statistics in 2013:
Fatal accident count: 1
Vehicles involved in fatal accidents: 1
Fatal accidents caused by drunken drivers: 1
Fatalities: 1
Persons involved in fatal accidents: 1
Pedestrians involved in fatal accidents: 0
Fatal accident statistics in 2011:
Fatal accident count: 1
Vehicles involved in fatal accidents: 1
Fatal accidents caused by drunken drivers: 0
Fatalities: 1
Persons involved in fatal accidents: 1
Pedestrians involved in fatal accidents: 0
Home Mortgage Disclosure Act Aggregated Statistics For Year 2009 (Based on 4 partial tracts)
A) FHA, FSA/RHS & VA Home Purchase Loans
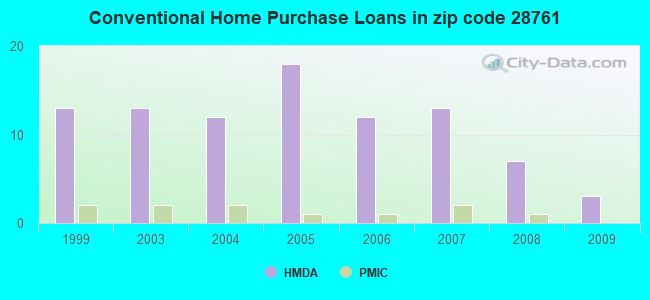
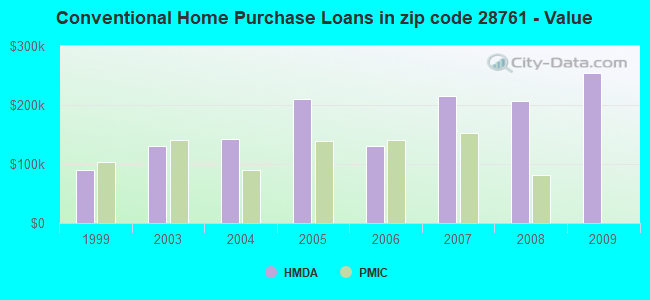
B) Conventional Home Purchase Loans
C) Refinancings
D) Home Improvement Loans
F) Non-occupant Loans on < 5 Family Dwellings (A B C & D)
G) Loans On Manufactured Home Dwelling (A B C & D)
Number
Average Value
Number
Average Value
Number
Average Value
Number
Average Value
Number
Average Value
Number
Average Value
LOANS ORIGINATED
2
$153,350
3
$253,660
25
$176,985
2
$109,920
6
$282,283
1
$107,580
APPLICATIONS APPROVED, NOT ACCEPTED
0
$0
1
$41,450
1
$182,900
0
$0
1
$51,720
1
$35,500
APPLICATIONS DENIED
1
$83,430
1
$123,980
8
$170,356
1
$28,470
1
$107,040
2
$54,420
APPLICATIONS WITHDRAWN
0
$0
0
$0
5
$175,912
0
$0
1
$111,720
0
$0
FILES CLOSED FOR INCOMPLETENESS
0
$0
0
$0
2
$238,495
0
$0
0
$0
0
$0
Aggregated Statistics For Year 2008 (Based on 4 partial tracts)
A) FHA, FSA/RHS & VA Home Purchase Loans
B) Conventional Home Purchase Loans
C) Refinancings
D) Home Improvement Loans
F) Non-occupant Loans on < 5 Family Dwellings (A B C & D)
G) Loans On Manufactured Home Dwelling (A B C & D)
Number
Average Value
Number
Average Value
Number
Average Value
Number
Average Value
Number
Average Value
Number
Average Value
LOANS ORIGINATED
2
$98,210
7
$206,870
15
$158,420
1
$59,110
7
$212,147
2
$56,585
APPLICATIONS APPROVED, NOT ACCEPTED
0
$0
0
$0
1
$90,460
0
$0
0
$0
0
$0
APPLICATIONS DENIED
1
$51,180
1
$320,220
10
$142,070
2
$36,940
1
$359,140
3
$85,957
APPLICATIONS WITHDRAWN
0
$0
1
$102,530
4
$150,782
0
$0
1
$123,080
1
$47,570
FILES CLOSED FOR INCOMPLETENESS
0
$0
0
$0
1
$283,450
0
$0
0
$0
0
$0
Aggregated Statistics For Year 2007 (Based on 4 partial tracts)
A) FHA, FSA/RHS & VA Home Purchase Loans
B) Conventional Home Purchase Loans
C) Refinancings
D) Home Improvement Loans
F) Non-occupant Loans on < 5 Family Dwellings (A B C & D)
G) Loans On Manufactured Home Dwelling (A B C & D)
Number
Average Value
Number
Average Value
Number
Average Value
Number
Average Value
Number
Average Value
Number
Average Value
LOANS ORIGINATED
2
$95,595
13
$214,508
22
$158,740
3
$69,917
6
$350,548
4
$70,412
APPLICATIONS APPROVED, NOT ACCEPTED
0
$0
1
$44,690
5
$96,876
1
$16,580
0
$0
0
$0
APPLICATIONS DENIED
0
$0
3
$186,627
14
$95,571
2
$57,575
0
$0
3
$63,070
APPLICATIONS WITHDRAWN
0
$0
1
$627,460
6
$157,285
1
$40,910
1
$276,970
1
$68,840
FILES CLOSED FOR INCOMPLETENESS
0
$0
1
$65,770
1
$113,350
0
$0
0
$0
0
$0
Aggregated Statistics For Year 2006 (Based on 4 partial tracts)
A) FHA, FSA/RHS & VA Home Purchase Loans
B) Conventional Home Purchase Loans
C) Refinancings
D) Home Improvement Loans
F) Non-occupant Loans on < 5 Family Dwellings (A B C & D)
G) Loans On Manufactured Home Dwelling (A B C & D)
Number
Average Value
Number
Average Value
Number
Average Value
Number
Average Value
Number
Average Value
Number
Average Value
LOANS ORIGINATED
1
$62,530
12
$129,969
19
$130,181
3
$34,660
7
$161,021
4
$61,268
APPLICATIONS APPROVED, NOT ACCEPTED
0
$0
2
$88,390
5
$112,372
0
$0
2
$110,370
2
$73,520
APPLICATIONS DENIED
0
$0
3
$121,213
14
$88,929
1
$45,950
1
$156,770
3
$72,320
APPLICATIONS WITHDRAWN
0
$0
1
$198,040
8
$106,746
0
$0
0
$0
1
$19,820
FILES CLOSED FOR INCOMPLETENESS
0
$0
0
$0
3
$114,247
0
$0
0
$0
0
$0
Aggregated Statistics For Year 2005 (Based on 4 partial tracts)
A) FHA, FSA/RHS & VA Home Purchase Loans
B) Conventional Home Purchase Loans
C) Refinancings
D) Home Improvement Loans
F) Non-occupant Loans on < 5 Family Dwellings (A B C & D)
G) Loans On Manufactured Home Dwelling (A B C & D)
Number
Average Value
Number
Average Value
Number
Average Value
Number
Average Value
Number
Average Value
Number
Average Value
LOANS ORIGINATED
1
$128,660
18
$210,914
19
$113,185
2
$70,730
8
$248,789
5
$53,232
APPLICATIONS APPROVED, NOT ACCEPTED
0
$0
2
$87,215
4
$96,768
1
$23,070
1
$45,230
1
$75,140
APPLICATIONS DENIED
0
$0
4
$57,755
18
$91,942
3
$41,567
1
$82,890
4
$54,420
APPLICATIONS WITHDRAWN
0
$0
7
$139,551
9
$103,534
1
$110,460
1
$266,340
1
$74,960
FILES CLOSED FOR INCOMPLETENESS
0
$0
1
$68,300
2
$143,710
0
$0
0
$0
0
$0
Aggregated Statistics For Year 2004 (Based on 4 partial tracts)
A) FHA, FSA/RHS & VA Home Purchase Loans
B) Conventional Home Purchase Loans
C) Refinancings
D) Home Improvement Loans
F) Non-occupant Loans on < 5 Family Dwellings (A B C & D)
G) Loans On Manufactured Home Dwelling (A B C & D)
Number
Average Value
Number
Average Value
Number
Average Value
Number
Average Value
Number
Average Value
Number
Average Value
LOANS ORIGINATED
1
$57,840
12
$143,124
20
$123,942
1
$64,510
5
$147,224
3
$64,450
APPLICATIONS APPROVED, NOT ACCEPTED
0
$0
3
$56,343
3
$102,533
0
$0
1
$34,060
2
$42,615
APPLICATIONS DENIED
0
$0
5
$107,832
12
$92,277
1
$18,740
1
$101,990
5
$70,098
APPLICATIONS WITHDRAWN
0
$0
1
$116,410
7
$115,380
0
$0
1
$91,540
1
$43,070
FILES CLOSED FOR INCOMPLETENESS
0
$0
0
$0
2
$110,645
0
$0
0
$0
0
$0
Aggregated Statistics For Year 2003 (Based on 4 partial tracts)
A) FHA, FSA/RHS & VA Home Purchase Loans
B) Conventional Home Purchase Loans
C) Refinancings
D) Home Improvement Loans
F) Non-occupant Loans on < 5 Family Dwellings (A B C & D)
Number
Average Value
Number
Average Value
Number
Average Value
Number
Average Value
Number
Average Value
LOANS ORIGINATED
1
$36,400
13
$129,730
43
$126,362
1
$14,780
7
$166,067
APPLICATIONS APPROVED, NOT ACCEPTED
0
$0
4
$75,730
7
$114,839
1
$19,280
1
$80,190
APPLICATIONS DENIED
0
$0
7
$60,624
12
$104,246
1
$21,080
1
$98,570
APPLICATIONS WITHDRAWN
0
$0
1
$94,240
5
$89,920
0
$0
1
$38,560
FILES CLOSED FOR INCOMPLETENESS
0
$0
0
$0
2
$99,470
0
$0
0
$0
Aggregated Statistics For Year 1999 (Based on 2 partial tracts)
A) FHA, FSA/RHS & VA Home Purchase Loans
B) Conventional Home Purchase Loans
C) Refinancings
D) Home Improvement Loans
F) Non-occupant Loans on < 5 Family Dwellings (A B C & D)
Detailed PMIC statistics for the following Tracts:0202.01
2003 - 2018 National Fire Incident Reporting System (NFIRS) incidents
According to the data from the years 2003 - 2018 the average number of fires per year is 42. The highest number of reported fire incidents - 116 took place in 2016, and the least - 0 in 2008. The data has a growing trend.
When looking into fire subcategories, the most incidents belonged to: Structure Fires (57.4%), and Outside Fires (28.8%).
Fire incident types reported to NFIRS in Zip Code 28761


 Nearest zip codes: 28752, 28628, 28655, 28167, 28018, 28749.


 (Location: 254 NEBO SCHOOL ROAD, Grades: PK-5)

 According to the data from the years 2003 - 2018 the average number of fires per year is 42. The highest number of reported fire incidents - 116 took place in 2016, and the least - 0 in 2008. The data has a growing trend.
 When looking into fire subcategories, the most incidents belonged to: Structure Fires (57.4%), and Outside Fires (28.8%).