Estimated median house/condo value in 2022: $219,917
28543:
$219,917
North Carolina:
$280,600
Median resident age:
This zip code:
21.8 years
North Carolina median age:
39.2 years
Average household size:
This zip code:
2.8 people
North Carolina:
2.4 people
Averages for the 2020 tax year for zip code 28543, filed in 2021:
Average Adjusted Gross Income (AGI) in 2020: $39,353 (Individual Income Tax Returns)
Here:
$39,353
State:
$70,020
Salary/wage: $38,203 (reported on 98.7% of returns)
Here:
$38,203
State:
$58,387
(% of AGI for various income ranges: 1717.1% for AGIs below $25k, 3533.7% for AGIs $25k-50k, 6113.2% for AGIs $50k-75k, 9201.4% for AGIs $75k-100k, 16180.0% for AGIs $100k-200k)
Taxable interest for individuals: $194 (reported on 11.5% of returns)
This zip code:
$194
North Carolina:
$1,479
(% of AGI for various income ranges: 1.0% for AGIs $25k-50k, 6.8% for AGIs $50k-75k, 17.1% for AGIs $75k-100k)
Ordinary dividends: $250 (reported on 5.1% of returns)
Here:
$250
State:
$7,888
(% of AGI for various income ranges: 1.5% for AGIs $25k-50k, 3.6% for AGIs $50k-75k)
Net capital gain/loss in AGI: +$1,092 (reported on 7.7% of returns)
Here:
+$1,092
State:
+$23,652
(% of AGI for various income ranges: 5.3% for AGIs $25k-50k, 40.9% for AGIs $50k-75k)
Profit/loss from business: +$980 (reported on 6.4% of returns)
Here:
+$980
State:
+$11,710
(% of AGI for various income ranges: 12.9% for AGIs below $25k, 6.3% for AGIs $25k-50k)
Earned income credit: $2,626 (reported on 26.9% of returns)
Here:
$2,626
State:
$2,337
(% of AGI for various income ranges: 68.2% for AGIs below $25k, 108.2% for AGIs $25k-50k)
Percentage of individuals using paid preparers for their 2020 taxes: 98.1%
Here:
98%
State:
93%
(% for various income ranges: 95.0% for AGIs below $25k, 98.8% for AGIs $25k-50k, 100.0% for AGIs $50k-75k, 100.0% for AGIs $75k-100k, 100.0% for AGIs $100k-200k)
Averages for the 2012 tax year for zip code 28543, filed in 2013:
Average Adjusted Gross Income (AGI) in 2012: $27,660 (Individual Income Tax Returns)
Here:
$27,660
State:
$54,937
Salary/wage: $27,536 (reported on 100.0% of returns)
Here:
$27,536
State:
$46,336
(% of AGI for various income ranges: 100.6% for AGIs below $25k, 100.0% for AGIs $25k-50k, 100.1% for AGIs $50k-75k, 91.0% for AGIs $75k-100k)
Taxable interest for individuals: $71 (reported on 11.3% of returns)
This zip code:
$71
North Carolina:
$1,298
(% of AGI for various income ranges: )
Ordinary dividends: $133 (reported on 2.0% of returns)
Here:
$133
State:
$6,213
Profit/loss from business: +$367 (reported on 2.0% of returns)
Here:
+$367
State:
+$10,311
(% of AGI for various income ranges: )
Taxes paid: $3,750 (reported on 1.3% of returns)
28543:
$3,750
State:
$8,823
Earned income credit: $3,035 (reported on 49.7% of returns)
Here:
$3,035
State:
$2,376
(% of AGI for various income ranges: 10.9% for AGIs below $25k, 4.2% for AGIs $25k-50k)
Percentage of individuals using paid preparers for their 2012 taxes: 39.1%
Here:
39%
State:
53%
(% for various income ranges: 40.7% for AGIs below $25k, 36.8% for AGIs $25k-50k, 50.0% for AGIs $50k-75k)
Averages for the 2004 tax year for zip code 28543, filed in 2005:
Average Adjusted Gross Income (AGI) in 2004: $19,942 (Individual Income Tax Returns)
Here:
$19,942
State:
$45,376
Salary/wage: $19,673 (reported on 99.5% of returns)
Here:
$19,673
State:
$39,442
(% of AGI for various income ranges: 99.7% for AGIs below $10k, 99.7% for AGIs $10k-25k, 98.2% for AGIs $25k-50k, 80.0% for AGIs $50k-75k)
Taxable interest for individuals: $92 (reported on 8.4% of returns)
This zip code:
$92
North Carolina:
$1,515
Profit/loss from business: +$182 (reported on 2.8% of returns)
Here:
+$182
State:
+$9,490
IRA payment deduction: $800 (reported on 0.9% of returns)
28543:
$800
North Carolina:
$2,967
Total tax: $1,061 (reported on 25.2% of returns)
28543:
$1,061
State:
$7,257
(% of AGI for various income ranges: 0.4% for AGIs below $10k, 0.8% for AGIs $10k-25k, 1.5% for AGIs $25k-50k, 7.2% for AGIs $50k-75k)
Earned income credit: $2,396 (reported on 64.7% of returns)
Here:
$2,396
State:
$1,851
Percentage of individuals using paid preparers for their 2004 taxes: 78.2%
Here:
78%
State:
62%
(% for various income ranges: 78.0% for AGIs below $10k, 78.2% for AGIs $10k-25k, 78.1% for AGIs $25k-50k, 83.3% for AGIs $50k-75k)
Household received Food Stamps/SNAP in the past 12 months: 73 Household did not receive Food Stamps/SNAP in the past 12 months: 1,859
Women who had a birth in the past 12 months: 397 (390 now married, 16 unmarried) Women who did not have a birth in the past 12 months: 1,287 (1,098 now married, 199 unmarried)
Residents with income below the poverty level in 2022:
This zip code:
12.3%
Whole state:
12.8%
Residents with income below 50% of the poverty level in 2022:
This zip code:
9.2%
Whole state:
6.8%
Median number of rooms in houses and condos:
Here:
5.4
State:
6.4
Median number of rooms in apartments:
Here:
5.6
State:
4.4
Notable locations in this zip code not listed on our city pages
In group quarters: 1,522 (-1 institutionalized population)
Size of family households: 753 2-persons, 555 3-persons, 298 4-persons, 200 5-persons, 40 6-persons, 7 7-or-more-persons
Size of nonfamily households: 95 1-person
1,367 married couples with children.
208 single-parent households (78 men, 130 women).
91.6% of residents of 28543 zip code speak English at home.
5.4% of residents speak Spanish at home (84% very well, 16% well).
1.7% of residents speak other Indo-European language at home (87% very well, 13% well).
0.2% of residents speak Asian or Pacific Island language at home (100% very well).
0.1% of residents speak other language at home (100% very well).
Foreign born population: 187 (2.7%) (48.7% of them are naturalized citizens)
This zip code:
2.7%
Whole state:
8.6%
28%Sweden
12%Dominica
11%Chile
8%Serbia
8%Colombia
7%Honduras
6%Thailand
13%English
9%German
9%Irish
8%American
5%Italian
3%French
2%Haitian
Year of entry for the foreign-born population
1582010 or later
582000 to 2009
451990 to 1999
28Before 1990
Public elementary/middle schools in in zip code 28543 not listed on the city page:
TARAWA TERRACE I PRIMARY SCHOOL (Location: 60 TERAWA BLVD, Grades: PK-1)
Housing units lacking complete plumbing facilities: 0.5%
81.1%Electricity
14.5%Utility gas
4.0%Solar energy
Population in 1990: 11,054.
Place of birth for U.S.-born residents:
This state: 791
Northeast: 1,520
Midwest: 1,304
South: 2,220
West: 1,015
5% of the 28543 zip code residents lived in the same house 5 years ago. Out of people who lived in different houses, 11% lived in this county. Out of people who lived in different counties, 50% lived in North Carolina.
35% of the 28543 zip code residents lived in the same house 1 year ago. Out of people who lived in different houses, 19% moved from this county. Out of people who lived in different houses, 44% moved from different county within same state. Out of people who lived in different houses, 29% moved from different state. Out of people who lived in different houses, 5% moved from abroad.
Private vs. public school enrollment:
Students in private schools in grades 1 to 8 (elementary and middle school): 44
Here:
7.2%
North Carolina:
13.8%
Students in private schools in grades 9 to 12 (high school): 10
Here:
20.5%
North Carolina:
11.9%
Students in private undergraduate colleges: 120
Here:
16.0%
North Carolina:
19.3%
Occupation by median earnings in the past 12 months ($)
27,547Building and grounds cleaning and maintenance occupations
23,456Office and administrative support occupations
23,004Personal care and service occupations
19,370Sales and related occupations
14,747Food preparation and serving related occupations
14,581Management occupations
Companies with federal contracts located in this zip code:
CHARTER COMMUNICATIONS HOLDING (BLDG 2475 in TARAWA TERRACE, NC) : $889,210 in 27 contractsfrom 2000 to 2005
Contracts for Other Utilities, Lease or Rental of Equipment -- Communication, Detection, and Coherent Radiation Equipment by Navy Signed by year:2000: $184,000; 2001: $92,000; 2002: $26,181; 2003: $312,356; 2004: $305,000; 2005: -$30,327; 2006: $0.
Biggest contracts:
$112,600 with Navy for Other Utilities. Signed on 2003-10-01. Completion date: 2004-09-30.
$105,980, same as above.Signed on 2003-10-01. Completion date: 2004-09-30.
$100,000, same as above.Signed on 2004-10-06. Completion date: 2005-09-30.
$92,000, same as above.Signed on 2001-10-01. Completion date: 2002-09-30.
Top industries in this zip code by the number of employees in 2005:
Information: Cable and Other Program Distribution (1-4 employees: 1 establishment)
Fatal accident statistics in 2014:
Fatal accident count: 1
Vehicles involved in fatal accidents: 3
Fatal accidents caused by drunken drivers: 0
Fatalities: 1
Persons involved in fatal accidents: 4
Pedestrians involved in fatal accidents: 0
Home Mortgage Disclosure Act Aggregated Statistics For Year 2009 (Based on 2 partial tracts)
A) FHA, FSA/RHS & VA Home Purchase Loans
B) Conventional Home Purchase Loans
D) Home Improvement Loans
G) Loans On Manufactured Home Dwelling (A B C & D)
Number
Average Value
Number
Average Value
Number
Average Value
Number
Average Value
LOANS ORIGINATED
0
$0
0
$0
0
$0
0
$0
APPLICATIONS APPROVED, NOT ACCEPTED
0
$0
0
$0
0
$0
0
$0
APPLICATIONS DENIED
1
$37,550
1
$20,120
1
$7,380
1
$20,120
APPLICATIONS WITHDRAWN
0
$0
0
$0
0
$0
0
$0
FILES CLOSED FOR INCOMPLETENESS
0
$0
0
$0
0
$0
0
$0
Aggregated Statistics For Year 2008 (Based on 2 partial tracts)
A) FHA, FSA/RHS & VA Home Purchase Loans
B) Conventional Home Purchase Loans
C) Refinancings
D) Home Improvement Loans
G) Loans On Manufactured Home Dwelling (A B C & D)
Number
Average Value
Number
Average Value
Number
Average Value
Number
Average Value
Number
Average Value
LOANS ORIGINATED
0
$0
0
$0
0
$0
0
$0
0
$0
APPLICATIONS APPROVED, NOT ACCEPTED
0
$0
0
$0
0
$0
0
$0
0
$0
APPLICATIONS DENIED
0
$0
1
$26,820
1
$50,290
1
$5,360
1
$26,820
APPLICATIONS WITHDRAWN
1
$95,900
0
$0
0
$0
1
$2,680
0
$0
FILES CLOSED FOR INCOMPLETENESS
0
$0
0
$0
1
$50,290
0
$0
0
$0
Aggregated Statistics For Year 2007 (Based on 2 partial tracts)
C) Refinancings
Number
Average Value
LOANS ORIGINATED
0
$0
APPLICATIONS APPROVED, NOT ACCEPTED
0
$0
APPLICATIONS DENIED
1
$42,250
APPLICATIONS WITHDRAWN
0
$0
FILES CLOSED FOR INCOMPLETENESS
0
$0
Aggregated Statistics For Year 2006 (Based on 2 partial tracts)
A) FHA, FSA/RHS & VA Home Purchase Loans
B) Conventional Home Purchase Loans
C) Refinancings
D) Home Improvement Loans
F) Non-occupant Loans on < 5 Family Dwellings (A B C & D)
G) Loans On Manufactured Home Dwelling (A B C & D)
Number
Average Value
Number
Average Value
Number
Average Value
Number
Average Value
Number
Average Value
Number
Average Value
LOANS ORIGINATED
1
$98,580
0
$0
0
$0
0
$0
0
$0
0
$0
APPLICATIONS APPROVED, NOT ACCEPTED
0
$0
0
$0
1
$124,060
0
$0
1
$124,060
0
$0
APPLICATIONS DENIED
0
$0
2
$82,485
1
$250,130
2
$10,730
1
$4,020
1
$4,020
APPLICATIONS WITHDRAWN
0
$0
0
$0
0
$0
0
$0
0
$0
0
$0
FILES CLOSED FOR INCOMPLETENESS
0
$0
0
$0
0
$0
0
$0
0
$0
0
$0
Aggregated Statistics For Year 2005 (Based on 2 partial tracts)
A) FHA, FSA/RHS & VA Home Purchase Loans
B) Conventional Home Purchase Loans
C) Refinancings
F) Non-occupant Loans on < 5 Family Dwellings (A B C & D)
G) Loans On Manufactured Home Dwelling (A B C & D)
Number
Average Value
Number
Average Value
Number
Average Value
Number
Average Value
Number
Average Value
LOANS ORIGINATED
1
$55,660
1
$25,480
0
$0
0
$0
1
$25,480
APPLICATIONS APPROVED, NOT ACCEPTED
0
$0
1
$447,960
1
$84,500
0
$0
1
$59,010
APPLICATIONS DENIED
0
$0
3
$86,507
1
$42,920
0
$0
1
$61,700
APPLICATIONS WITHDRAWN
0
$0
1
$75,110
1
$30,180
1
$75,110
0
$0
FILES CLOSED FOR INCOMPLETENESS
0
$0
0
$0
0
$0
0
$0
0
$0
Aggregated Statistics For Year 2004 (Based on 2 partial tracts)
A) FHA, FSA/RHS & VA Home Purchase Loans
B) Conventional Home Purchase Loans
C) Refinancings
D) Home Improvement Loans
F) Non-occupant Loans on < 5 Family Dwellings (A B C & D)
G) Loans On Manufactured Home Dwelling (A B C & D)
Number
Average Value
Number
Average Value
Number
Average Value
Number
Average Value
Number
Average Value
Number
Average Value
LOANS ORIGINATED
1
$41,580
1
$8,720
1
$20,790
0
$0
0
$0
2
$35,540
APPLICATIONS APPROVED, NOT ACCEPTED
0
$0
1
$52,310
0
$0
0
$0
0
$0
1
$10,060
APPLICATIONS DENIED
0
$0
3
$44,483
5
$59,416
2
$2,345
1
$34,870
3
$35,317
APPLICATIONS WITHDRAWN
0
$0
1
$150,880
1
$59,680
0
$0
0
$0
0
$0
FILES CLOSED FOR INCOMPLETENESS
0
$0
0
$0
0
$0
0
$0
0
$0
0
$0
Aggregated Statistics For Year 2003 (Based on 2 partial tracts)
A) FHA, FSA/RHS & VA Home Purchase Loans
B) Conventional Home Purchase Loans
C) Refinancings
D) Home Improvement Loans
F) Non-occupant Loans on < 5 Family Dwellings (A B C & D)
Number
Average Value
Number
Average Value
Number
Average Value
Number
Average Value
Number
Average Value
LOANS ORIGINATED
0
$0
1
$12,070
2
$71,085
0
$0
1
$36,880
APPLICATIONS APPROVED, NOT ACCEPTED
0
$0
2
$66,390
0
$0
0
$0
0
$0
APPLICATIONS DENIED
0
$0
4
$35,710
2
$43,925
1
$6,040
0
$0
APPLICATIONS WITHDRAWN
1
$61,020
0
$0
0
$0
0
$0
0
$0
FILES CLOSED FOR INCOMPLETENESS
0
$0
0
$0
0
$0
0
$0
0
$0
Aggregated Statistics For Year 2002 (Based on 2 partial tracts)
A) FHA, FSA/RHS & VA Home Purchase Loans
B) Conventional Home Purchase Loans
C) Refinancings
D) Home Improvement Loans
F) Non-occupant Loans on < 5 Family Dwellings (A B C & D)
Number
Average Value
Number
Average Value
Number
Average Value
Number
Average Value
Number
Average Value
LOANS ORIGINATED
1
$83,830
2
$12,740
1
$97,910
1
$3,350
0
$0
APPLICATIONS APPROVED, NOT ACCEPTED
0
$0
7
$52,977
0
$0
0
$0
1
$53,650
APPLICATIONS DENIED
0
$0
17
$46,232
4
$42,415
3
$4,693
0
$0
APPLICATIONS WITHDRAWN
0
$0
0
$0
0
$0
0
$0
0
$0
FILES CLOSED FOR INCOMPLETENESS
0
$0
0
$0
0
$0
0
$0
0
$0
Aggregated Statistics For Year 2001 (Based on 2 partial tracts)
B) Conventional Home Purchase Loans
C) Refinancings
D) Home Improvement Loans
F) Non-occupant Loans on < 5 Family Dwellings (A B C & D)
Number
Average Value
Number
Average Value
Number
Average Value
Number
Average Value
LOANS ORIGINATED
7
$18,681
1
$40,910
0
$0
0
$0
APPLICATIONS APPROVED, NOT ACCEPTED
8
$42,331
1
$16,770
1
$4,690
0
$0
APPLICATIONS DENIED
15
$33,933
5
$30,714
3
$2,013
1
$37,550
APPLICATIONS WITHDRAWN
0
$0
2
$72,090
0
$0
0
$0
FILES CLOSED FOR INCOMPLETENESS
0
$0
0
$0
0
$0
0
$0
Aggregated Statistics For Year 2000 (Based on 2 partial tracts)
A) FHA, FSA/RHS & VA Home Purchase Loans
B) Conventional Home Purchase Loans
C) Refinancings
D) Home Improvement Loans
F) Non-occupant Loans on < 5 Family Dwellings (A B C & D)
Number
Average Value
Number
Average Value
Number
Average Value
Number
Average Value
Number
Average Value
LOANS ORIGINATED
1
$26,150
5
$24,008
1
$13,410
1
$20,120
0
$0
APPLICATIONS APPROVED, NOT ACCEPTED
2
$22,130
5
$47,880
0
$0
0
$0
0
$0
APPLICATIONS DENIED
4
$42,080
16
$32,692
1
$4,690
1
$3,350
1
$16,770
APPLICATIONS WITHDRAWN
1
$57,670
1
$18,780
0
$0
0
$0
0
$0
FILES CLOSED FOR INCOMPLETENESS
0
$0
0
$0
0
$0
0
$0
0
$0
Aggregated Statistics For Year 1999 (Based on 1 partial tract)
B) Conventional Home Purchase Loans
C) Refinancings
F) Non-occupant Loans on < 5 Family Dwellings (A B C & D)

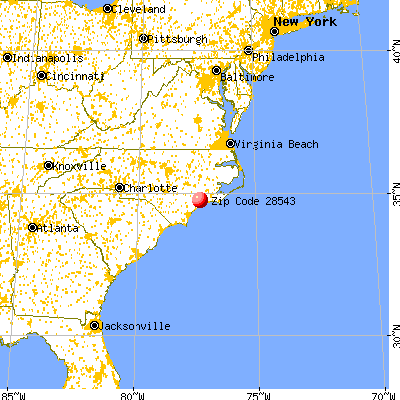


 Nearest zip codes: 28546, 28547, 28544, 28540, 28539, 28460.


 (Location: 60 TERAWA BLVD, Grades: PK-1)


