Estimated zip code population in 2022: 45,822
Zip code population in 2010: 29,363
Zip code population in 2000: 12,367
Houses and condos: 16,115
Renter-occupied apartments: 2,535
% of renters here:
16%State:
33%
March 2022 cost of living index in zip code 27540: 95.8
(near average, U.S. average is 100)
Land area: 46.4
sq. mi.
Water area: 0.5
sq. mi.
Population density: 988 people per square mile (low).
OSM Map
General Map
Google Map
MSN Map
OSM Map
General Map
Google Map
MSN Map
OSM Map
General Map
Google Map
MSN Map
OSM Map
General Map
Google Map
MSN Map
Please wait while loading the map...
Real estate property taxes paid for housing units in 2022:
This zip code:
0.7% ($3,476)North Carolina:
0.6% ($1,769)
Median real estate property taxes paid for housing units with mortgages in 2022: $3,521 (0.7%)
Median real estate property taxes paid for housing units with no mortgage in 2022: $3,209 (0.6%)
Profiles of local businesses
Business Search - 14 Million verified businesses
Males: 21,967 Females: 23,857
For population 25 years and over in 27540:
High school or higher: 98.1%Bachelor's degree or higher: 64.8%Graduate or professional degree: 24.2%Unemployed: 2.4%Mean travel time to work (commute): 29.2 minutes
For population 15 years and over in 27540:
Never married: 23.1%Now married: 66.2%Separated: 1.3%Widowed: 2.5%Divorced: 6.9%
Zip code 27540 compared to state average:
Median household income above state average. Median house value above state average. Black race population percentage below state average. Renting percentage below state average. Length of stay since moving in below state average. Number of rooms per house above state average. House age significantly below state average. Percentage of population with a bachelor's degree or higher above state average. 34,003 74.2% White 4,470 9.8% Black 2,830 6.2% Hispanic or Latino 2,534 5.5% Asian 1,529 3.3% Two or more races 338 0.7% Some other race 114 0.2% American Indian
Data:
Median household income ($)
Median household income (% change since 2000)
Household income diversity
Ratio of average income to average house value (%)
Ratio of average income to average rent
Median household income ($) - White
Median household income ($) - Black or African American
Median household income ($) - Asian
Median household income ($) - Hispanic or Latino
Median household income ($) - American Indian and Alaska Native
Median household income ($) - Multirace
Median household income ($) - Other Race
Median household income for houses/condos with a mortgage ($)
Median household income for apartments without a mortgage ($)
Races - White alone (%)
Races - White alone (% change since 2000)
Races - Black alone (%)
Races - Black alone (% change since 2000)
Races - American Indian alone (%)
Races - American Indian alone (% change since 2000)
Races - Asian alone (%)
Races - Asian alone (% change since 2000)
Races - Hispanic (%)
Races - Hispanic (% change since 2000)
Races - Native Hawaiian and Other Pacific Islander alone (%)
Races - Native Hawaiian and Other Pacific Islander alone (% change since 2000)
Races - Two or more races (%)
Races - Two or more races (% change since 2000)
Races - Other race alone (%)
Races - Other race alone (% change since 2000)
Racial diversity
Unemployment (%)
Unemployment (% change since 2000)
Unemployment (%) - White
Unemployment (%) - Black or African American
Unemployment (%) - Asian
Unemployment (%) - Hispanic or Latino
Unemployment (%) - American Indian and Alaska Native
Unemployment (%) - Multirace
Unemployment (%) - Other Race
Population density (people per square mile)
Population - Males (%)
Population - Females (%)
Population - Males (%) - White
Population - Males (%) - Black or African American
Population - Males (%) - Asian
Population - Males (%) - Hispanic or Latino
Population - Males (%) - American Indian and Alaska Native
Population - Males (%) - Multirace
Population - Males (%) - Other Race
Population - Females (%) - White
Population - Females (%) - Black or African American
Population - Females (%) - Asian
Population - Females (%) - Hispanic or Latino
Population - Females (%) - American Indian and Alaska Native
Population - Females (%) - Multirace
Population - Females (%) - Other Race
Coronavirus confirmed cases (May 23, 2024)
Deaths caused by coronavirus (May 23, 2024)
Coronavirus confirmed cases (per 100k population) (May 23, 2024)
Deaths caused by coronavirus (per 100k population) (May 23, 2024)
Daily increase in number of cases (May 23, 2024)
Weekly increase in number of cases (May 23, 2024)
Cases doubled (in days) (May 23, 2024)
Hospitalized patients (Apr 18, 2022)
Negative test results (Apr 18, 2022)
Total test results (Apr 18, 2022)
COVID Vaccine doses distributed (per 100k population) (Sep 19, 2023)
COVID Vaccine doses administered (per 100k population) (Sep 19, 2023)
COVID Vaccine doses distributed (Sep 19, 2023)
COVID Vaccine doses administered (Sep 19, 2023)
Likely homosexual households (%)
Likely homosexual households (% change since 2000)
Likely homosexual households - Lesbian couples (%)
Likely homosexual households - Lesbian couples (% change since 2000)
Likely homosexual households - Gay men (%)
Likely homosexual households - Gay men (% change since 2000)
Cost of living index
Median gross rent ($)
Median contract rent ($)
Median monthly housing costs ($)
Median house or condo value ($)
Median house or condo value ($ change since 2000)
Mean house or condo value by units in structure - 1, detached ($)
Mean house or condo value by units in structure - 1, attached ($)
Mean house or condo value by units in structure - 2 ($)
Mean house or condo value by units in structure by units in structure - 3 or 4 ($)
Mean house or condo value by units in structure - 5 or more ($)
Mean house or condo value by units in structure - Boat, RV, van, etc. ($)
Mean house or condo value by units in structure - Mobile home ($)
Median house or condo value ($) - White
Median house or condo value ($) - Black or African American
Median house or condo value ($) - Asian
Median house or condo value ($) - Hispanic or Latino
Median house or condo value ($) - American Indian and Alaska Native
Median house or condo value ($) - Multirace
Median house or condo value ($) - Other Race
Median resident age
Resident age diversity
Median resident age - Males
Median resident age - Females
Median resident age - White
Median resident age - Black or African American
Median resident age - Asian
Median resident age - Hispanic or Latino
Median resident age - American Indian and Alaska Native
Median resident age - Multirace
Median resident age - Other Race
Median resident age - Males - White
Median resident age - Males - Black or African American
Median resident age - Males - Asian
Median resident age - Males - Hispanic or Latino
Median resident age - Males - American Indian and Alaska Native
Median resident age - Males - Multirace
Median resident age - Males - Other Race
Median resident age - Females - White
Median resident age - Females - Black or African American
Median resident age - Females - Asian
Median resident age - Females - Hispanic or Latino
Median resident age - Females - American Indian and Alaska Native
Median resident age - Females - Multirace
Median resident age - Females - Other Race
Commute - mean travel time to work (minutes)
Travel time to work - Less than 5 minutes (%)
Travel time to work - Less than 5 minutes (% change since 2000)
Travel time to work - 5 to 9 minutes (%)
Travel time to work - 5 to 9 minutes (% change since 2000)
Travel time to work - 10 to 19 minutes (%)
Travel time to work - 10 to 19 minutes (% change since 2000)
Travel time to work - 20 to 29 minutes (%)
Travel time to work - 20 to 29 minutes (% change since 2000)
Travel time to work - 30 to 39 minutes (%)
Travel time to work - 30 to 39 minutes (% change since 2000)
Travel time to work - 40 to 59 minutes (%)
Travel time to work - 40 to 59 minutes (% change since 2000)
Travel time to work - 60 to 89 minutes (%)
Travel time to work - 60 to 89 minutes (% change since 2000)
Travel time to work - 90 or more minutes (%)
Travel time to work - 90 or more minutes (% change since 2000)
Marital status - Never married (%)
Marital status - Now married (%)
Marital status - Separated (%)
Marital status - Widowed (%)
Marital status - Divorced (%)
Median family income ($)
Median family income (% change since 2000)
Median non-family income ($)
Median non-family income (% change since 2000)
Median per capita income ($)
Median per capita income (% change since 2000)
Median family income ($) - White
Median family income ($) - Black or African American
Median family income ($) - Asian
Median family income ($) - Hispanic or Latino
Median family income ($) - American Indian and Alaska Native
Median family income ($) - Multirace
Median family income ($) - Other Race
Median year house/condo built
Median year apartment built
Year house built - Built 2005 or later (%)
Year house built - Built 2000 to 2004 (%)
Year house built - Built 1990 to 1999 (%)
Year house built - Built 1980 to 1989 (%)
Year house built - Built 1970 to 1979 (%)
Year house built - Built 1960 to 1969 (%)
Year house built - Built 1950 to 1959 (%)
Year house built - Built 1940 to 1949 (%)
Year house built - Built 1939 or earlier (%)
Average household size
Household density (households per square mile)
Average household size - White
Average household size - Black or African American
Average household size - Asian
Average household size - Hispanic or Latino
Average household size - American Indian and Alaska Native
Average household size - Multirace
Average household size - Other Race
Occupied housing units (%)
Vacant housing units (%)
Owner occupied housing units (%)
Renter occupied housing units (%)
Vacancy status - For rent (%)
Vacancy status - For sale only (%)
Vacancy status - Rented or sold, not occupied (%)
Vacancy status - For seasonal, recreational, or occasional use (%)
Vacancy status - For migrant workers (%)
Vacancy status - Other vacant (%)
Residents with income below the poverty level (%)
Residents with income below 50% of the poverty level (%)
Children below poverty level (%)
Poor families by family type - Married-couple family (%)
Poor families by family type - Male, no wife present (%)
Poor families by family type - Female, no husband present (%)
Poverty status for native-born residents (%)
Poverty status for foreign-born residents (%)
Poverty among high school graduates not in families (%)
Poverty among people who did not graduate high school not in families (%)
Residents with income below the poverty level (%) - White
Residents with income below the poverty level (%) - Black or African American
Residents with income below the poverty level (%) - Asian
Residents with income below the poverty level (%) - Hispanic or Latino
Residents with income below the poverty level (%) - American Indian and Alaska Native
Residents with income below the poverty level (%) - Multirace
Residents with income below the poverty level (%) - Other Race
Air pollution - Air Quality Index (AQI)
Air pollution - CO
Air pollution - NO2
Air pollution - SO2
Air pollution - Ozone
Air pollution - PM10
Air pollution - PM25
Air pollution - Pb
Crime - Murders per 100,000 population
Crime - Rapes per 100,000 population
Crime - Robberies per 100,000 population
Crime - Assaults per 100,000 population
Crime - Burglaries per 100,000 population
Crime - Thefts per 100,000 population
Crime - Auto thefts per 100,000 population
Crime - Arson per 100,000 population
Crime - City-data.com crime index
Crime - Violent crime index
Crime - Property crime index
Crime - Murders per 100,000 population (5 year average)
Crime - Rapes per 100,000 population (5 year average)
Crime - Robberies per 100,000 population (5 year average)
Crime - Assaults per 100,000 population (5 year average)
Crime - Burglaries per 100,000 population (5 year average)
Crime - Thefts per 100,000 population (5 year average)
Crime - Auto thefts per 100,000 population (5 year average)
Crime - Arson per 100,000 population (5 year average)
Crime - City-data.com crime index (5 year average)
Crime - Violent crime index (5 year average)
Crime - Property crime index (5 year average)
1996 Presidential Elections Results (%) - Democratic Party (Clinton)
1996 Presidential Elections Results (%) - Republican Party (Dole)
1996 Presidential Elections Results (%) - Other
2000 Presidential Elections Results (%) - Democratic Party (Gore)
2000 Presidential Elections Results (%) - Republican Party (Bush)
2000 Presidential Elections Results (%) - Other
2004 Presidential Elections Results (%) - Democratic Party (Kerry)
2004 Presidential Elections Results (%) - Republican Party (Bush)
2004 Presidential Elections Results (%) - Other
2008 Presidential Elections Results (%) - Democratic Party (Obama)
2008 Presidential Elections Results (%) - Republican Party (McCain)
2008 Presidential Elections Results (%) - Other
2012 Presidential Elections Results (%) - Democratic Party (Obama)
2012 Presidential Elections Results (%) - Republican Party (Romney)
2012 Presidential Elections Results (%) - Other
2016 Presidential Elections Results (%) - Democratic Party (Clinton)
2016 Presidential Elections Results (%) - Republican Party (Trump)
2016 Presidential Elections Results (%) - Other
2020 Presidential Elections Results (%) - Democratic Party (Biden)
2020 Presidential Elections Results (%) - Republican Party (Trump)
2020 Presidential Elections Results (%) - Other
Ancestries Reported - Arab (%)
Ancestries Reported - Czech (%)
Ancestries Reported - Danish (%)
Ancestries Reported - Dutch (%)
Ancestries Reported - English (%)
Ancestries Reported - French (%)
Ancestries Reported - French Canadian (%)
Ancestries Reported - German (%)
Ancestries Reported - Greek (%)
Ancestries Reported - Hungarian (%)
Ancestries Reported - Irish (%)
Ancestries Reported - Italian (%)
Ancestries Reported - Lithuanian (%)
Ancestries Reported - Norwegian (%)
Ancestries Reported - Polish (%)
Ancestries Reported - Portuguese (%)
Ancestries Reported - Russian (%)
Ancestries Reported - Scotch-Irish (%)
Ancestries Reported - Scottish (%)
Ancestries Reported - Slovak (%)
Ancestries Reported - Subsaharan African (%)
Ancestries Reported - Swedish (%)
Ancestries Reported - Swiss (%)
Ancestries Reported - Ukrainian (%)
Ancestries Reported - United States (%)
Ancestries Reported - Welsh (%)
Ancestries Reported - West Indian (%)
Ancestries Reported - Other (%)
Educational Attainment - No schooling completed (%)
Educational Attainment - Less than high school (%)
Educational Attainment - High school or equivalent (%)
Educational Attainment - Less than 1 year of college (%)
Educational Attainment - 1 or more years of college (%)
Educational Attainment - Associate degree (%)
Educational Attainment - Bachelor's degree (%)
Educational Attainment - Master's degree (%)
Educational Attainment - Professional school degree (%)
Educational Attainment - Doctorate degree (%)
School Enrollment - Nursery, preschool (%)
School Enrollment - Kindergarten (%)
School Enrollment - Grade 1 to 4 (%)
School Enrollment - Grade 5 to 8 (%)
School Enrollment - Grade 9 to 12 (%)
School Enrollment - College undergrad (%)
School Enrollment - Graduate or professional (%)
School Enrollment - Not enrolled in school (%)
School enrollment - Public schools (%)
School enrollment - Private schools (%)
School enrollment - Not enrolled (%)
Median number of rooms in houses and condos
Median number of rooms in apartments
Housing units lacking complete plumbing facilities (%)
Housing units lacking complete kitchen facilities (%)
Density of houses
Urban houses (%)
Rural houses (%)
Households with people 60 years and over (%)
Households with people 65 years and over (%)
Households with people 75 years and over (%)
Households with one or more nonrelatives (%)
Households with no nonrelatives (%)
Population in households (%)
Family households (%)
Nonfamily households (%)
Population in families (%)
Family households with own children (%)
Median number of bedrooms in owner occupied houses
Mean number of bedrooms in owner occupied houses
Median number of bedrooms in renter occupied houses
Mean number of bedrooms in renter occupied houses
Median number of vehichles in owner occupied houses
Mean number of vehichles in owner occupied houses
Median number of vehichles in renter occupied houses
Mean number of vehichles in renter occupied houses
Mortgage status - with mortgage (%)
Mortgage status - with second mortgage (%)
Mortgage status - with home equity loan (%)
Mortgage status - with both second mortgage and home equity loan (%)
Mortgage status - without a mortgage (%)
Average family size
Average family size - White
Average family size - Black or African American
Average family size - Asian
Average family size - Hispanic or Latino
Average family size - American Indian and Alaska Native
Average family size - Multirace
Average family size - Other Race
Geographical mobility - Same house 1 year ago (%)
Geographical mobility - Moved within same county (%)
Geographical mobility - Moved from different county within same state (%)
Geographical mobility - Moved from different state (%)
Geographical mobility - Moved from abroad (%)
Place of birth - Born in state of residence (%)
Place of birth - Born in other state (%)
Place of birth - Native, outside of US (%)
Place of birth - Foreign born (%)
Housing units in structures - 1, detached (%)
Housing units in structures - 1, attached (%)
Housing units in structures - 2 (%)
Housing units in structures - 3 or 4 (%)
Housing units in structures - 5 to 9 (%)
Housing units in structures - 10 to 19 (%)
Housing units in structures - 20 to 49 (%)
Housing units in structures - 50 or more (%)
Housing units in structures - Mobile home (%)
Housing units in structures - Boat, RV, van, etc. (%)
House/condo owner moved in on average (years ago)
Renter moved in on average (years ago)
Year householder moved into unit - Moved in 1999 to March 2000 (%)
Year householder moved into unit - Moved in 1995 to 1998 (%)
Year householder moved into unit - Moved in 1990 to 1994 (%)
Year householder moved into unit - Moved in 1980 to 1989 (%)
Year householder moved into unit - Moved in 1970 to 1979 (%)
Year householder moved into unit - Moved in 1969 or earlier (%)
Means of transportation to work - Drove car alone (%)
Means of transportation to work - Carpooled (%)
Means of transportation to work - Public transportation (%)
Means of transportation to work - Bus or trolley bus (%)
Means of transportation to work - Streetcar or trolley car (%)
Means of transportation to work - Subway or elevated (%)
Means of transportation to work - Railroad (%)
Means of transportation to work - Ferryboat (%)
Means of transportation to work - Taxicab (%)
Means of transportation to work - Motorcycle (%)
Means of transportation to work - Bicycle (%)
Means of transportation to work - Walked (%)
Means of transportation to work - Other means (%)
Working at home (%)
Industry diversity
Most Common Industries - Agriculture, forestry, fishing and hunting, and mining (%)
Most Common Industries - Agriculture, forestry, fishing and hunting (%)
Most Common Industries - Mining, quarrying, and oil and gas extraction (%)
Most Common Industries - Construction (%)
Most Common Industries - Manufacturing (%)
Most Common Industries - Wholesale trade (%)
Most Common Industries - Retail trade (%)
Most Common Industries - Transportation and warehousing, and utilities (%)
Most Common Industries - Transportation and warehousing (%)
Most Common Industries - Utilities (%)
Most Common Industries - Information (%)
Most Common Industries - Finance and insurance, and real estate and rental and leasing (%)
Most Common Industries - Finance and insurance (%)
Most Common Industries - Real estate and rental and leasing (%)
Most Common Industries - Professional, scientific, and management, and administrative and waste management services (%)
Most Common Industries - Professional, scientific, and technical services (%)
Most Common Industries - Management of companies and enterprises (%)
Most Common Industries - Administrative and support and waste management services (%)
Most Common Industries - Educational services, and health care and social assistance (%)
Most Common Industries - Educational services (%)
Most Common Industries - Health care and social assistance (%)
Most Common Industries - Arts, entertainment, and recreation, and accommodation and food services (%)
Most Common Industries - Arts, entertainment, and recreation (%)
Most Common Industries - Accommodation and food services (%)
Most Common Industries - Other services, except public administration (%)
Most Common Industries - Public administration (%)
Occupation diversity
Most Common Occupations - Management, business, science, and arts occupations (%)
Most Common Occupations - Management, business, and financial occupations (%)
Most Common Occupations - Management occupations (%)
Most Common Occupations - Business and financial operations occupations (%)
Most Common Occupations - Computer, engineering, and science occupations (%)
Most Common Occupations - Computer and mathematical occupations (%)
Most Common Occupations - Architecture and engineering occupations (%)
Most Common Occupations - Life, physical, and social science occupations (%)
Most Common Occupations - Education, legal, community service, arts, and media occupations (%)
Most Common Occupations - Community and social service occupations (%)
Most Common Occupations - Legal occupations (%)
Most Common Occupations - Education, training, and library occupations (%)
Most Common Occupations - Arts, design, entertainment, sports, and media occupations (%)
Most Common Occupations - Healthcare practitioners and technical occupations (%)
Most Common Occupations - Health diagnosing and treating practitioners and other technical occupations (%)
Most Common Occupations - Health technologists and technicians (%)
Most Common Occupations - Service occupations (%)
Most Common Occupations - Healthcare support occupations (%)
Most Common Occupations - Protective service occupations (%)
Most Common Occupations - Fire fighting and prevention, and other protective service workers including supervisors (%)
Most Common Occupations - Law enforcement workers including supervisors (%)
Most Common Occupations - Food preparation and serving related occupations (%)
Most Common Occupations - Building and grounds cleaning and maintenance occupations (%)
Most Common Occupations - Personal care and service occupations (%)
Most Common Occupations - Sales and office occupations (%)
Most Common Occupations - Sales and related occupations (%)
Most Common Occupations - Office and administrative support occupations (%)
Most Common Occupations - Natural resources, construction, and maintenance occupations (%)
Most Common Occupations - Farming, fishing, and forestry occupations (%)
Most Common Occupations - Construction and extraction occupations (%)
Most Common Occupations - Installation, maintenance, and repair occupations (%)
Most Common Occupations - Production, transportation, and material moving occupations (%)
Most Common Occupations - Production occupations (%)
Most Common Occupations - Transportation occupations (%)
Most Common Occupations - Material moving occupations (%)
People in Group quarters - Institutionalized population (%)
People in Group quarters - Correctional institutions (%)
People in Group quarters - Federal prisons and detention centers (%)
People in Group quarters - Halfway houses (%)
People in Group quarters - Local jails and other confinement facilities (including police lockups) (%)
People in Group quarters - Military disciplinary barracks (%)
People in Group quarters - State prisons (%)
People in Group quarters - Other types of correctional institutions (%)
People in Group quarters - Nursing homes (%)
People in Group quarters - Hospitals/wards, hospices, and schools for the handicapped (%)
People in Group quarters - Hospitals/wards and hospices for chronically ill (%)
People in Group quarters - Hospices or homes for chronically ill (%)
People in Group quarters - Military hospitals or wards for chronically ill (%)
People in Group quarters - Other hospitals or wards for chronically ill (%)
People in Group quarters - Hospitals or wards for drug/alcohol abuse (%)
People in Group quarters - Mental (Psychiatric) hospitals or wards (%)
People in Group quarters - Schools, hospitals, or wards for the mentally retarded (%)
People in Group quarters - Schools, hospitals, or wards for the physically handicapped (%)
People in Group quarters - Institutions for the deaf (%)
People in Group quarters - Institutions for the blind (%)
People in Group quarters - Orthopedic wards and institutions for the physically handicapped (%)
People in Group quarters - Wards in general hospitals for patients who have no usual home elsewhere (%)
People in Group quarters - Wards in military hospitals for patients who have no usual home elsewhere (%)
People in Group quarters - Juvenile institutions (%)
People in Group quarters - Long-term care (%)
People in Group quarters - Homes for abused, dependent, and neglected children (%)
People in Group quarters - Residential treatment centers for emotionally disturbed children (%)
People in Group quarters - Training schools for juvenile delinquents (%)
People in Group quarters - Short-term care, detention or diagnostic centers for delinquent children (%)
People in Group quarters - Type of juvenile institution unknown (%)
People in Group quarters - Noninstitutionalized population (%)
People in Group quarters - College dormitories (includes college quarters off campus) (%)
People in Group quarters - Military quarters (%)
People in Group quarters - On base (%)
People in Group quarters - Barracks, unaccompanied personnel housing (UPH), (Enlisted/Officer), ;and similar group living quarters for military personnel (%)
People in Group quarters - Transient quarters for temporary residents (%)
People in Group quarters - Military ships (%)
People in Group quarters - Group homes (%)
People in Group quarters - Homes or halfway houses for drug/alcohol abuse (%)
People in Group quarters - Homes for the mentally ill (%)
People in Group quarters - Homes for the mentally retarded (%)
People in Group quarters - Homes for the physically handicapped (%)
People in Group quarters - Other group homes (%)
People in Group quarters - Religious group quarters (%)
People in Group quarters - Dormitories (%)
People in Group quarters - Agriculture workers' dormitories on farms (%)
People in Group quarters - Job Corps and vocational training facilities (%)
People in Group quarters - Other workers' dormitories (%)
People in Group quarters - Crews of maritime vessels (%)
People in Group quarters - Other nonhousehold living situations (%)
People in Group quarters - Other noninstitutional group quarters (%)
Residents speaking English at home (%)
Residents speaking English at home - Born in the United States (%)
Residents speaking English at home - Native, born elsewhere (%)
Residents speaking English at home - Foreign born (%)
Residents speaking Spanish at home (%)
Residents speaking Spanish at home - Born in the United States (%)
Residents speaking Spanish at home - Native, born elsewhere (%)
Residents speaking Spanish at home - Foreign born (%)
Residents speaking other language at home (%)
Residents speaking other language at home - Born in the United States (%)
Residents speaking other language at home - Native, born elsewhere (%)
Residents speaking other language at home - Foreign born (%)
Class of Workers - Employee of private company (%)
Class of Workers - Self-employed in own incorporated business (%)
Class of Workers - Private not-for-profit wage and salary workers (%)
Class of Workers - Local government workers (%)
Class of Workers - State government workers (%)
Class of Workers - Federal government workers (%)
Class of Workers - Self-employed workers in own not incorporated business and Unpaid family workers (%)
House heating fuel used in houses and condos - Utility gas (%)
House heating fuel used in houses and condos - Bottled, tank, or LP gas (%)
House heating fuel used in houses and condos - Electricity (%)
House heating fuel used in houses and condos - Fuel oil, kerosene, etc. (%)
House heating fuel used in houses and condos - Coal or coke (%)
House heating fuel used in houses and condos - Wood (%)
House heating fuel used in houses and condos - Solar energy (%)
House heating fuel used in houses and condos - Other fuel (%)
House heating fuel used in houses and condos - No fuel used (%)
House heating fuel used in apartments - Utility gas (%)
House heating fuel used in apartments - Bottled, tank, or LP gas (%)
House heating fuel used in apartments - Electricity (%)
House heating fuel used in apartments - Fuel oil, kerosene, etc. (%)
House heating fuel used in apartments - Coal or coke (%)
House heating fuel used in apartments - Wood (%)
House heating fuel used in apartments - Solar energy (%)
House heating fuel used in apartments - Other fuel (%)
House heating fuel used in apartments - No fuel used (%)
Armed forces status - In Armed Forces (%)
Armed forces status - Civilian (%)
Armed forces status - Civilian - Veteran (%)
Armed forces status - Civilian - Nonveteran (%)
Fatal accidents locations in years 2005-2021
Fatal accidents locations in 2005
Fatal accidents locations in 2006
Fatal accidents locations in 2007
Fatal accidents locations in 2008
Fatal accidents locations in 2009
Fatal accidents locations in 2010
Fatal accidents locations in 2011
Fatal accidents locations in 2012
Fatal accidents locations in 2013
Fatal accidents locations in 2014
Fatal accidents locations in 2015
Fatal accidents locations in 2016
Fatal accidents locations in 2017
Fatal accidents locations in 2018
Fatal accidents locations in 2019
Fatal accidents locations in 2020
Fatal accidents locations in 2021
Alcohol use - People drinking some alcohol every month (%)
Alcohol use - People not drinking at all (%)
Alcohol use - Average days/month drinking alcohol
Alcohol use - Average drinks/week
Alcohol use - Average days/year people drink much
Audiometry - Average condition of hearing (%)
Audiometry - People that can hear a whisper from across a quiet room (%)
Audiometry - People that can hear normal voice from across a quiet room (%)
Audiometry - Ears ringing, roaring, buzzing (%)
Audiometry - Had a job exposure to loud noise (%)
Audiometry - Had off-work exposure to loud noise (%)
Blood Pressure & Cholesterol - Has high blood pressure (%)
Blood Pressure & Cholesterol - Checking blood pressure at home (%)
Blood Pressure & Cholesterol - Frequently checking blood cholesterol (%)
Blood Pressure & Cholesterol - Has high cholesterol level (%)
Consumer Behavior - Money monthly spent on food at supermarket/grocery store
Consumer Behavior - Money monthly spent on food at other stores
Consumer Behavior - Money monthly spent on eating out
Consumer Behavior - Money monthly spent on carryout/delivered foods
Consumer Behavior - Income spent on food at supermarket/grocery store (%)
Consumer Behavior - Income spent on food at other stores (%)
Consumer Behavior - Income spent on eating out (%)
Consumer Behavior - Income spent on carryout/delivered foods (%)
Current Health Status - General health condition (%)
Current Health Status - Blood donors (%)
Current Health Status - Has blood ever tested for HIV virus (%)
Current Health Status - Left-handed people (%)
Dermatology - People using sunscreen (%)
Diabetes - Diabetics (%)
Diabetes - Had a blood test for high blood sugar (%)
Diabetes - People taking insulin (%)
Diet Behavior & Nutrition - Diet health (%)
Diet Behavior & Nutrition - Milk product consumption (# of products/month)
Diet Behavior & Nutrition - Meals not home prepared (#/week)
Diet Behavior & Nutrition - Meals from fast food or pizza place (#/week)
Diet Behavior & Nutrition - Ready-to-eat foods (#/month)
Diet Behavior & Nutrition - Frozen meals/pizza (#/month)
Drug Use - People that ever used marijuana or hashish (%)
Drug Use - Ever used hard drugs (%)
Drug Use - Ever used any form of cocaine (%)
Drug Use - Ever used heroin (%)
Drug Use - Ever used methamphetamine (%)
Health Insurance - People covered by health insurance (%)
Kidney Conditions-Urology - Avg. # of times urinating at night
Medical Conditions - People with asthma (%)
Medical Conditions - People with anemia (%)
Medical Conditions - People with psoriasis (%)
Medical Conditions - People with overweight (%)
Medical Conditions - Elderly people having difficulties in thinking or remembering (%)
Medical Conditions - People who ever received blood transfusion (%)
Medical Conditions - People having trouble seeing even with glass/contacts (%)
Medical Conditions - People with arthritis (%)
Medical Conditions - People with gout (%)
Medical Conditions - People with congestive heart failure (%)
Medical Conditions - People with coronary heart disease (%)
Medical Conditions - People with angina pectoris (%)
Medical Conditions - People who ever had heart attack (%)
Medical Conditions - People who ever had stroke (%)
Medical Conditions - People with emphysema (%)
Medical Conditions - People with thyroid problem (%)
Medical Conditions - People with chronic bronchitis (%)
Medical Conditions - People with any liver condition (%)
Medical Conditions - People who ever had cancer or malignancy (%)
Mental Health - People who have little interest in doing things (%)
Mental Health - People feeling down, depressed, or hopeless (%)
Mental Health - People who have trouble sleeping or sleeping too much (%)
Mental Health - People feeling tired or having little energy (%)
Mental Health - People with poor appetite or overeating (%)
Mental Health - People feeling bad about themself (%)
Mental Health - People who have trouble concentrating on things (%)
Mental Health - People moving or speaking slowly or too fast (%)
Mental Health - People having thoughts they would be better off dead (%)
Oral Health - Average years since last visit a dentist
Oral Health - People embarrassed because of mouth (%)
Oral Health - People with gum disease (%)
Oral Health - General health of teeth and gums (%)
Oral Health - Average days a week using dental floss/device
Oral Health - Average days a week using mouthwash for dental problem
Oral Health - Average number of teeth
Pesticide Use - Households using pesticides to control insects (%)
Pesticide Use - Households using pesticides to kill weeds (%)
Physical Activity - People doing vigorous-intensity work activities (%)
Physical Activity - People doing moderate-intensity work activities (%)
Physical Activity - People walking or bicycling (%)
Physical Activity - People doing vigorous-intensity recreational activities (%)
Physical Activity - People doing moderate-intensity recreational activities (%)
Physical Activity - Average hours a day doing sedentary activities
Physical Activity - Average hours a day watching TV or videos
Physical Activity - Average hours a day using computer
Physical Functioning - People having limitations keeping them from working (%)
Physical Functioning - People limited in amount of work they can do (%)
Physical Functioning - People that need special equipment to walk (%)
Physical Functioning - People experiencing confusion/memory problems (%)
Physical Functioning - People requiring special healthcare equipment (%)
Prescription Medications - Average number of prescription medicines taking
Preventive Aspirin Use - Adults 40+ taking low-dose aspirin (%)
Reproductive Health - Vaginal deliveries (%)
Reproductive Health - Cesarean deliveries (%)
Reproductive Health - Deliveries resulted in a live birth (%)
Reproductive Health - Pregnancies resulted in a delivery (%)
Reproductive Health - Women breastfeeding newborns (%)
Reproductive Health - Women that had a hysterectomy (%)
Reproductive Health - Women that had both ovaries removed (%)
Reproductive Health - Women that have ever taken birth control pills (%)
Reproductive Health - Women taking birth control pills (%)
Reproductive Health - Women that have ever used Depo-Provera or injectables (%)
Reproductive Health - Women that have ever used female hormones (%)
Sexual Behavior - People 18+ that ever had sex (vaginal, anal, or oral) (%)
Sexual Behavior - Males 18+ that ever had vaginal sex with a woman (%)
Sexual Behavior - Males 18+ that ever performed oral sex on a woman (%)
Sexual Behavior - Males 18+ that ever had anal sex with a woman (%)
Sexual Behavior - Males 18+ that ever had any sex with a man (%)
Sexual Behavior - Females 18+ that ever had vaginal sex with a man (%)
Sexual Behavior - Females 18+ that ever performed oral sex on a man (%)
Sexual Behavior - Females 18+ that ever had anal sex with a man (%)
Sexual Behavior - Females 18+ that ever had any kind of sex with a woman (%)
Sexual Behavior - Average age people first had sex
Sexual Behavior - Average number of female sex partners in lifetime (males 18+)
Sexual Behavior - Average number of female vaginal sex partners in lifetime (males 18+)
Sexual Behavior - Average age people first performed oral sex on a woman (18+)
Sexual Behavior - Average number of woman performed oral sex on in lifetime (18+)
Sexual Behavior - Average number of male sex partners in lifetime (males 18+)
Sexual Behavior - Average number of male anal sex partners in lifetime (males 18+)
Sexual Behavior - Average age people first performed oral sex on a man (18+)
Sexual Behavior - Average number of male oral sex partners in lifetime (18+)
Sexual Behavior - People using protection when performing oral sex (%)
Sexual Behavior - Average number of times people have vaginal or anal sex a year
Sexual Behavior - People having sex without condom (%)
Sexual Behavior - Average number of male sex partners in lifetime (females 18+)
Sexual Behavior - Average number of male vaginal sex partners in lifetime (females 18+)
Sexual Behavior - Average number of female sex partners in lifetime (females 18+)
Sexual Behavior - Circumcised males 18+ (%)
Sleep Disorders - Average hours sleeping at night
Sleep Disorders - People that has trouble sleeping (%)
Smoking-Cigarette Use - People smoking cigarettes (%)
Taste & Smell - People 40+ having problems with smell (%)
Taste & Smell - People 40+ having problems with taste (%)
Taste & Smell - People 40+ that ever had wisdom teeth removed (%)
Taste & Smell - People 40+ that ever had tonsils teeth removed (%)
Taste & Smell - People 40+ that ever had a loss of consciousness because of a head injury (%)
Taste & Smell - People 40+ that ever had a broken nose or other serious injury to face or skull (%)
Taste & Smell - People 40+ that ever had two or more sinus infections (%)
Weight - Average height (inches)
Weight - Average weight (pounds)
Weight - Average BMI
Weight - People that are obese (%)
Weight - People that ever were obese (%)
Weight - People trying to lose weight (%)
Urban population: 32,346
Rural population: 13,475
Estimated median house/condo value in 2022: $528,111
27540:
$528,111North Carolina:
$280,600
According to our research of North Carolina and other state lists, there were 12 registered sex offenders living in 27540 zip code as of May 23, 2024 . The ratio of all residents to sex offenders in zip code 27540 is 2,903 to 1.The ratio of registered sex offenders to all residents in this zip code is much lower than the state average.
Median resident age: This zip code:
36.0 yearsNorth Carolina median age:
39.2 years
Average household size: This zip code:
3.0 peopleNorth Carolina:
2.4 people
Averages for the 2020 tax year for zip code 27540, filed in 2021:
Average Adjusted Gross Income (AGI) in 2020: $112,298 (Individual Income Tax Returns) Here:
$112,298State:
$70,020
Salary/wage: $104,223 (reported on 87.6% of returns )Here:
$104,223State:
$58,387
(% of AGI for various income ranges: 1152.9% for AGIs below $25k , 3640.8% for AGIs $25k-50k , 6691.1% for AGIs $50k-75k , 10042.1% for AGIs $75k-100k , 20166.7% for AGIs $100k-200k , 74430.1% for AGIs over 200k ) Taxable interest for individuals: $824 (reported on 41.0% of returns )This zip code:
$824North Carolina:
$1,479
(% of AGI for various income ranges: 14.7% for AGIs below $25k , 22.8% for AGIs $25k-50k , 38.5% for AGIs $50k-75k , 40.9% for AGIs $75k-100k , 54.9% for AGIs $100k-200k , 261.2% for AGIs over 200k ) Ordinary dividends: $3,841 (reported on 29.2% of returns )(% of AGI for various income ranges: 24.3% for AGIs below $25k , 45.8% for AGIs $25k-50k , 98.1% for AGIs $50k-75k , 124.8% for AGIs $75k-100k , 176.5% for AGIs $100k-200k , 1087.1% for AGIs over 200k ) Net capital gain/loss in AGI: +$15,939 (reported on 27.3% of returns )Here:
+$15,939State:
+$23,652
(% of AGI for various income ranges: 25.3% for AGIs below $25k , 47.9% for AGIs $25k-50k , 79.1% for AGIs $50k-75k , 155.0% for AGIs $75k-100k , 358.5% for AGIs $100k-200k , 6717.0% for AGIs over 200k ) Profit/loss from business: +$14,093 (reported on 18.5% of returns )Here:
+$14,093State:
+$11,710
(% of AGI for various income ranges: 133.2% for AGIs below $25k , 195.0% for AGIs $25k-50k , 283.8% for AGIs $50k-75k , 337.6% for AGIs $75k-100k , 489.3% for AGIs $100k-200k , 1710.3% for AGIs over 200k ) Taxable individual retirement arrangement distribution: $22,414 (reported on 8.3% of returns )27540:
$22,414North Carolina:
$20,247
(% of AGI for various income ranges: 51.8% for AGIs below $25k , 111.9% for AGIs $25k-50k , 240.1% for AGIs $50k-75k , 310.5% for AGIs $75k-100k , 434.7% for AGIs $100k-200k , 939.5% for AGIs over 200k ) Self-employed (Keogh) retirement plans: $17,594 (reported on 0.9% of returns )27540:
$17,594North Carolina:
$26,749
(% of AGI for various income ranges: 14.4% for AGIs $50k-75k , 18.1% for AGIs $100k-200k , 220.7% for AGIs over 200k ) Total itemized deductions: $31,150 (reported on 17.0% of returns )Here:
$31,150State:
$34,549
(% of AGI for various income ranges: 52.2% for AGIs below $25k , 169.4% for AGIs $25k-50k , 366.0% for AGIs $50k-75k , 617.8% for AGIs $75k-100k , 1162.8% for AGIs $100k-200k , 4461.9% for AGIs over 200k ) Charity contributions: $9,606 (reported on 14.0% of returns )(% of AGI for various income ranges: 4.5% for AGIs below $25k , 20.5% for AGIs $25k-50k , 56.6% for AGIs $50k-75k , 107.7% for AGIs $75k-100k , 246.2% for AGIs $100k-200k , 1488.7% for AGIs over 200k ) Taxes paid: $8,779 (reported on 16.9% of returns )(% of AGI for various income ranges: 9.5% for AGIs below $25k , 34.0% for AGIs $25k-50k , 91.6% for AGIs $50k-75k , 175.9% for AGIs $75k-100k , 370.1% for AGIs $100k-200k , 1161.8% for AGIs over 200k ) Earned income credit: $2,180 (reported on 8.0% of returns )(% of AGI for various income ranges: 63.6% for AGIs below $25k , 69.5% for AGIs $25k-50k , 1.3% for AGIs $50k-75k ) Percentage of individuals using paid preparers for their 2020 taxes: 94.2%(% for various income ranges: 91.7% for AGIs below $25k , 93.5% for AGIs $25k-50k , 94.1% for AGIs $50k-75k , 94.5% for AGIs $75k-100k , 95.6% for AGIs $100k-200k , 96.4% for AGIs over 200k )
Averages for the 2012 tax year for zip code 27540, filed in 2013:
Average Adjusted Gross Income (AGI) in 2012: $81,522 (Individual Income Tax Returns) Here:
$81,522State:
$54,937
Salary/wage: $75,780 (reported on 90.7% of returns )Here:
$75,780State:
$46,336
(% of AGI for various income ranges: 78.5% for AGIs below $25k , 82.9% for AGIs $25k-50k , 84.0% for AGIs $50k-75k , 85.1% for AGIs $75k-100k , 87.5% for AGIs $100k-200k , 80.1% for AGIs over 200k ) Taxable interest for individuals: $649 (reported on 43.7% of returns )This zip code:
$649North Carolina:
$1,298
(% of AGI for various income ranges: 1.0% for AGIs below $25k , 0.4% for AGIs $25k-50k , 0.4% for AGIs $50k-75k , 0.3% for AGIs $75k-100k , 0.4% for AGIs $100k-200k , 0.3% for AGIs over 200k ) Ordinary dividends: $2,973 (reported on 25.1% of returns )(% of AGI for various income ranges: 1.5% for AGIs below $25k , 0.7% for AGIs $25k-50k , 0.6% for AGIs $50k-75k , 0.7% for AGIs $75k-100k , 0.8% for AGIs $100k-200k , 1.4% for AGIs over 200k ) Net capital gain/loss in AGI: +$4,854 (reported on 20.3% of returns )Here:
+$4,854State:
+$12,740
(% of AGI for various income ranges: 0.3% for AGIs $25k-50k , 0.3% for AGIs $50k-75k , 0.2% for AGIs $75k-100k , 0.7% for AGIs $100k-200k , 3.5% for AGIs over 200k ) Profit/loss from business: +$12,266 (reported on 17.6% of returns )Here:
+$12,266State:
+$10,311
(% of AGI for various income ranges: 8.4% for AGIs below $25k , 3.5% for AGIs $25k-50k , 3.2% for AGIs $50k-75k , 2.6% for AGIs $75k-100k , 2.0% for AGIs $100k-200k , 2.5% for AGIs over 200k ) Taxable individual retirement arrangement distribution: $15,636 (reported on 8.6% of returns )27540:
$15,636North Carolina:
$15,575
(% of AGI for various income ranges: 2.2% for AGIs below $25k , 1.8% for AGIs $25k-50k , 2.2% for AGIs $50k-75k , 1.9% for AGIs $75k-100k , 1.8% for AGIs $100k-200k , 0.9% for AGIs over 200k ) Self-employment retirement plans: $16,822 (reported on 0.7% of returns )27540:
$16,822North Carolina:
$21,078
(% of AGI for various income ranges: 0.2% for AGIs $25k-50k , 0.1% for AGIs $100k-200k , 0.4% for AGIs over 200k ) Total itemized deductions: $23,690 (20% of AGI, reported on 58.5% of returns )Here:
$23,690State:
$23,438
Here:
20.1% of AGIState:
21.5% of AGI
(% of AGI for various income ranges: 12.3% for AGIs below $25k , 16.8% for AGIs $25k-50k , 18.8% for AGIs $50k-75k , 19.5% for AGIs $75k-100k , 18.0% for AGIs $100k-200k , 13.8% for AGIs over 200k ) Charity contributions: $3,177 (reported on 49.2% of returns )(% of AGI for various income ranges: 0.9% for AGIs below $25k , 1.8% for AGIs $25k-50k , 2.1% for AGIs $50k-75k , 2.0% for AGIs $75k-100k , 2.0% for AGIs $100k-200k , 1.8% for AGIs over 200k ) Taxes paid: $9,808 (reported on 58.3% of returns )(% of AGI for various income ranges: 2.3% for AGIs below $25k , 4.1% for AGIs $25k-50k , 6.0% for AGIs $50k-75k , 6.9% for AGIs $75k-100k , 7.9% for AGIs $100k-200k , 7.7% for AGIs over 200k ) Earned income credit: $2,227 (reported on 11.2% of returns )(% of AGI for various income ranges: 6.2% for AGIs below $25k , 1.2% for AGIs $25k-50k ) Percentage of individuals using paid preparers for their 2012 taxes: 41.9%(% for various income ranges: 38.6% for AGIs below $25k , 40.8% for AGIs $25k-50k , 41.1% for AGIs $50k-75k , 39.8% for AGIs $75k-100k , 42.8% for AGIs $100k-200k , 62.8% for AGIs over 200k )
Averages for the 2004 tax year for zip code 27540, filed in 2005:
Average Adjusted Gross Income (AGI) in 2004: $63,500 (Individual Income Tax Returns) Here:
$63,500State:
$45,376
Salary/wage: $60,276 (reported on 92.5% of returns )Here:
$60,276State:
$39,442
(% of AGI for various income ranges: 153.8% for AGIs below $10k , 85.1% for AGIs $10k-25k , 88.1% for AGIs $25k-50k , 89.9% for AGIs $50k-75k , 90.1% for AGIs $75k-100k , 85.2% for AGIs over 100k ) Taxable interest for individuals: $664 (reported on 50.0% of returns )This zip code:
$664North Carolina:
$1,515
(% of AGI for various income ranges: 4.8% for AGIs below $10k , 1.6% for AGIs $10k-25k , 0.5% for AGIs $25k-50k , 0.5% for AGIs $50k-75k , 0.4% for AGIs $75k-100k , 0.4% for AGIs over 100k ) Taxable dividends: $1,476 (reported on 27.0% of returns )(% of AGI for various income ranges: 3.5% for AGIs below $10k , 0.6% for AGIs $10k-25k , 0.7% for AGIs $25k-50k , 0.4% for AGIs $50k-75k , 0.4% for AGIs $75k-100k , 0.8% for AGIs over 100k ) Net capital gain/loss: +$4,477 (reported on 23.2% of returns )Here:
+$4,477State:
+$11,152
(% of AGI for various income ranges: -3.0% for AGIs below $10k , 0.3% for AGIs $10k-25k , 0.3% for AGIs $25k-50k , 0.4% for AGIs $50k-75k , 0.8% for AGIs $75k-100k , 3.1% for AGIs over 100k ) Profit/loss from business: +$10,102 (reported on 16.9% of returns )Here:
+$10,102State:
+$9,490
(% of AGI for various income ranges: 4.8% for AGIs below $10k , 4.1% for AGIs $10k-25k , 3.9% for AGIs $25k-50k , 2.2% for AGIs $50k-75k , 1.9% for AGIs $75k-100k , 2.8% for AGIs over 100k ) IRA payment deduction: $2,732 (reported on 2.6% of returns )27540:
$2,732North Carolina:
$2,967
(% of AGI for various income ranges: 0.2% for AGIs $10k-25k , 0.2% for AGIs $25k-50k , 0.1% for AGIs $50k-75k , 0.1% for AGIs $75k-100k , 0.1% for AGIs over 100k ) Self-employed pension: $14,070 (reported on 0.7% of returns )Here:
$14,070North Carolina:
$14,754
Total itemized deductions: $19,937 (23% of AGI, reported on 61.1% of returns )Here:
$19,937State:
$19,464
Here:
22.6% of AGIState:
22.7% of AGI
(% of AGI for various income ranges: 24.6% for AGIs below $10k , 14.6% for AGIs $10k-25k , 19.8% for AGIs $25k-50k , 20.7% for AGIs $50k-75k , 20.8% for AGIs $75k-100k , 18.0% for AGIs over 100k ) Charity contributions deductions: $2,818 (3% of AGI, reported on 54.1% of returns )Here:
3.1% of AGIState:
4.5% of AGI
(% of AGI for various income ranges: 1.1% for AGIs below $10k , 1.5% for AGIs $10k-25k , 2.3% for AGIs $25k-50k , 2.3% for AGIs $50k-75k , 2.2% for AGIs $75k-100k , 2.6% for AGIs over 100k ) Total tax: $8,716 (reported on 82.1% of returns )(% of AGI for various income ranges: 3.9% for AGIs below $10k , 4.2% for AGIs $10k-25k , 6.3% for AGIs $25k-50k , 7.9% for AGIs $50k-75k , 9.2% for AGIs $75k-100k , 15.7% for AGIs over 100k ) Earned income credit: $1,762 (reported on 10.0% of returns )Percentage of individuals using paid preparers for their 2004 taxes: 45.8%(% for various income ranges: 40.1% for AGIs below $10k , 50.2% for AGIs $10k-25k , 48.0% for AGIs $25k-50k , 44.0% for AGIs $50k-75k , 42.5% for AGIs $75k-100k , 48.5% for AGIs over 100k )
Estimated median household income in 2022: This zip code:
$123,478North Carolina:
$67,481
Nearest zip codes: 27526 ,
27539 ,
27562 ,
27502 ,
27518 ,
27523 .
Holly Springs Zip Code Map
Percentage of family households: This zip code:
67.8%North Carolina:
46.1%
Percentage of households with unmarried partners: This zip code:
4.7%North Carolina:
47.9%
Likely homosexual households (counted as self-reported same-sex unmarried-partner households)
Lesbian couples: 0.0% of all households Gay men: 0.0% of all households
Household received Food Stamps/SNAP in the past 12 months: 492Household did not receive Food Stamps/SNAP in the past 12 months: 14,779
Women who had a birth in the past 12 months: 459 (452 now married , 18 unmarried) Women who did not have a birth in the past 12 months: 10,901 (7,049 now married , 3,900 unmarried)
Housing units in zip code 27540 with a mortgage: 10,483 (902
second mortgage , 29
home equity loan , 797
both second mortgage and home equity loan )
Houses without a mortgage: 41
Median monthly owner costs for units with a mortgage: $2,130
Median monthly owner costs for units without a mortgage: $630
Residents with income below the poverty level in 2022:
This zip code:
4.8%Whole state:
12.8%
Residents with income below 50% of the poverty level in 2022:
This zip code:
2.1%Whole state:
6.8%
Median number of rooms in houses and condos: Median number of rooms in apartments: Notable locations in this zip code not listed on our city pages
Click to draw/clear zip code borders Notable location: (A) . Display/hide its location on the map
Churches in zip code 27540 include: (A) , Macedonia Church (B) , Collins Grove Church (C) , Sweet Springs Church (D) . Display/hide their locations on the map
Cemetery: (1) . Display/hide its location on the map
Reservoirs: (A) , Evans Pond (B) , Capitol Kiwanis Club Pond (C) , Bass Lake (D) . Display/hide their locations on the map
Streams, rivers, and creeks: (A) , Big Branch (B) , Basal Creek (C) , Rocky Branch (D) , Norris Branch (E) , Little Branch (F) , Horse Branch (G) . Display/hide their locations on the map
Year house built (houses)
809 2020 or later6,178 2010 to 20195,784 2000 to 20092,981 1990 to 1999513 1980 to 1989214 1970 to 197925 1960 to 1969245 1950 to 195982 1940 to 1949130 1939 or earlier
Zip code 27540 household income distribution in 2022 370 Less than $10,000108 $10,000 to $14,999209 $15,000 to $19,999231 $20,000 to $24,999242 $25,000 to $29,999168 $30,000 to $34,999255 $35,000 to $39,999312 $40,000 to $44,999263 $45,000 to $49,999496 $50,000 to $59,9991,115 $60,000 to $74,9991,720 $75,000 to $99,9992,401 $100,000 to $124,9991,899 $125,000 to $149,9992,662 $150,000 to $199,9993,178 $200,000 or moreEstimate of home value of owner-occupied houses/condos in 2022 in zip code 27540 36 Less than $10,00025 $15,000 to $19,9998 $30,000 to $34,99910 $35,000 to $39,99913 $40,000 to $49,9996 $60,000 to $69,99982 $70,000 to $79,99913 $80,000 to $89,99927 $90,000 to $99,99921 $100,000 to $124,99919 $125,000 to $149,999120 $150,000 to $174,999115 $175,000 to $199,999512 $200,000 to $249,9991,305 $250,000 to $299,9993,042 $300,000 to $399,9993,966 $400,000 to $499,9995,165 $500,000 to $749,9991,038 $750,000 to $999,999262 $1,000,000 to $1,499,99942 $1,500,000 to $1,999,99932 $2,000,000 or moreRent paid by renters in 2022 in zip code 27540 21 $100 to $14930 $150 to $19966 $250 to $29931 $300 to $34928 $450 to $49914 $500 to $54914 $550 to $59930 $650 to $69923 $700 to $74932 $750 to $79934 $800 to $89950 $900 to $999291 $1,000 to $1,249583 $1,250 to $1,4991,050 $1,500 to $1,999463 $2,000 to $2,49976 $2,500 to $2,99976 No cash rent
Median gross rent in 2022: $1,702.
Median price asked for vacant for-sale houses and condos in 2022: $475,239.
Estimated median house (or condo) value in 2022 for: White Non-Hispanic householders: $574,333Black or African American householders: $386,683American Indian or Alaska Native householders: $484,992Asian householders: $443,599Some other race householders: $482,923Two or more races householders: $575,023Hispanic or Latino householders: $474,299Estimated median house or condo value in 2022: $528,111
27540:
$528,111North Carolina:
$280,600
Lower value quartile - upper value quartile: $386,899 - $692,704
Mean price in 2022: Detached houses: $400,542Here:
$400,542State:
$375,326
Townhouses or other attached units: $141,311Here:
$141,311State:
$317,935
Mobile homes: $376,942Here:
$376,942State:
$124,933
Housing units in structures:
One, detached: 13,021One, attached: 1,3423 or 4: 425 to 9: 20610 to 19: 55920 to 49: 48350 or more: 226Mobile homes: 341Unemployment : 2.4%
Means of transportation to work in zip code 27540 64.8% 14,988 Drove a car alone6.0% 1,392 Carpooled0.1% 14 Bicycle1.6% 371 Walked0.8% 179 Other means31.3% 7,239 Worked at homeTravel time to work (commute) in zip code 27540 326 Less than 5 minutes1,245 5 to 9 minutes1,277 10 to 14 minutes1,322 15 to 19 minutes2,200 20 to 24 minutes1,869 25 to 29 minutes3,253 30 to 34 minutes1,339 35 to 39 minutes1,086 40 to 44 minutes1,863 45 to 59 minutes868 60 to 89 minutes250 90 or more minutes
Neighborhoods in zip code 27540: Percentage of zip code residents living and working in this county: 86.7%
Household type by relationship:
Households: 45,822
Male householders: 7,998 (891 living alone ), Female householders: 7,408 (1,368 living alone )10,962 spouses (10,934 opposite-sex spouses ), 819 unmarried partners , (819 opposite-sex unmarried partners ), 17,000 children (15,997 natural , 455 adopted , 541 stepchildren ), 205 grandchildren , 206 brothers or sisters , 471 parents , 0 foster children , 381 other relatives , 354 non-relatives In group quarters: 41 (-1 institutionalized population )
Size of family households: 4,176 2-persons , 2,882 3-persons , 3,571 4-persons , 1,173 5-persons , 681 6-persons , 155 7-or-more-persons
Size of nonfamily households: 2,257 1-person , 409 2-persons , 42 3-persons , 5 4-persons
11,767 married couples with children. single-parent households (1,271 men , 1,329 women ).
87.2% of residents of 27540 zip code speak English at home. of residents speak Spanish at home (73% very well, 16% well, 10% not well ).of residents speak other Indo-European language at home (89% very well, 8% well, 3% not well ).of residents speak Asian or Pacific Island language at home (79% very well, 14% well, 7% not well ).of residents speak other language at home (65% very well, 18% well, 11% not well, 6% not at all ).
Foreign born population: 3,990 (8.7%)
(64.0%
of them are naturalized citizens )
This zip code:
8.7%Whole state:
8.6%
30% Bhutan 11% Japan 10% Honduras 5% Sweden 4% Chile 3% Haiti 3% Thailand 13% English 10% American 8% German 8% Irish 7% Italian 3% European 1% Scottish
Year of entry for the foreign-born population
1,128 2010 or later 924 2000 to 2009 1,195 1990 to 1999 1,210 Before 1990
Facilities with environmental interests located in this zip code:
APEX ELEMENTARY (900 HOLLY SPRINGS ROAD in HOLLY SPRINGS, NC)
(National Center for Education Statistics) - STATE ID-308 Organizations: WAKE COUNTY SCHOOLS (SCHOOL DISTRICT)
BUCKHORN RIDGE SUBDIVISION (NCSR 1119 in HOLLY SPRINGS, NC)
National Pollutant Discharge Elimination System NON-MAJOR (Tracking pollutant discharge elimination systems) - permit Business SIC classification: SEWERAGE SYSTEMSAlternative names: BILL CLARK HOMES OF RALEIGH LL, COUNTRY LAKE ESTATES ASSOC.
AUTUM PARK - BEAZER HOMES (AVENT FARRY ROAD in HOLLY SPRINGS, NC)
FORMAL ENFORCEMENT ACTION (Integrated Compliance Information System)
Housing units lacking complete plumbing facilities: 0.7%
Housing units lacking complete kitchen facilities: 0.2%
55.6% Utility gas 41.3% Electricity 1.8% Bottled, tank, or LP gas 0.8% Fuel oil, kerosene, etc.
Population in 1990: 2,282. Population change in the 1990s: +10,085 (+441.9%).
Place of birth for U.S.-born residents:
This state: 16,864Northeast: 8,559Midwest: 5,865South: 7,721West: 2,642
33% of the 27540 zip code residents lived in the same house 5 years ago.
Out of people who lived in different houses, 42% lived in this county.
Out of people who lived in different counties, 50% lived in North Carolina.
88% of the 27540 zip code residents lived in the same house 1 year ago.
Out of people who lived in different houses, 49% moved from this county.
Out of people who lived in different houses, 25% moved from different county within same state.
Out of people who lived in different houses, 17% moved from different state.
Out of people who lived in different houses, 5% moved from abroad.
Private vs. public school enrollment:
Students in private schools in grades 1 to 8 (elementary and middle school): 305
Here:
4.3%North Carolina:
13.8%
Students in private schools in grades 9 to 12 (high school): 286
Here:
8.5%North Carolina:
11.9%
Students in private undergraduate colleges: 203
Here:
12.6%North Carolina:
19.3%
Occupation by median earnings in the past 12 months ($)
117,724 Life, physical, and social science occupations 114,467 Law enforcement workers including supervisors 106,496 Computer and mathematical occupations 105,479 Legal occupations 105,473 Management occupations 102,564 Architecture and engineering occupations
Companies with federal contracts located in this zip code:
GAS SYSTEMS MANAGEMENT, INC (201 HOLLY PARKDRIVE in HOLLY SPRINGS, NC; small business) in 17 contracts from 1999 to 2003
Contracts for Maintenance, Repair or Alteration of Real Property -- Hospitals and Infirmaries by Navy, Department of Veterans AffairsSigned by year: 2000: $0; 2001: $384,566; 2002: $371,425; 2003: -$32,918; 2004: $0; 2005: $0; 2006: $0.
Biggest contracts: with Navy for Maintenance, Repair or Alteration of Real Property -- Hospitals and Infirmaries. Signed on 2002-10-29. Completion date: 2001-09-30.
, same as above. Signed on 2001-10-31. Completion date: 2001-09-30.
, same as above. Signed on 2001-03-07. Completion date: 2001-09-30.
, same as above. Signed on 2002-09-11. Completion date: 2001-09-30.
MCH SYSTEMS INC (108 THOMAS MILL RD # 104 in HOLLY SPRINGS, NC; small business)
$7,026 with Navy for Mini and Micro Computer Control Devices. Signed on 2005-09-12. Completion date: 2006-03-17.
Top industries in this zip code by the number of employees in 2005:
Professional, Scientific, and Technical Services: Research and Development in the Physical, Engineering, and Life Sciences (250-499 employees: 1 establishment, 1-4 employees: 1 establishment)Administrative and Support and Waste Management and Remediation Services: Landscaping Services (100-249: 1, 50-99: 2, 1-4: 4)Accommodation and Food Services: Full-Service Restaurants (50-99: 1, 20-49: 3, 5-9: 1, 1-4: 4)Administrative and Support and Waste Management and Remediation Services: Janitorial Services (20-49: 2, 5-9: 3, 1-4: 3)Construction: Roofing Contractors (20-49: 2, 10-19: 1, 5-9: 1)Construction: Poured Concrete Foundation and Structure Contractors (50-99: 1, 10-19: 1)
People in group quarters in 2010:
14 people in group homes intended for adults
People in group quarters in 2000:
8 people in nursing homes
Fatal accident statistics in 2014:
Fatal accident count: 4Vehicles involved in fatal accidents: 7Fatal accidents caused by drunken drivers: 1Fatalities: 4Persons involved in fatal accidents: 8Pedestrians involved in fatal accidents: 1
Fatal accident statistics in 2013:
Fatal accident count: 1Vehicles involved in fatal accidents: 2Fatal accidents caused by drunken drivers: 0Fatalities: 1Persons involved in fatal accidents: 2Pedestrians involved in fatal accidents: 0
Home Mortgage Disclosure Act Aggregated Statistics For Year 2009(Based on 4 partial tracts) A) FHA, FSA/RHS & VA B) Conventional C) Refinancings D) Home Improvement Loans F) Non-occupant Loans on G) Loans On Manufactured Number Average Value Number Average Value Number Average Value Number Average Value Number Average Value Number Average Value
LOANS ORIGINATED 281 $205,691 421 $235,844 2,048 $222,798 30 $122,478 82 $183,940 8 $73,788 APPLICATIONS APPROVED, NOT ACCEPTED 15 $209,679 16 $258,416 118 $230,338 2 $15,170 3 $184,013 0 $0 APPLICATIONS DENIED 24 $187,446 28 $196,632 391 $222,834 26 $63,905 25 $168,270 8 $90,316 APPLICATIONS WITHDRAWN 28 $212,530 58 $240,161 351 $222,219 7 $119,564 22 $158,983 0 $0 FILES CLOSED FOR INCOMPLETENESS 5 $201,562 6 $238,825 83 $222,546 6 $66,063 3 $203,293 0 $0
Aggregated Statistics For Year 2008(Based on 4 partial tracts) A) FHA, FSA/RHS & VA B) Conventional C) Refinancings D) Home Improvement Loans E) Loans on Dwellings For 5+ Families F) Non-occupant Loans on G) Loans On Manufactured Number Average Value Number Average Value Number Average Value Number Average Value Number Average Value Number Average Value Number Average Value
LOANS ORIGINATED 178 $204,757 771 $226,465 939 $204,651 57 $74,970 1 $13,458,620 102 $171,625 13 $73,475 APPLICATIONS APPROVED, NOT ACCEPTED 9 $236,140 64 $245,899 122 $202,844 7 $28,694 0 $0 9 $229,313 4 $75,780 APPLICATIONS DENIED 21 $205,955 66 $213,249 403 $191,671 62 $107,386 0 $0 16 $128,839 16 $83,459 APPLICATIONS WITHDRAWN 19 $218,365 95 $226,064 246 $213,793 23 $178,297 1 $10,446,220 12 $210,478 1 $71,180 FILES CLOSED FOR INCOMPLETENESS 5 $162,066 18 $290,854 52 $210,944 2 $82,160 0 $0 3 $152,823 0 $0
Aggregated Statistics For Year 2007(Based on 4 partial tracts) A) FHA, FSA/RHS & VA B) Conventional C) Refinancings D) Home Improvement Loans E) Loans on Dwellings For 5+ Families F) Non-occupant Loans on G) Loans On Manufactured Number Average Value Number Average Value Number Average Value Number Average Value Number Average Value Number Average Value Number Average Value
LOANS ORIGINATED 81 $201,554 1,561 $186,153 793 $162,974 91 $68,813 1 $680,480 193 $153,923 15 $67,101 APPLICATIONS APPROVED, NOT ACCEPTED 4 $176,352 157 $188,964 151 $156,560 23 $48,504 0 $0 22 $140,479 3 $40,063 APPLICATIONS DENIED 12 $215,728 153 $198,907 456 $156,541 90 $88,603 0 $0 43 $156,957 12 $75,056 APPLICATIONS WITHDRAWN 5 $209,288 169 $178,795 210 $179,339 20 $114,326 0 $0 24 $169,535 3 $68,823 FILES CLOSED FOR INCOMPLETENESS 2 $233,490 29 $226,022 63 $214,454 1 $248,380 0 $0 2 $135,225 1 $102,070
Aggregated Statistics For Year 2006(Based on 4 partial tracts) A) FHA, FSA/RHS & VA B) Conventional C) Refinancings D) Home Improvement Loans F) Non-occupant Loans on G) Loans On Manufactured Number Average Value Number Average Value Number Average Value Number Average Value Number Average Value Number Average Value
LOANS ORIGINATED 90 $171,380 1,929 $166,117 788 $142,995 91 $63,450 279 $141,434 20 $104,760 APPLICATIONS APPROVED, NOT ACCEPTED 4 $211,800 151 $164,992 151 $133,007 20 $41,218 29 $133,415 3 $66,770 APPLICATIONS DENIED 11 $176,101 201 $151,289 376 $147,949 78 $60,455 50 $153,637 17 $58,213 APPLICATIONS WITHDRAWN 14 $168,266 210 $156,160 190 $168,357 19 $98,243 24 $137,568 3 $93,787 FILES CLOSED FOR INCOMPLETENESS 1 $172,670 26 $146,227 79 $188,104 2 $51,750 6 $128,788 0 $0
Aggregated Statistics For Year 2005(Based on 4 partial tracts) A) FHA, FSA/RHS & VA B) Conventional C) Refinancings D) Home Improvement Loans F) Non-occupant Loans on G) Loans On Manufactured Number Average Value Number Average Value Number Average Value Number Average Value Number Average Value Number Average Value
LOANS ORIGINATED 89 $159,251 1,675 $161,321 738 $165,254 72 $73,385 180 $130,324 16 $59,486 APPLICATIONS APPROVED, NOT ACCEPTED 8 $136,452 113 $154,778 105 $140,709 14 $57,334 10 $176,603 6 $57,148 APPLICATIONS DENIED 10 $133,863 161 $139,641 376 $145,006 94 $64,138 38 $134,984 23 $47,844 APPLICATIONS WITHDRAWN 7 $145,004 223 $155,088 216 $163,874 28 $113,854 14 $134,749 6 $67,247 FILES CLOSED FOR INCOMPLETENESS 1 $123,340 21 $188,045 96 $176,126 3 $172,673 5 $139,070 0 $0
Aggregated Statistics For Year 2004(Based on 4 partial tracts) A) FHA, FSA/RHS & VA B) Conventional C) Refinancings D) Home Improvement Loans E) Loans on Dwellings For 5+ Families F) Non-occupant Loans on G) Loans On Manufactured Number Average Value Number Average Value Number Average Value Number Average Value Number Average Value Number Average Value Number Average Value
LOANS ORIGINATED 140 $147,651 1,274 $166,297 795 $162,586 50 $65,094 1 $85,060 111 $124,773 14 $82,174 APPLICATIONS APPROVED, NOT ACCEPTED 6 $158,250 90 $149,785 104 $152,292 9 $48,424 0 $0 5 $116,434 8 $72,320 APPLICATIONS DENIED 19 $153,778 117 $141,209 348 $139,942 62 $55,363 0 $0 25 $91,740 29 $76,657 APPLICATIONS WITHDRAWN 14 $152,410 150 $148,161 187 $152,296 8 $87,574 0 $0 16 $96,129 7 $79,867 FILES CLOSED FOR INCOMPLETENESS 4 $122,940 15 $193,115 54 $172,686 6 $75,732 0 $0 5 $148,898 0 $0
Aggregated Statistics For Year 2003(Based on 4 partial tracts) A) FHA, FSA/RHS & VA B) Conventional C) Refinancings D) Home Improvement Loans F) Non-occupant Loans on Number Average Value Number Average Value Number Average Value Number Average Value Number Average Value
LOANS ORIGINATED 148 $144,360 766 $166,686 2,207 $160,635 31 $31,092 84 $123,812 APPLICATIONS APPROVED, NOT ACCEPTED 2 $136,660 43 $147,713 196 $168,679 5 $51,868 5 $83,666 APPLICATIONS DENIED 8 $142,062 78 $121,378 408 $140,350 23 $36,435 13 $115,782 APPLICATIONS WITHDRAWN 14 $131,051 51 $144,913 258 $157,094 5 $39,808 12 $118,260 FILES CLOSED FOR INCOMPLETENESS 3 $109,773 8 $142,264 64 $161,577 2 $23,030 4 $109,302
Aggregated Statistics For Year 2002(Based on 4 partial tracts) A) FHA, FSA/RHS & VA B) Conventional C) Refinancings D) Home Improvement Loans E) Loans on Dwellings For 5+ Families F) Non-occupant Loans on Number Average Value Number Average Value Number Average Value Number Average Value Number Average Value Number Average Value
LOANS ORIGINATED 184 $132,776 604 $157,354 1,479 $160,847 33 $25,848 1 $95,270 49 $98,430 APPLICATIONS APPROVED, NOT ACCEPTED 8 $151,148 54 $127,708 147 $139,422 5 $33,140 0 $0 3 $94,497 APPLICATIONS DENIED 8 $141,361 82 $103,572 239 $116,573 34 $28,427 0 $0 13 $114,868 APPLICATIONS WITHDRAWN 20 $138,328 47 $145,884 167 $136,734 9 $32,647 0 $0 7 $80,929 FILES CLOSED FOR INCOMPLETENESS 5 $169,042 13 $160,792 50 $133,920 2 $15,810 0 $0 2 $134,300
Aggregated Statistics For Year 2001(Based on 4 partial tracts) A) FHA, FSA/RHS & VA B) Conventional C) Refinancings D) Home Improvement Loans F) Non-occupant Loans on Number Average Value Number Average Value Number Average Value Number Average Value Number Average Value
LOANS ORIGINATED 282 $135,598 771 $147,044 1,036 $149,982 51 $36,537 60 $106,625 APPLICATIONS APPROVED, NOT ACCEPTED 16 $147,087 74 $105,869 97 $140,304 10 $29,360 2 $91,555 APPLICATIONS DENIED 17 $129,039 112 $76,132 213 $105,480 25 $23,600 14 $71,634 APPLICATIONS WITHDRAWN 13 $132,303 60 $169,093 134 $119,213 10 $23,229 3 $177,503 FILES CLOSED FOR INCOMPLETENESS 1 $68,900 12 $160,726 33 $160,105 0 $0 0 $0
Aggregated Statistics For Year 2000(Based on 4 partial tracts) A) FHA, FSA/RHS & VA B) Conventional C) Refinancings D) Home Improvement Loans F) Non-occupant Loans on Number Average Value Number Average Value Number Average Value Number Average Value Number Average Value
LOANS ORIGINATED 240 $129,292 778 $142,328 209 $119,800 58 $27,577 36 $88,305 APPLICATIONS APPROVED, NOT ACCEPTED 20 $85,161 74 $88,969 50 $119,714 14 $20,730 3 $110,800 APPLICATIONS DENIED 26 $94,842 159 $82,821 163 $87,652 39 $24,115 7 $69,713 APPLICATIONS WITHDRAWN 19 $131,192 55 $126,952 86 $88,465 10 $39,109 4 $98,092 FILES CLOSED FOR INCOMPLETENESS 1 $150,870 16 $157,780 25 $121,056 3 $17,580 5 $149,214
Aggregated Statistics For Year 1999(Based on 2 partial tracts) A) FHA, FSA/RHS & VA B) Conventional C) Refinancings D) Home Improvement Loans F) Non-occupant Loans on Number Average Value Number Average Value Number Average Value Number Average Value Number Average Value
LOANS ORIGINATED 105 $130,265 371 $141,196 231 $123,797 26 $38,307 24 $93,410 APPLICATIONS APPROVED, NOT ACCEPTED 1 $102,440 37 $81,444 38 $82,565 5 $15,652 6 $73,123 APPLICATIONS DENIED 4 $139,792 95 $67,931 90 $93,111 14 $22,182 6 $80,328 APPLICATIONS WITHDRAWN 7 $128,144 29 $124,959 63 $103,287 3 $36,123 3 $83,117 FILES CLOSED FOR INCOMPLETENESS 2 $92,605 7 $164,574 21 $99,934 0 $0 0 $0
Detailed HMDA statistics for the following Tracts:
0532.00
,
0534.04
Private Mortgage Insurance Companies Aggregated Statistics For Year 2009(Based on 4 partial tracts) A) Conventional B) Refinancings C) Non-occupant Loans on Number Average Value Number Average Value Number Average Value
LOANS ORIGINATED 83 $268,336 103 $250,659 4 $214,828 APPLICATIONS APPROVED, NOT ACCEPTED 14 $263,661 29 $225,309 3 $151,407 APPLICATIONS DENIED 5 $271,506 20 $241,986 0 $0 APPLICATIONS WITHDRAWN 1 $136,950 12 $234,112 1 $242,420 FILES CLOSED FOR INCOMPLETENESS 1 $586,910 0 $0 0 $0
Aggregated Statistics For Year 2008(Based on 4 partial tracts) A) Conventional B) Refinancings C) Non-occupant Loans on Number Average Value Number Average Value Number Average Value
LOANS ORIGINATED 230 $248,874 112 $224,392 17 $199,060 APPLICATIONS APPROVED, NOT ACCEPTED 52 $247,446 33 $239,419 7 $194,820 APPLICATIONS DENIED 9 $220,748 8 $220,400 3 $181,577 APPLICATIONS WITHDRAWN 10 $273,977 3 $214,633 1 $298,560 FILES CLOSED FOR INCOMPLETENESS 7 $250,953 1 $181,180 5 $187,848
Aggregated Statistics For Year 2007(Based on 4 partial tracts) A) Conventional B) Refinancings C) Non-occupant Loans on Number Average Value Number Average Value Number Average Value
LOANS ORIGINATED 356 $212,443 97 $204,145 36 $184,592 APPLICATIONS APPROVED, NOT ACCEPTED 27 $231,912 17 $244,632 1 $172,960 APPLICATIONS DENIED 12 $213,348 2 $142,050 5 $197,050 APPLICATIONS WITHDRAWN 11 $219,587 6 $190,970 2 $231,955 FILES CLOSED FOR INCOMPLETENESS 1 $207,550 1 $166,720 1 $207,550
Aggregated Statistics For Year 2006(Based on 4 partial tracts) A) Conventional B) Refinancings C) Non-occupant Loans on D) Loans On Manufactured Number Average Value Number Average Value Number Average Value Number Average Value
LOANS ORIGINATED 178 $194,304 51 $194,941 16 $205,520 1 $104,620 APPLICATIONS APPROVED, NOT ACCEPTED 14 $224,498 13 $195,204 3 $273,610 0 $0 APPLICATIONS DENIED 7 $263,929 0 $0 1 $186,280 0 $0 APPLICATIONS WITHDRAWN 6 $160,622 1 $150,840 0 $0 0 $0 FILES CLOSED FOR INCOMPLETENESS 0 $0 1 $153,960 0 $0 0 $0
Aggregated Statistics For Year 2005(Based on 4 partial tracts) A) Conventional B) Refinancings C) Non-occupant Loans on Number Average Value Number Average Value Number Average Value
LOANS ORIGINATED 138 $192,672 53 $172,218 15 $140,714 APPLICATIONS APPROVED, NOT ACCEPTED 17 $189,191 10 $191,001 3 $125,890 APPLICATIONS DENIED 1 $394,680 1 $173,520 0 $0 APPLICATIONS WITHDRAWN 2 $162,890 1 $220,300 1 $136,950 FILES CLOSED FOR INCOMPLETENESS 2 $102,925 0 $0 0 $0
Aggregated Statistics For Year 2004(Based on 4 partial tracts) A) Conventional B) Refinancings C) Non-occupant Loans on D) Loans On Manufactured Number Average Value Number Average Value Number Average Value Number Average Value
LOANS ORIGINATED 110 $181,885 60 $160,981 11 $143,625 0 $0 APPLICATIONS APPROVED, NOT ACCEPTED 14 $227,484 17 $174,449 1 $114,830 1 $119,080 APPLICATIONS DENIED 3 $134,337 1 $193,090 1 $193,090 0 $0 APPLICATIONS WITHDRAWN 11 $248,470 6 $167,405 2 $260,260 0 $0 FILES CLOSED FOR INCOMPLETENESS 2 $147,695 0 $0 0 $0 0 $0
Aggregated Statistics For Year 2003(Based on 4 partial tracts) A) Conventional B) Refinancings C) Non-occupant Loans on Number Average Value Number Average Value Number Average Value
LOANS ORIGINATED 130 $172,714 259 $161,607 14 $123,214 APPLICATIONS APPROVED, NOT ACCEPTED 15 $216,323 55 $168,685 2 $87,690 APPLICATIONS DENIED 0 $0 3 $128,780 0 $0 APPLICATIONS WITHDRAWN 3 $145,970 10 $142,228 0 $0 FILES CLOSED FOR INCOMPLETENESS 0 $0 0 $0 0 $0
Aggregated Statistics For Year 2002(Based on 4 partial tracts) A) Conventional B) Refinancings C) Non-occupant Loans on Number Average Value Number Average Value Number Average Value
LOANS ORIGINATED 163 $171,315 207 $158,339 11 $122,740 APPLICATIONS APPROVED, NOT ACCEPTED 15 $215,539 33 $148,235 2 $93,140 APPLICATIONS DENIED 1 $140,350 7 $152,419 0 $0 APPLICATIONS WITHDRAWN 6 $210,393 13 $146,590 1 $114,830 FILES CLOSED FOR INCOMPLETENESS 1 $161,300 2 $163,220 0 $0
Aggregated Statistics For Year 2001(Based on 4 partial tracts) A) Conventional B) Refinancings C) Non-occupant Loans on Number Average Value Number Average Value Number Average Value
LOANS ORIGINATED 183 $166,414 134 $159,222 11 $121,032 APPLICATIONS APPROVED, NOT ACCEPTED 19 $170,182 16 $165,254 3 $121,920 APPLICATIONS DENIED 3 $150,327 7 $178,423 2 $149,705 APPLICATIONS WITHDRAWN 1 $303,170 5 $182,878 0 $0 FILES CLOSED FOR INCOMPLETENESS 1 $146,760 2 $109,740 0 $0
Aggregated Statistics For Year 2000(Based on 4 partial tracts) A) Conventional B) Refinancings C) Non-occupant Loans on Number Average Value Number Average Value Number Average Value
LOANS ORIGINATED 194 $159,290 15 $136,863 3 $97,253 APPLICATIONS APPROVED, NOT ACCEPTED 20 $150,376 5 $141,042 1 $85,560 APPLICATIONS DENIED 3 $193,653 2 $206,795 0 $0 APPLICATIONS WITHDRAWN 3 $124,933 2 $156,245 0 $0 FILES CLOSED FOR INCOMPLETENESS 0 $0 0 $0 0 $0
Aggregated Statistics For Year 1999(Based on 2 partial tracts) A) Conventional B) Refinancings C) Non-occupant Loans on Number Average Value Number Average Value Number Average Value
LOANS ORIGINATED 100 $163,433 35 $138,928 1 $163,410 APPLICATIONS APPROVED, NOT ACCEPTED 9 $148,898 5 $117,278 0 $0 APPLICATIONS DENIED 2 $177,465 2 $130,595 0 $0 APPLICATIONS WITHDRAWN 4 $144,325 0 $0 0 $0 FILES CLOSED FOR INCOMPLETENESS 2 $134,715 0 $0 0 $0
Detailed PMIC statistics for the following Tracts:
0532.00
,
0534.04
2002 - 2018 National Fire Incident Reporting System (NFIRS) incidents See full 2006 National Fire Incident Reporting System statistics for zip code 27540, North Carolina
Most common first names in zip code 27540 among deceased individuals Name Count Lived (average)
James 33 69.0 years John 30 71.1 years William 27 74.3 years Mary 25 75.6 years Robert 16 70.8 years Ruth 11 78.0 years Willie 11 71.5 years Helen 10 79.5 years Joseph 10 71.2 years Annie 10 82.5 years
Most common last names in zip code 27540 among deceased individuals Last name Count Lived (average)
Judd 24 72.8 years Jones 21 69.9 years Utley 20 67.7 years Johnson 19 74.0 years Williams 17 65.3 years Smith 17 77.8 years Betts 15 78.8 years Baker 15 71.9 years Adams 13 66.3 years Holleman 12 76.4 years
Businesses in zip code 27540
Name Count Name Count
AT&T 1 Little Caesars Pizza 1 Advance Auto Parts 1 McDonald's 1 Blockbuster 1 Quiznos 1 Burger King 1 Rite Aid 1 CVS 1 SONIC Drive-In 1 Chick-Fil-A 1 Sprint Nextel 1 Curves 1 Starbucks 1 Domino's Pizza 1 Subway 3 FedEx 5 T-Mobile 1 Firestone Complete Auto Care 1 Taco Bell 1 GameStop 1 U-Haul 1 Goodwill 1 UPS 3 H&R Block 1 Walgreens 2 Hilton 1 Walmart 1 Just Tires 1 Wendy's 1 KFC 1
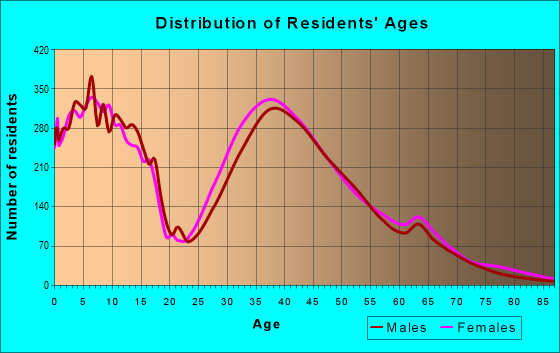
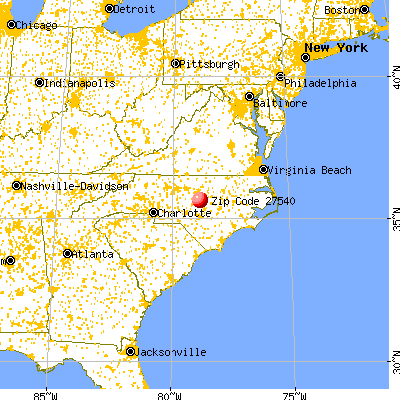


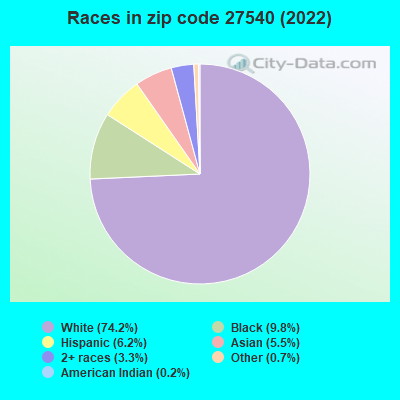


 Nearest zip codes: 27526, 27539, 27562, 27502, 27518, 27523.
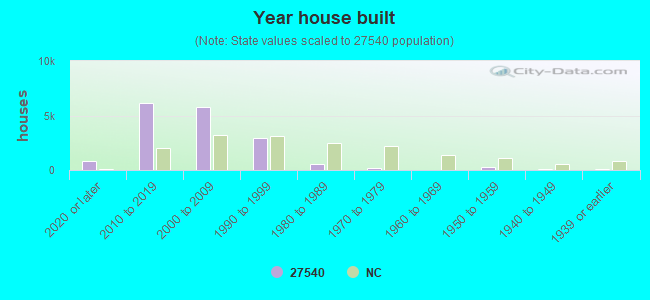
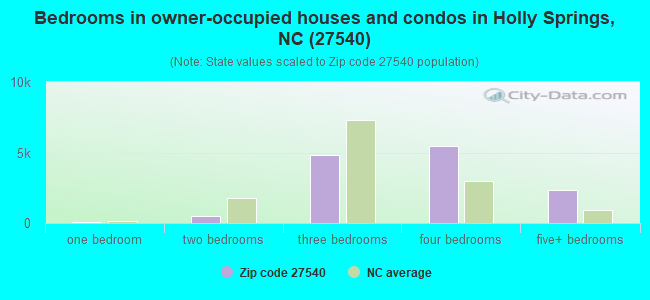
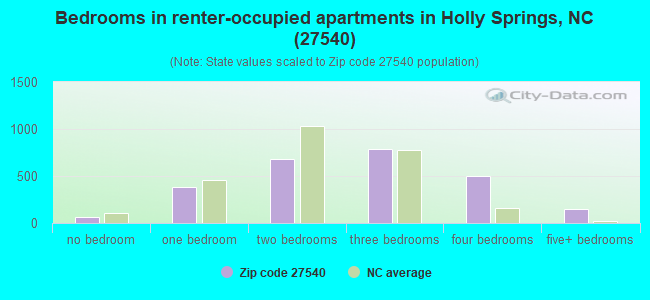
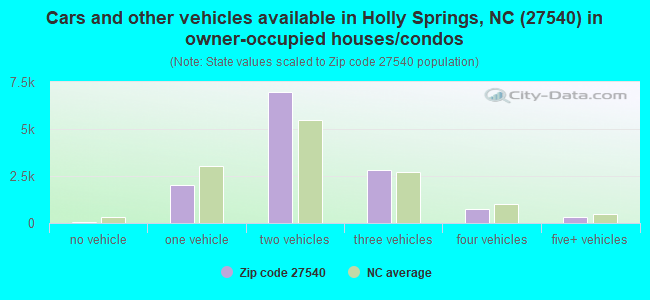
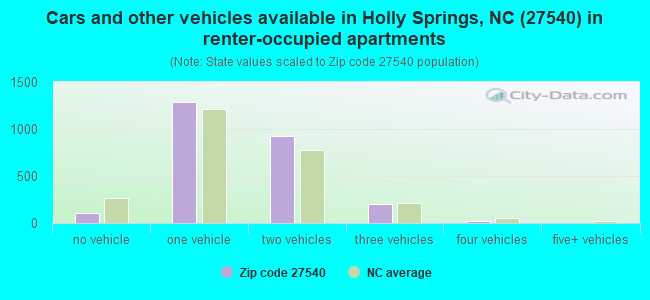


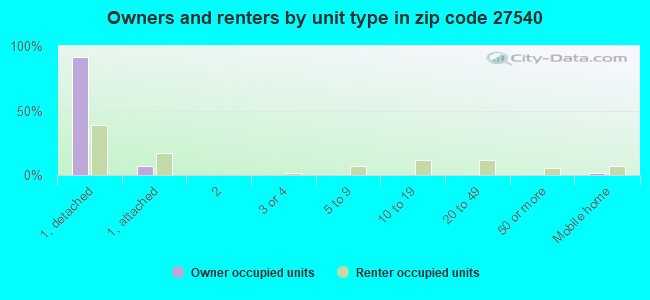
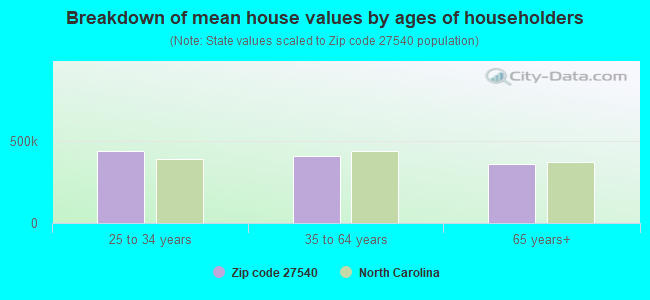


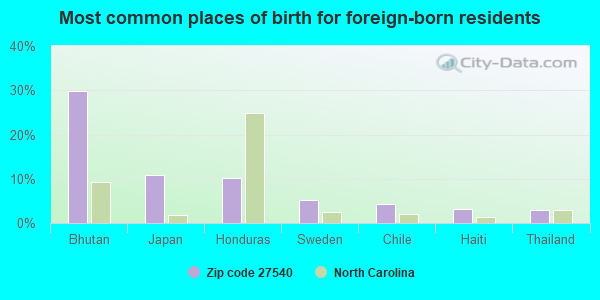
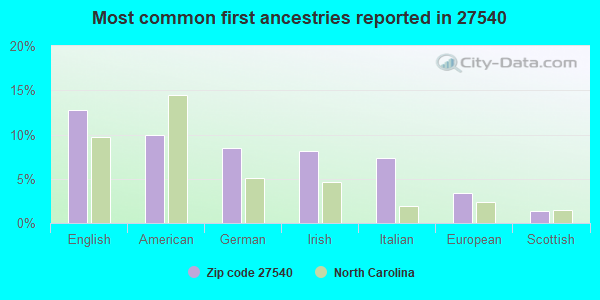
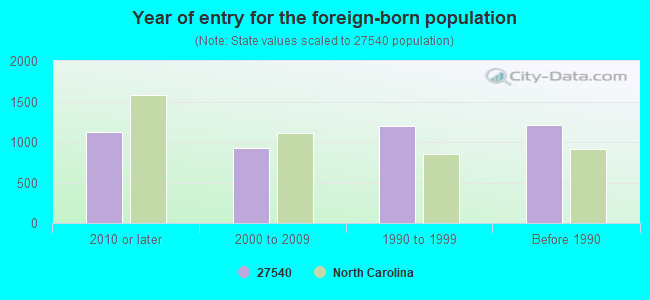
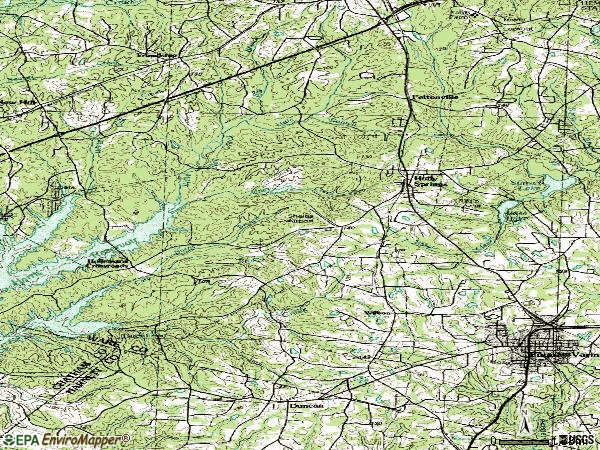

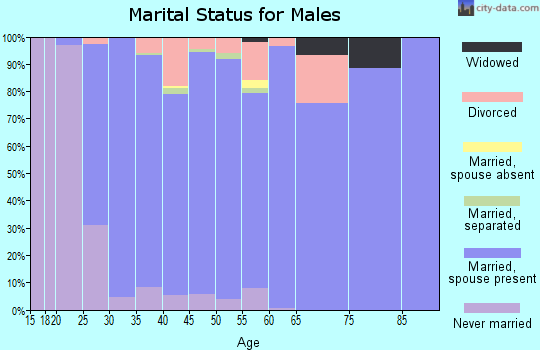

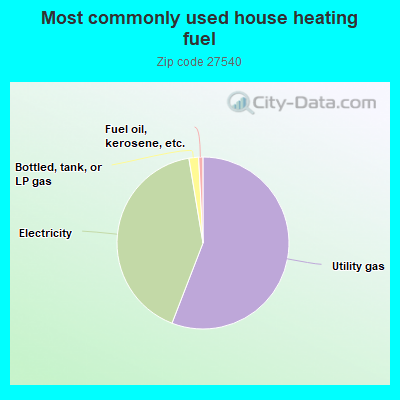
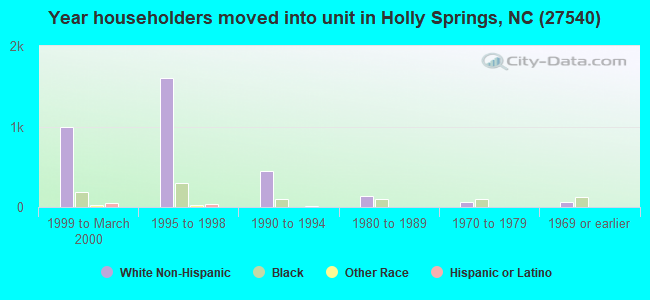
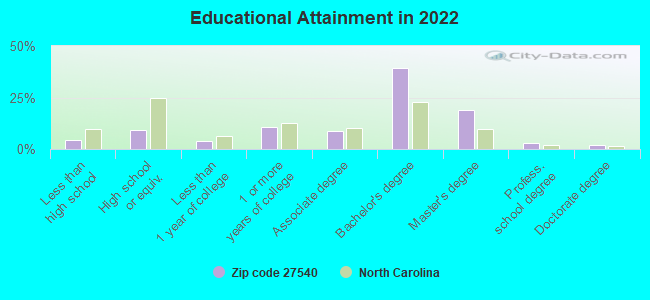
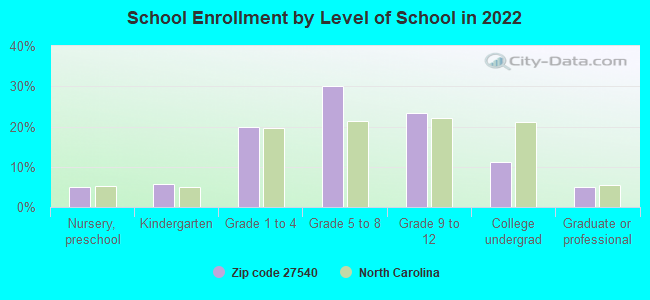
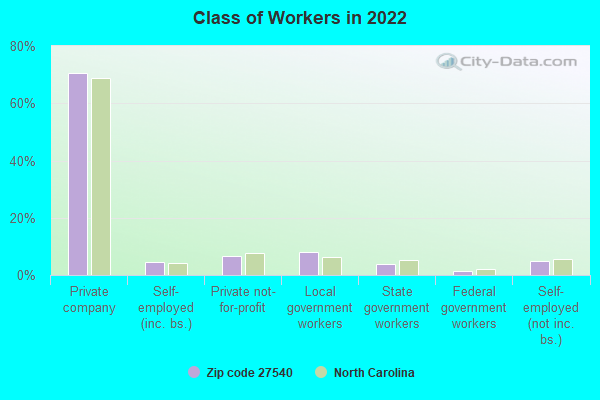
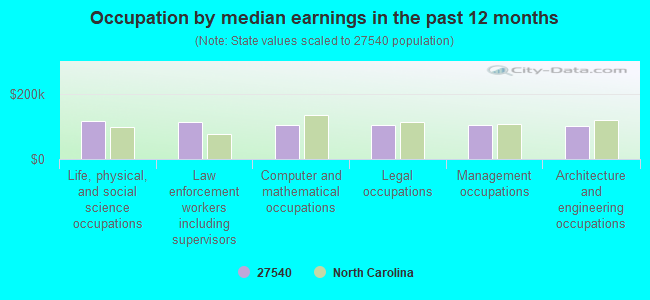
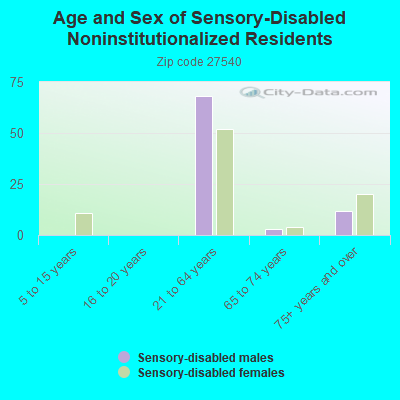
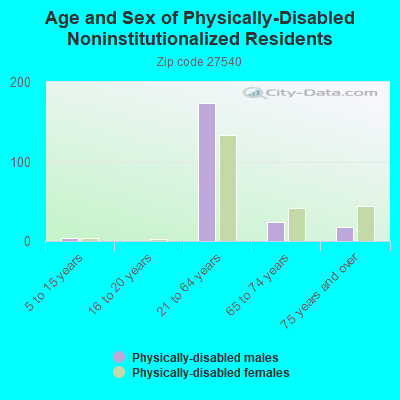
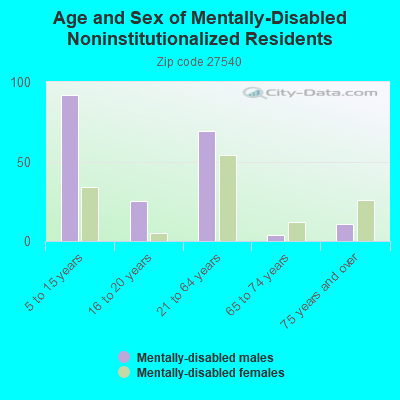
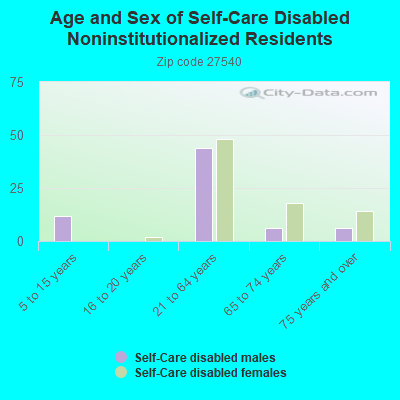
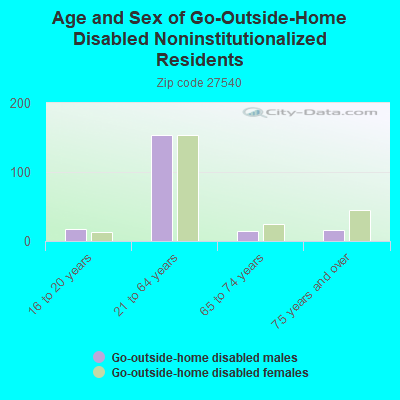
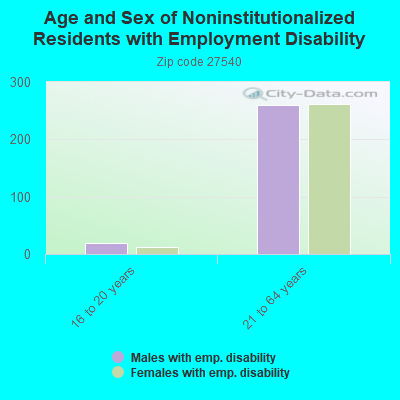
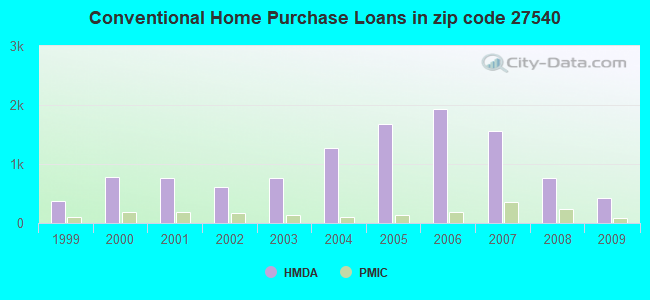
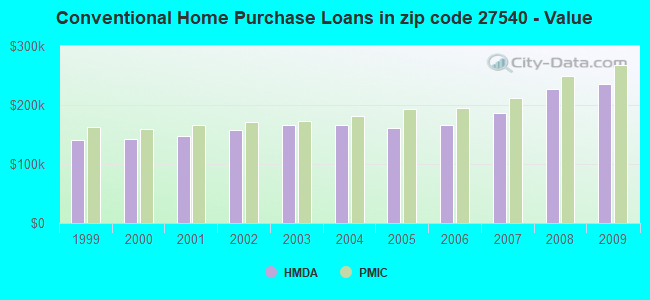
 According to the data from the years 2002 - 2018 the average number of fires per year is 71. The highest number of reported fire incidents - 101 took place in 2016, and the least - 4 in 2007. The data has an increasing trend.
 When looking into fire subcategories, the most reports belonged to: Structure Fires (50.3%), and Outside Fires (37.5%).